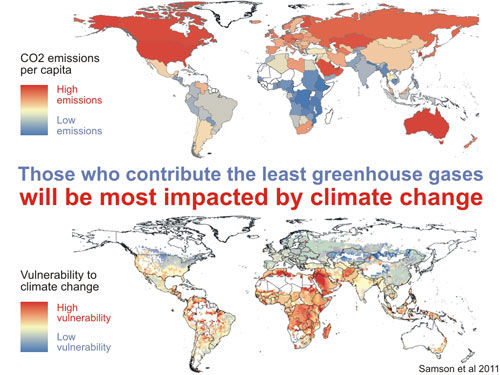

Top: National average per capita CO2 emissions based on OECD/IEA 2006 national CO2 emissions (OECD/IEA, 2008) and UNPD 2006 national population (UNPD, 2007), where red shows nations with high per capita emissions and blue shows nations with low per capita emissions.
Bottom: Vulnerability Index from Samson et al. (2011), where red shows regions that are more vulnerable to the impacts of climate change, blue shows regions that are less vulnerable, and white shows regions with little or no population. The regions most vulnerable to the impacts of climate change are generally those that contributed the least to the problem and also have the least infrastructure for managing and adapting to climate impacts. If those who are emitting the most greenhouse gases are the least affected by direct global warming impacts, how can they be motivated to change?
 |
The Skeptical Science website by Skeptical Science is licensed under a Creative Commons Attribution 3.0 Unported License. |