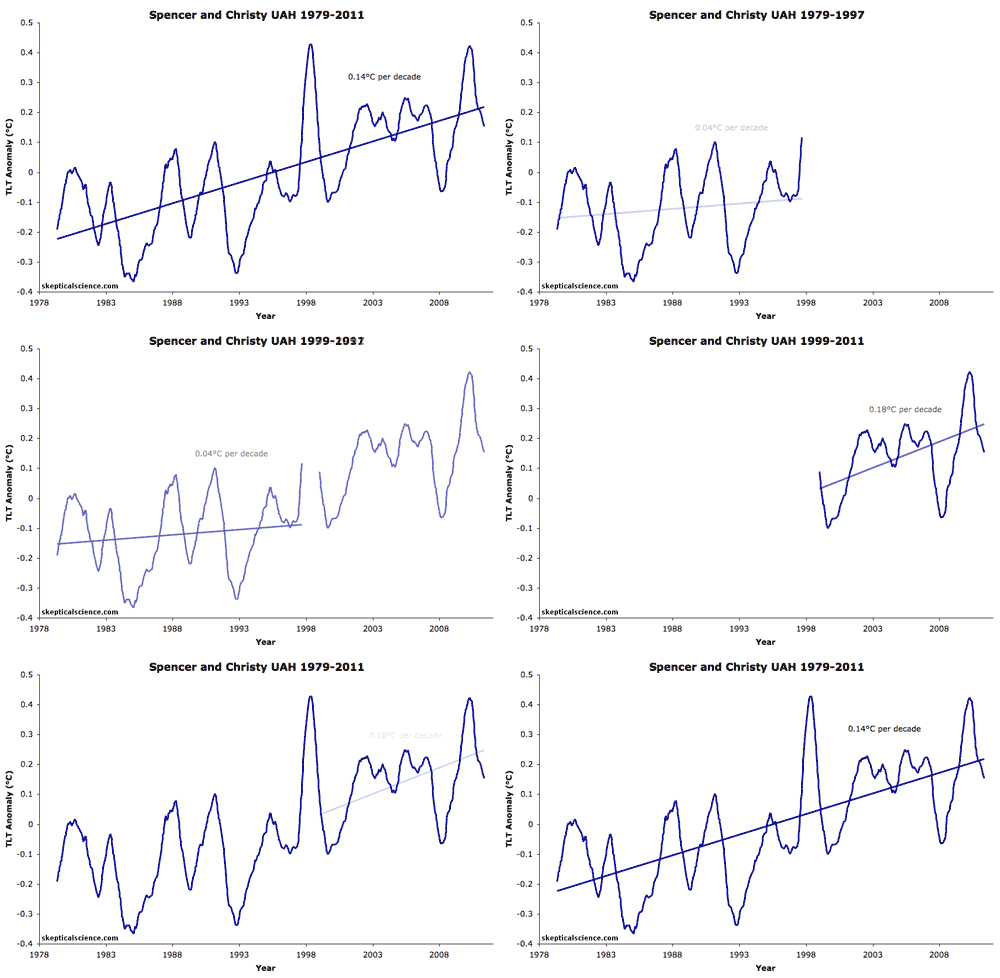

University of Alabama at Huntsville (UAH) satellite record of the change in the temperature of the lower troposphere (TLT) for the time period 1979 to 2011. The data were smoothed with a 12-month running average, and the linear warming trend of 0.14°C per decade is shown. Also shown are the data and linear trends for two shorter time periods that exclude the El Nino year of 1998, with trends of 0.04°C per decade for 1979 to November 1997, and 0.18°C per decade for January 1999 to November 2011. The shorter periods misrepresent the data in a manner known as "cherry-picking", by carefully choosing endpoints and choosing short time periods that are strongly affected by short-term noise that masks the underlying long-term climate signal seen in the full dataset. This graphic was developed to refute the erroneous claim in a UAH press release that the TLT record just shows a step change with no warming before or after the 1998 El Niño event, rather than continuation as usual of a global warming trend underlying short-term cycles including El Niño/La Niña and the 11-year solar cycle. Also see similar analysis and conclusions about the UAH data here.
 |
The Skeptical Science website by Skeptical Science is licensed under a Creative Commons Attribution 3.0 Unported License. |