Despite being the warmest decade on record, the last decade has seen a slowdown in the rate of global warming in some temperature datasets. The factors responsible for this slowdown have been discussed at SkS, most recently in the SkS post Ocean Heat Content And The Importance Of The Deep Ocean, which looked at three Hadley Centre climate models.
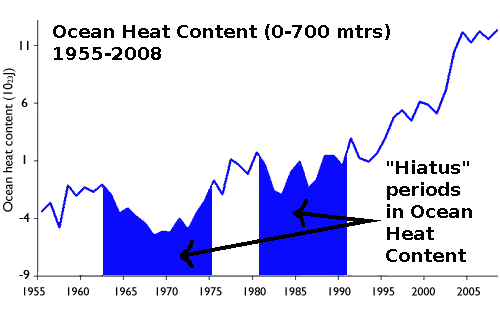
Meehl (2011) is also climate modeling-based study, which finds that decade-long periods of little or no warming are relatively common in the model simulations. This helps to explain why global warming is not a steadily rising, or monotonic trend, consistent with the temperature observations to date (Figure 1).

Figure 1 - Ocean heat content (0-700 mtrs) for the period 1955 to 2008. Adapted from Levitus (2009). Two periods of ocean warming hiatus highlighted in blue. Both periods exceed 10 years in length.
This see-sawing of upper ocean heat is simply part of the natural variability inherent in the climate, which occurs even during periods where the ocean is experiencing long-term warming. During these "hiatus" periods the surface layers of the ocean undergo little or no warming, but the ocean below undergoes substantial warming.
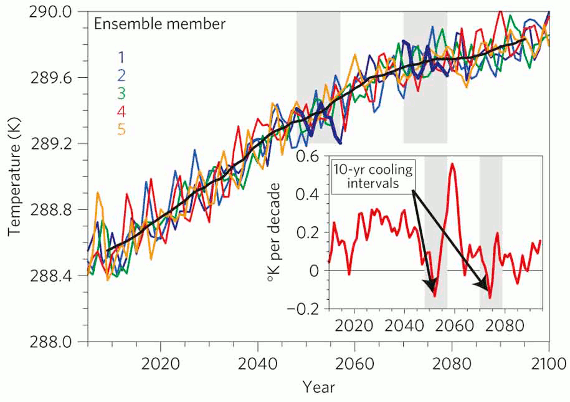
Meehl (2011) use the Community Climate System Model (CCSM4) to simulate a future global warming scenario where the top-of-the-atmosphere (TOA) energy imbalance is similar to that observed in the last decade. Five model runs in which the Earth system is accumulating heat but the global surface temperatures show decade-long hiatus periods are examined (Figure 2). Note that the declining trend in the later part of the 21st Century simulations in Figure 2 is due to the emissions scenario chosen - where CO2 emissions are supposed to decline.

Figure 2 - Annual mean (globally averaged) surface temperature for the 5 climate model runs examined. Coloured lines are the models runs and black line is the mean (average) of the model runs. Inset are two ten-year negative-surface-temperature-trend periods. From Meehl (2011)
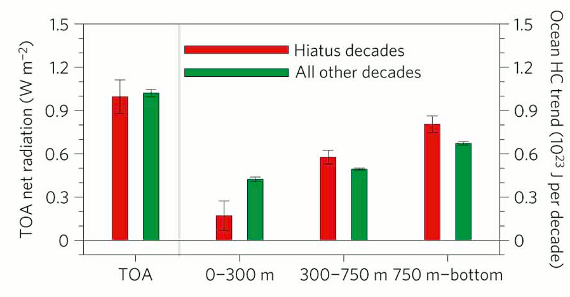
The authors look at the two hiatus periods (chosen because of the negative global surface temperature trend) from the 5 models runs shown above, plus 6 others from other model runs, giving a total of 8 hiatus periods from the model simulations. Analysing these hiatus periods reveals that, compared to other decades, a far greater amount of heat goes into the ocean in the 300 to 750 metre layer, and the 750 metre to ocean floor layer (Figure 3).

Figure 3 - composite global linear trends for hiatus decades (red bars) and other decades (green bars). Positive values for TOA net radiation (left-hand side) indicate energy accumulating in the system (i.e. global warming). Right-hand side shows ocean heat content decadal trends, for the various ocean layers.
The model therefore shows that greater amounts of heat are being sequestered in the deep ocean when global surface temperatures are in hiatus periods.
Looking at the ocean basins, in the model runs, the authors find various processes are at work in each basin. In the Atlantic and Southern Oceans, there is a marked drop in heat content in the upper 300 metre layer, with moderate increases in the layers below 750 metres. Meanwhile in the Pacific and Indian Oceans, the reduction in heat content in the upper 300 metre layer is much smaller, and the greatest increase in heat content occurs in the mid-ocean layer (300-750 metres).
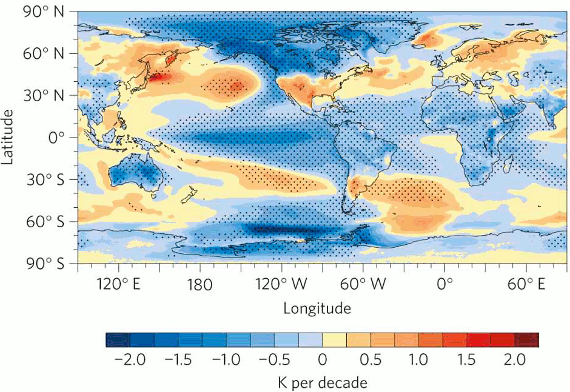
The general pattern of warming and ocean circulation in the model, during these hiatus periods, is very similar to that which occurs over shorter timeframes in the La Niña phase of ENSO. Strong upwelling in the equatorial eastern Pacific brings cold water up from the deep, which cools air temperatures in this region. Meanwhile in the subtropics of each hemisphere, heat is piling up and being driven down into deeper layers. The typical sea surface trend for these hiatus periods is shown in Figure 4.

Figure 4 - Composite average global surface temperature trends for hiatus decades, (from the climate models); stipling indicates 5% statistical significance (i.e a 5% probability the result was due to chance or statistical error). Orange-coloured ocean areas represent regions where OHC is converging and being driven down into the deep.
Not only does the climate model-based study, Meehl (2011), show heat is buried into deeper ocean layers when global surface temperatures stall, but it also presents plausible mechanisms in ocean circulation that transport heat down to the deep ocean. The general pattern of sea surface temperature during these hiatus periods is very reminiscent of a La Niña-like climate state.
The regular nature of these hiatus decades in the climate model, indicate that they are simply periods of natural variability, which occur even in the presence of a long-term warming trend. This is supported by historic observations (Figure 1), which shows roughly decade-long hiatus periods in upper ocean heat content during the 1960s to 1970s, and the 1980s to 1990s.
The natural variability 'flip-side' to these hiatus decades, are periods where there is greater-than-average surface warming (see inset in Figure 2). So at some point in the very near future we can probably expect surface temperatures to gather up a head of steam, and begin rising at a rapid rate.
Related SkS posts: Deep ocean warming solves the sea level puzzle, Billions of Blow Dryers: Some Missing Heat Returns to Haunt Us, Ocean Cooling Corrected, Again, and Ocean Heat Content And The Importance Of The Deep Ocean
Posted by Rob Painting on Sunday, 2 October, 2011
 |
The Skeptical Science website by Skeptical Science is licensed under a Creative Commons Attribution 3.0 Unported License. |