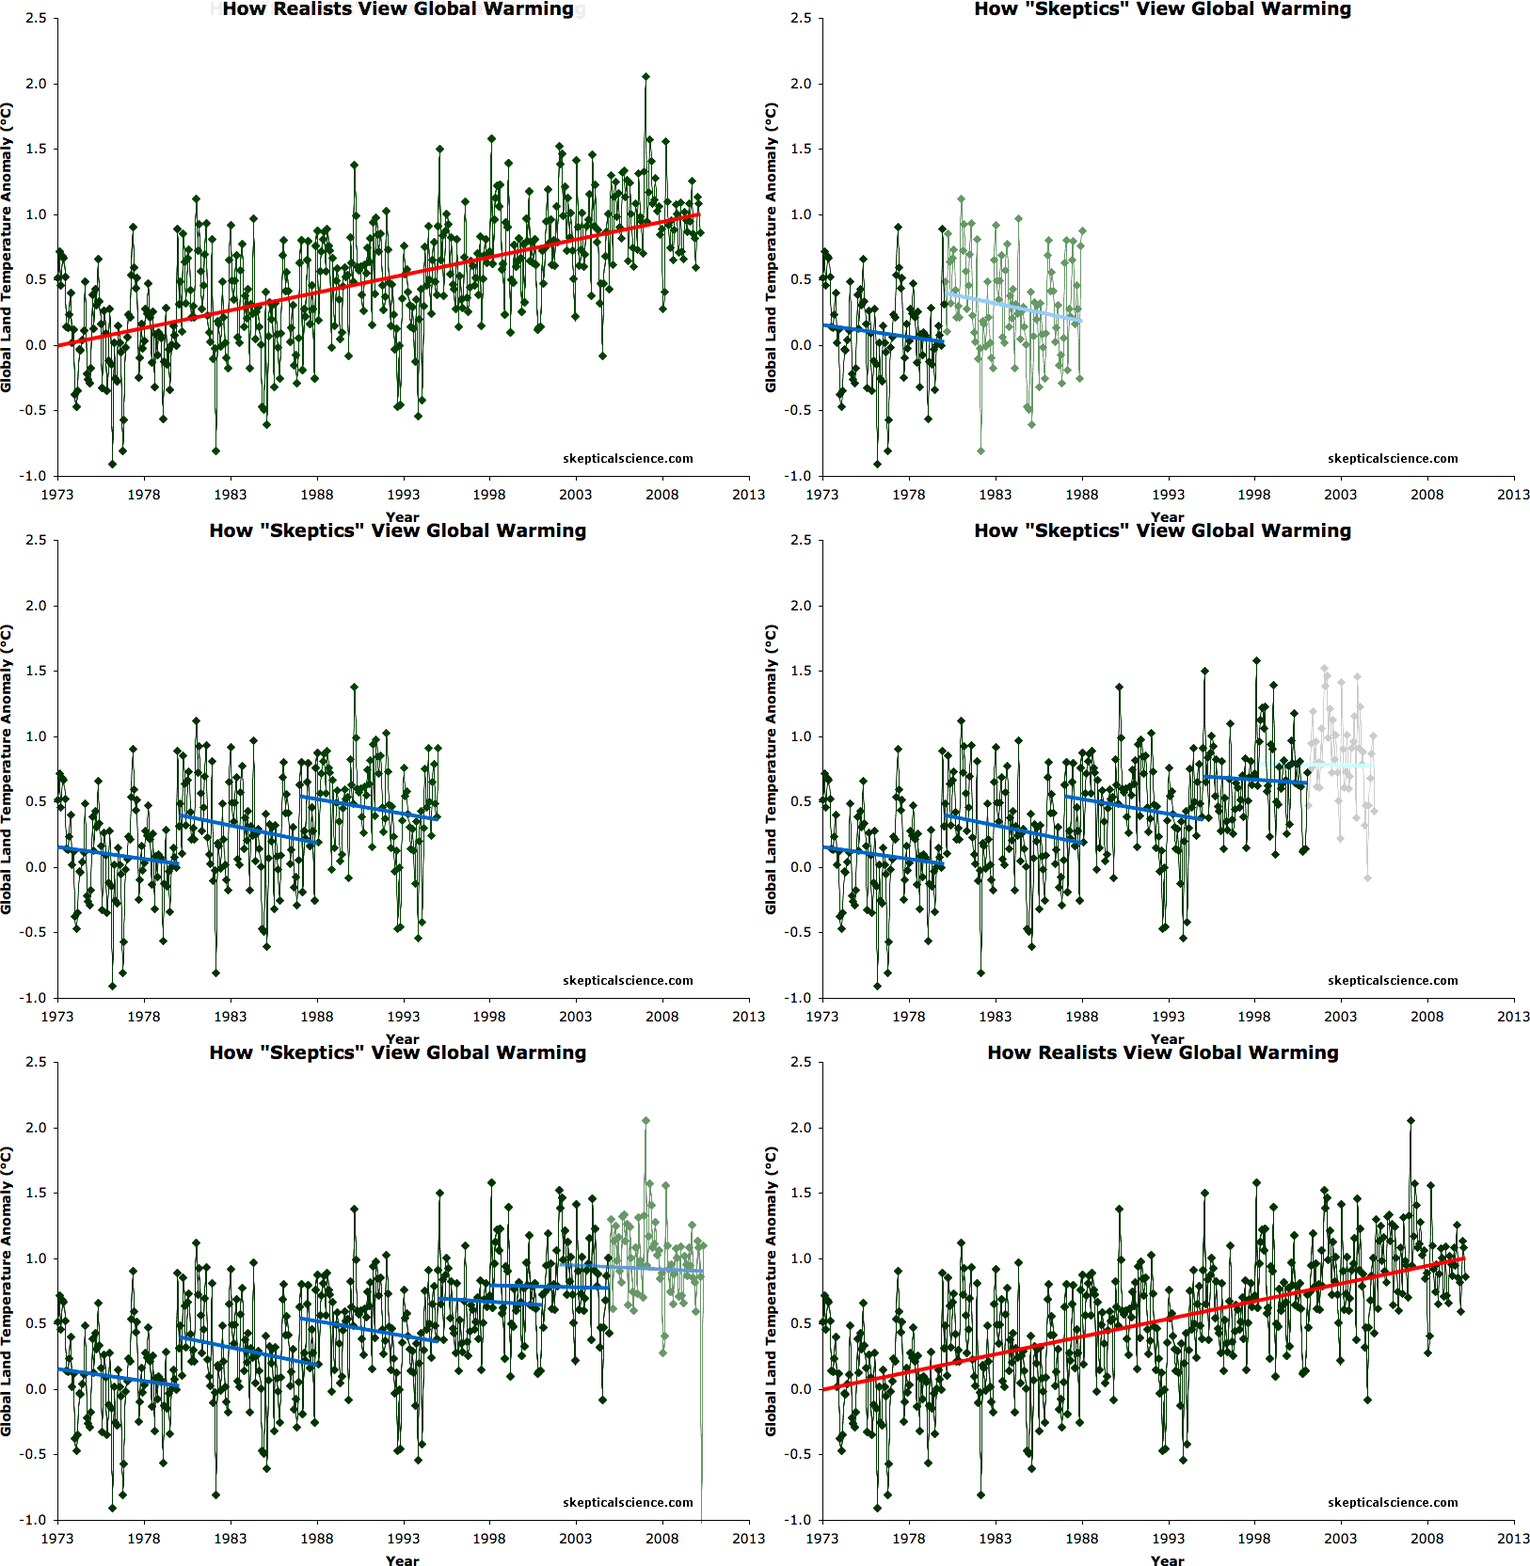
As we discussed in Going Down the Up Escalator, Part 1, it's a very common mistake - even amongst some climate scientists - to confuse short-term climate noise with long-term global warming signal. Our very popular Figure 1 below illustrates this confusion very nicely:
Figure 1: BEST land-only surface temperature data (green) with linear trends applied to the timeframes 1973 to 1980, 1980 to 1988, 1988 to 1995, 1995 to 2001, 1998 to 2005, 2002 to 2010 (blue), and 1973 to 2010 (red). Created by Dana Nuccitelli. Hat-tip to Skeptical Science contributor Sphaerica for identifying all of these "cooling trends." (Figure 1 has been added to the SkS Climate Graphics Page).
Some climate "skeptics" have suggested explanations as to why their interpretation of global warming shown in Figure 1 is actually the correct one. We will examine those explanations in this post.
Guest poster Jens Raunsø Jensen on WUWT created a very similar graphic to Figure 1, trying to argue that global warming can be modeled with step functions rather than a linear trend.
Figure 2: Jensen's plot of Denmark and global surface temperature, modeled as step functions triggered by Pacific Decadal Oscillation (PDO) shifts and El Niño events
On Judith Curry's blog, "skeptic" Donald Rapp makes much the same argument:
"Thorne et al. (2011) seemed not to be able to recognize the obvious fact shown in Figure 1 that tropospheric temperatures made a step function rise after the great El Niño of 1998 and was fairly constant before and after."
Figure 3: Donald Rapp's tropospheric temperature "step function"
Note by the way that each "skeptic" analysis relies on either HadCRUT or UAH/RSS temperature data, which are either known to or very possibly have a cool bias.
Roger Pielke Sr. echoes a similar argument from David Douglass on his blog (you may be noticing a similar cast of characters as in Part 1; Roy Spencer has also tried to blame global warming on oceanic cycles).
"[Douglass] would have “shouted” that calculating trends across a climate shift has no meaning."
This concept of a short-term "climate shift" may come from Tsonis et al. 2007 and Swanson and Tsonis 2009, whose work John Cook has previously discussed. In short, Swanson and Tsonis hypothesized that when various natural oceanic cycles (PDO, AMO, etc.) synchronize (i.e. in their positive or negative phases), they can cause a short-term warming or cooling which could be described as a "climate regime shift."
As John discussed in his post, there are some issues with this hypothesis (i.e. we know observed forcings like solar irradiance and aerosols can explain most past short-term temperature changes without requiring major contributions from these "climate shifts"). But more importantly, as Swanson and Tsonis put it, these shifts are superimposed on an anthropogenic warming trend. As Swanson himself put it,
"What do our results have to do with Global Warming, i.e., the century-scale response to greenhouse gas emissions? VERY LITTLE, contrary to claims that others have made on our behalf."
Further, Swanson 2009 discussed that if climate is more sensitive to internal variability than currently thought, this would also mean climate is more sensitive to imposed forcings, which means that we would still expect CO2 and other anthropogenic forcings to cause substantial warming.
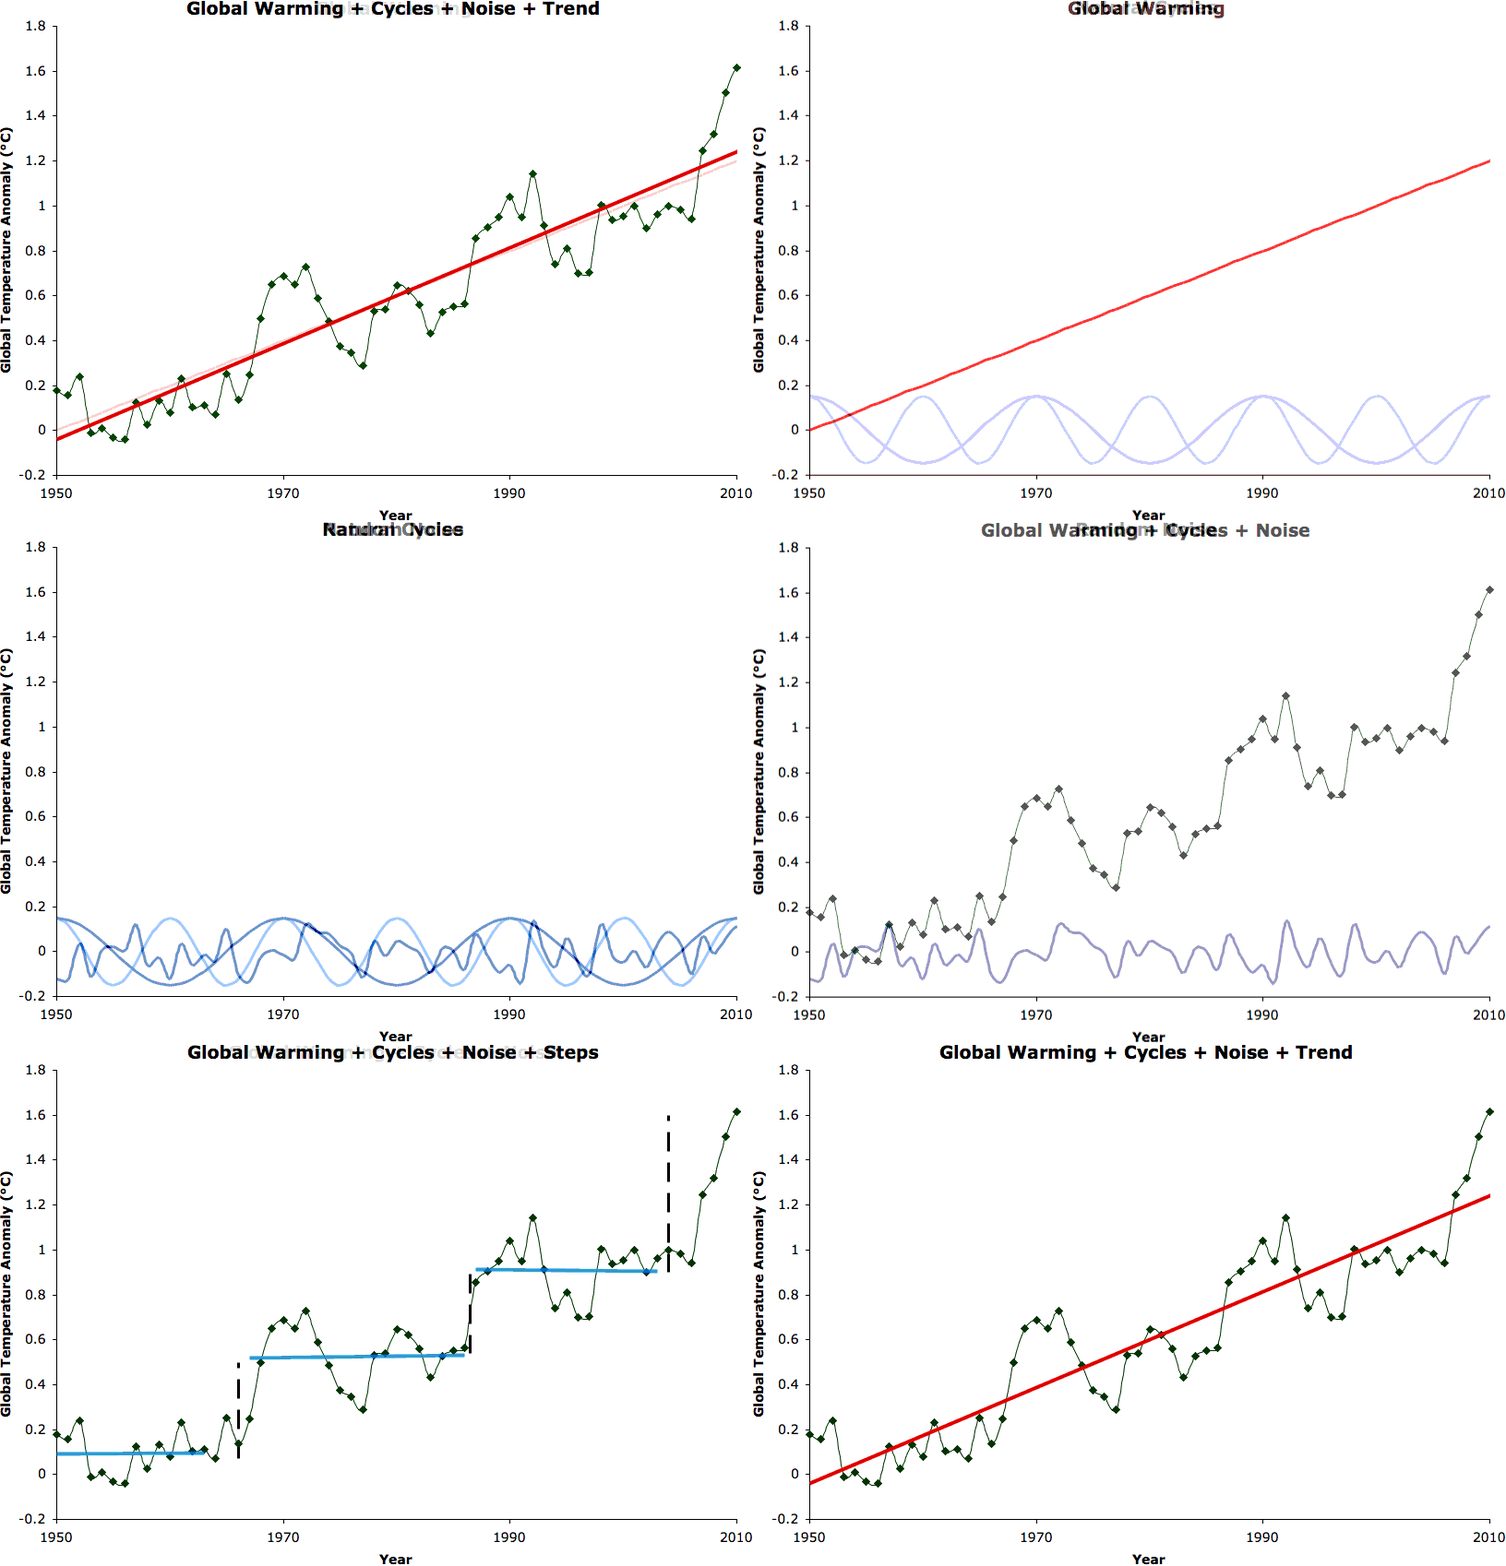
We can very easily demonstrate the fundamental flaw in this "climate shifts" argument by creating our own simulated temperature data. Figure 4 shows the following panels:

Figure 4: Simulated temperature data with a global warming signal (0.2°C/decade), natural cycles of 10 and 20 years, random noise, and the sum fit by a step function (blue and black) and a linear trend (red). Created by Dana Nuccitelli.
The point here is of course that while natural cycles superimposed on a linear global warming trend can be fit with a step function, the global warming is entirely caused by the linear trend (the radiative forcing, in the real world). The natural cycles have zero long-term trend and thus while they contribute to short-term temperature changes, contribute nothing to the long-term global warming.
Thus the "skeptic" conclusion that the step function is the appropriate model, and that natural cycles are what's causing global warming, is simply physically wrong.
The Achilles Heel of the "climate shifts are causing global warming" hypothesis is that it's simply not a physical argument, for several reasons.
1. Why would the average global temperature jump to a new warmer state after an El Niño or positive PDO, but not drop back down to its cooler state after a La Niña or negative PDO, for example? If the "skeptic" climate shift argument is correct, the planet will continue to warm indefinitely.
2. Oceanic cycles don't create or retain heat, they simply move it around. So if these climate shifts are causing the surface air to warm, they should also be causing the oceans to cool. That simply is not the case. The oceans, surface, and troposphere are all warming because the Earth's total heat content is increasing (Figure 5).
Figure 5: Total Global Heat Content (data from Church et al 2011). Created by John Cook.
3. The reason global heat content is increasing is that there is a global energy imbalance caused primarily by the anthropogenic greenhouse gas forcing. Arguing that the warming is caused by a "climate shift" ignores the physical reality that this forcing and energy imbalance must result in global warming. Not coincidentally, there is a strong correlation between the temperature and greenhouse gas forcing increases (Figure 6).
Figure 6: BEST land-only surface tempeature (yellow, left axis) vs. greenhouse gas radiative forcing (black, right axis). Created by Robert Way.
The bottom line here is that climate "skeptics" need to stop looking for excuses to use short-term noise to argue that global warming has stopped. It hasn't, and it won't until we get the radiative forcing in Figure 6 under control, which won't happen until we get our greenhouse gas emissions under control. That's simply physical reality, and denying physical reality won't change it.
The George Santayana quote "Those who cannot remember the past are condemned to repeat it" comes to mind. Climate "skeptics" keep arguing that the anthropogenic global warming theory is wrong by fitting trends to short-term data, and ignoring the underlying long-term trend. In each case their arguments have been proven demonstrably wrong, and yet they keep coming up with new variations on the same fundamentally flawed premise. All the while, the long-term global warming trend continues upward.
Note: this post is also the rebuttal to the myth "It's a climate shift step function caused by natural cycles"
Posted by dana1981 on Tuesday, 8 November, 2011
 |
The Skeptical Science website by Skeptical Science is licensed under a Creative Commons Attribution 3.0 Unported License. |