UAH Misrepresentation Anniversary, Part 1 - Overconfidence

 November 2011 marked the 33rd year of atmospheric temperature measurements from satellite instruments. Roy Spencer and John Christy at the University of Alabama (UAH) were effectively the originators of the satellite temperature record. Unfortunately, they marked this anniversary with a press release propagating much of the same misinformation about global climate change as they have throughout their careers at UAH. Spencer and Christy not only made a number of misleading statements in the UAH press release and in subsequent blog posts about it, they also ignored a body of scientific literature that contradicts their views on global climate change.
Downplaying Climate Change Risks
The press release starts off with a rather subjective and unsupported claim by John Christy:
"While 0.45 degrees C of warming is noticeable in climate terms, it isn’t obvious that it represents an impending disaster"
This statement is true, but misleading. By itself, 0.45°C warming of the lower atmosphere does not obviously represent an impending disaster. Add the fact that this warming occurred over a period of just 33 years, and the data becomes rather more alarming. Add the fact that this warming was predominantly caused by greenhouse gas emissions (more on this later) which continue to accelerate with no end in sight, and it becomes more alarming yet.
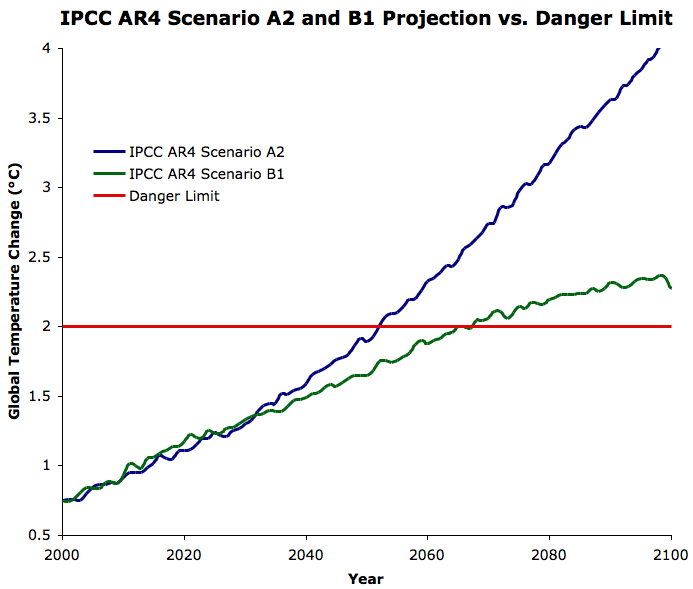
What Christy has done here is take a number out of context and present it in a way which makes it sound benign. We're not worried about the ~0.5°C over the past 30 years. We're worried about the 4°C to come over the next century if we continue on our current emissions path (Figure 1). And that undoubtedly would represent an impending disaster.

Figure 1: Average global surface warming (compared to pre-industrial temperature) projected under IPCC emissions scenarios A2 (business as usual; blue) and B1 (significant steps to reduce greenhouse gas emissions; green), compared to the 2°C 'danger limit' (red).
Modeled vs. Observed Lower Atmosphere Warming
Christy proceeds to make a similar statement to one we've seen before, that the temperature of the lower troposphere (TLT) is not warming as fast as climate models predict it should:
"The climate models produce some aspects of the weather reasonably well, but they have yet to demonstrate an ability to confidently predict climate change in upper air temperatures."
It's important to note that the climate model expectation of a faster-warming lower troposphere is based on fundamental atmospheric physics, as described by RealClimate:
"the increase in water vapour as surface air temperature rises causes a change in the moist-adiabatic lapse rate (the decrease of temperature with height) such that the surface to mid-tropospheric gradient decreases with increasing temperature (i.e. it warms faster aloft). This is something seen in many observations and over many timescales, and is not something unique to climate models."
Christy elaborated his statement above in a follow-up post on Spencer's blog, making several false assertions in the process, such as:
"bulk atmospheric temperatures in the climate system are warming at only 1/2 to 1/4 the rate of the IPCC AR4 model trends"
This statement is simply untrue, as demonstrated by Santer et al. (2011) in response to a similar statement made by Christy in testimony to US Congress:
"for the range of TLT trends considered here, there is no trend length at which the multi-model average trend, bf, is more than 1.73 times larger than bo, the average observed TLT trend"
Santer et al. found that the model-expected trend was on average 1.55 times larger than the UAH trend (the discrepancy was even smaller when using Remote Sensing Systems [RSS] data). Thus even using the UAH data which shows the least warming (more on this below), atmospheric temperatures are warming at 65% the rate of the model trends, which is well outisde Christy's claim of 25 to 50%.
Christy's exaggeration aside, it is true that according to UAH and RSS, the lower troposphere is not warming as fast as we expect from models and atmospheric physics. Globally, climate models predict that the lower atmosphere should warm approximately 1.2 times faster than the surface. According to UAH data, the surface is actually warming a bit faster than the lower atmosphere. There are three possible explanations for this discrepancy:
1) Our understanding of atmospheric physics is wrong, and the lower atmosphere should not warm faster than the surface.
2) The models and physics are right, but the surface temperature data are biased high.
3) The models and physics are right, but the satellite temperature data are biased low.
At this juncture, we don't know which of these explanations is accurate. In the quote above, Christy is assuming that #1 is the correct explanation, and other climate "skeptics" have previously assumed that #2 is correct. However, the most likely explanation may very well be #3, for reasons described by Andrew Dessler in an interview with Andrew Freedman:
"As far as the data go, I don’t really trust the satellite data. While satellites clearly have some advantages over the surface thermometer record, such as better sampling, measuring temperature from a satellite is actually an incredibly difficult problem. That’s why, every few years, another big problem in the UAH temperature calculation is discovered. And, when these problems are fixed, the trend always goes up. It’s also worth noting that there have not been any similar revisions to the surface temperature data, despite the fact that people have looked at it very, very carefully."
Dessler is referring to the complex nature of constructing a global temperature series from the satellite observations. The microwave sounding units (MSU) aboard the satellites don't actually measure air temperature, but rather the intensity of microwave radiation given off by oxygen molecules in the atmosphere, and the intensity of this radiation is a proxy for air temperature. Given that the radiation reaches the satellite sensors having travelled through a warming lower atmosphere and cooling stratosphere, that bias exists between the various sensors, issues with orbital decay, and a host of other obstacles, there's a lot of careful and painstaking analysis required, and much that can go wrong.
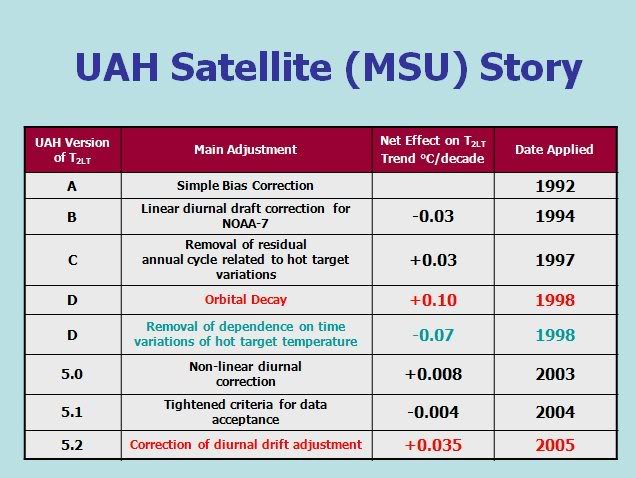
This is obvious in the continual corrections made to the UAH record, described by Dessler above and illustrated in Figure 2 (hat-tip to Eli Rabbett). To be fair, Dessler was incorrect to say that the trend always goes up after adjustments are made to UAH.

Figure 2: Major corrections to the UAH temperature trend over the years.
Major UAH Adjustments
As shown in Figure 2, there have been a number of major adjustments to the UAH temperature record over the years. There is of course nothing wrong with adjusting a temperature record to remove biases - science progresses, after all. There is, however, a problem when the authors of that record continually insist that there are no problems with the record, and overstating the accuracy and robustness of their data, as Spencer and Christy have a history of doing (as documented by Albatross). Further, in his follow-up post on Spencer's blog, Christy made a very incorrect statement about the causes behind the UAH corrections:
"The largest effect one sees [in the UAH corrections] is due to the spike in warming from the super El Nino of 1998 that tilted the trend to be much more positive after that date."
Figure 2 clearly shows this statement is false. The two adjustments in red (which correct for errors identified by scientists outside of UAH) alone account for 0.135 of the 0.138°C per decade UAH TLT trend - 98%! As Tom Curtis notes, the 1998 El Niño only accounts for approximately 0.008°C per decade (5.8%). Overall, the adjustments made to UAH (which resulted in both trend increases and decreases) account for half of the current UAH trend (0.069 of 0.138°C per decade).
Other Lower Troposphere Temperature Records
Additionally, as we've previously discussed, UAH is not the only group analyzing the satellite temperature data (although you wouldn't know it from Spencer and Christy's comments). Other groups estimate that the lower atmosphere warming is larger than in UAH (Table 1).
Table 1: Lower (TLT) and mid-troposphere temperature (TMT) estimates from various groups
| Group |
TMT Trend
(°C/decade)
|
TLT Trend
(°C/decade) |
| UAH |
0.05 |
0.14 |
| RSS |
0.09 |
0.14 |
| Fu et al. |
0.13 |
-- |
| V & G |
-- |
0.20 |
| Zou et al. |
0.13 |
-- |
| RATPAC |
-- |
0.18 |
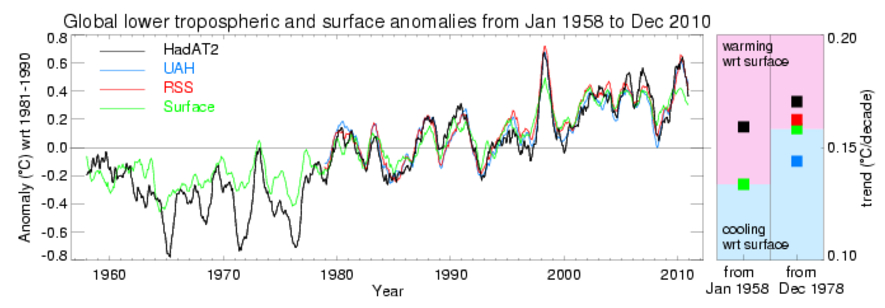
Note that the RATPAC radiosonde (weather balloon) data are in close agreement with the higher tropospheric temperature estimates, as are the HadAT2 radiosonde data (Figure 3).

Figure 3: HadAT2 radiosonde data (black) vs. UAH (blue) and RSS (red) lower troposphere temperatures, and HadCRUT3 surface temperatures (green)
This provides yet another reason why it is unwise to assume that UAH is correct and the models/physics or surface temperature data are wrong. It is the UAH data that is the outlier.
In Part 2 we'll examine several other misrepresentations and false claims in the UAH anniversary press release. There were simply too many to cover in one post.
Posted by dana1981 on Tuesday, 27 December, 2011

 November 2011 marked the 33rd year of atmospheric temperature measurements from satellite instruments. Roy Spencer and John Christy at the University of Alabama (UAH) were effectively the originators of the satellite temperature record. Unfortunately, they marked this anniversary with a press release propagating much of the same misinformation about global climate change as they have throughout their careers at UAH. Spencer and Christy not only made a number of misleading statements in the UAH press release and in subsequent blog posts about it, they also ignored a body of scientific literature that contradicts their views on global climate change.


