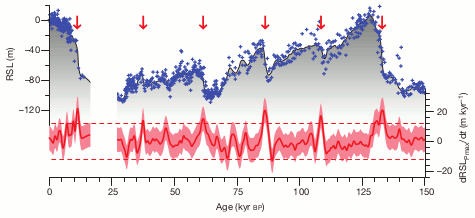

Figure 1 - Sea level reconstruction from 150,000 years ago to the present. Relative sea level (RSL) in grey-shaded area, with RSL data in blue crosses. The downward-pointing red arrows indicates peaks in sea level rise exceeding 1.2 metres per century (12mm per year). The break in the record is due to the absence of foraminifera (upon which the reconstruction is based) as a result of excessively salty seawater during the last ice age. Adapted from Grant (2012).
The last few million years of Earth's climate has been dominated by the ice age cycles. These consisted of long cool periods (glacials) where giant icesheets have grown on the continental land masses at, and near, the poles. With the water evaporated off the oceans being locked up as ice on land, this ice sheet build-up substantially lowered global sea level. During the shorter, warmer, intervals (interglacials) the ice sheets have disintegrated, and with their glacial meltwater draining back into the oceans, sea level has risen. From the coldest part of the last ice age (roughly 20,000 years ago) to present, global sea level has risen an astounding 120 metres.
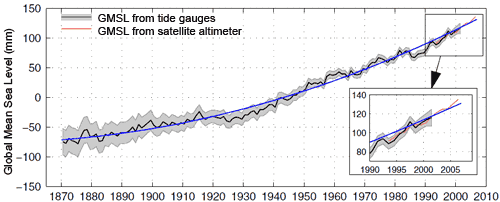
Although all the details are not well understood, the driving force behind these glacial/interglacial cycles are slow variations in Earth's orbit as it circles the sun, which slightly decreased/increased the amount of sunlight reaching the planet's surface. For the current interglacial, the orbitally-driven warming eventually came to an end after the Holocene Climatic Optimum (HCO), and by 4-5000 years ago all the vulnerable land-based ice had disappeared. The volume of the global ocean was static until the arrival of the Industrial Revolution, and by the 19th Century global sea level had begun to rise again. Despite undergoing short-term accelerations, and decelerations, globally-averaged sea level has undergone long-term acceleration up to the present day (Church & White [2006] , Merrifield [2009]).

Figure 2 - Global mean sea level from 1870 to 2006 with one standard deviation error estimates (Church 2008).
With some 60-70 metres worth of global sea level equivalent locked up in the vast ice sheets of Greenland and Antarctica, and with global warming well underway, it raises the question of how much sea level rise we are likely to see this century (and beyond), and just how fast this might happen. Because the dynamics of ice sheet disintegration are only very crudely known, and ice sheet modelling is in its infancy, there is a large range of estimates of future sea level rise. Many now seem to converge on 1-2 metres of sea level rise by 2100 - much higher than current rates. But is this realistic? A recent paper, examining past ice sheet disintegrations, lends credence to these estimates.
A peer-reviewed paper, Grant (2012), outlines how the authors created a well- dated, and near-continuous, record of sea level over the last 150,000 years, a period which spans the last interglacial (the Eemian), and the last glacial maximum. Of particular interest is the finding that, during all periods of major global ice volume loss, rates of sea level rise reached at least 1.2 metres per century. An arguably more important finding that the more finely resolved dating uncovered, was that major ice sheet reductions (as implied by sea level rise) followed polar warming much quicker than had previously been suspected.
The backbone of the sea level reconstruction are Foraminifera (forams), tiny shelled marine creatures which float in the water column (planktic), or live on the seafloor (benthic). Because they utilize minerals dissolved in the surrounding seawater to build their shells, forams incorporate elements into their shells which can provide information about the climate at the time in which they lived. Examination of oxygen-18 isotope ratios in the shells of forams, retrieved from Red Sea sediment cores, has revealed that they serve as a useful proxy for relative (i.e local) sea level in the Red Sea (see Siddall [2003] & Siddall [2004]). Although a near-continuous record of relative sea level for the Red Sea has been constructed (Rohling [2009]), accurate, and independent, dating for comparison with ice-core data has proven problematic. Grant (2012), however, came up with a clever way around this roadblock.
Much like the Red Sea, the Eastern Mediterranean Sea is a basin with only one narrow natural opening (The Strait of Gibraltar) which connects it to the rest of the oceans. This "basin effect" was exploited to build a sea level history in the Red Sea, because the extremely slow exchange of seawater within the basin means long local seawater residence times. The raising or lowering of sea level therefore acts to either shorten, or prolong the residence time of local seawater, and also diminish or enhance the powerful rate of evaporation in the basin. In other words, changes in the oxygen-18 isotopes ratios, found in Red Sea foram fossils, are extremely sensitive to sea level variations. So the isotopes are, in effect, recorders of local sea level.
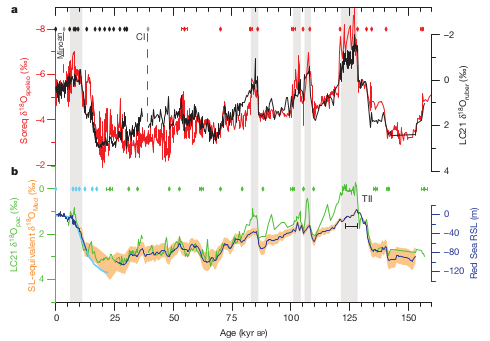
Grant (2012) likewise created a sea level history for the eastern Mediterranean Sea, with one distinct improvement; they were able to independently date the sea level variations by taking advantage of oxygen-18 isotopes stored in cave mineral deposits (speleothems) on land downwind of the eastern Mediterranean surface waters. With oxygen-18 isotopes in fossilized forams, and in the cave deposits (Soreq Cave), linked via the hydrological cycle, Uranium-Thorium dating of the cave deposits therefore gave an accurate date for both, and consequently the timing of sea level variations.
Because of the more complicated weather patterns in the Mediterranean however, the Mediterranean sea level history cannot be used to determine sea level variations with sufficient precision (Rohling 1999). To do that, the authors transferred their new Mediterranean chronology to the Red Sea sea level history. The basin isolation effect of both sea level records, gave sufficient oxygen isotope signal similarity for accurate transfer. The validity of this newly-dated sea level reconstruction was confirmed by comparison to other dated sea level benchmarks.

Figure 3a - Correlation of Soreq Cave (red line) and eastern Mediterranean (black line) oxygen-18 isotope signals. 3b - Eastern Mediterranean Sea oxygen-18 isotope record from another foram species (green line) and the highest probability sea level curve (blue line). The coloured dots and grey-shaded columns denote other paleodata used to validate and synchronize the reconstructions. From Grant (2012).
With an accurately dated sea level reconstruction now available, the authors were able to compare these sea level variations in time with that of polar temperature, as ascertained by ice cores extracted from the Greenland and Antarctic ice sheets. Within the sea level reconstruction there are 6 periods where sea level rose rapidly, reaching rates of at least 1.2 metres per century - around 4 times the current rate of sea level rise (see Figure 1).
Considering that humans have been warming the climate for several centuries, a more significant finding was the short time lag between warming at the poles (as shown in the ice cores), and the response of sea level rise - which implies the disintegration of the ice sheets. In the case of Antarctica, large ice reductions occur within 400-700 years, and for Greenland, ice reductions occur very quickly - within 100 years.
Despite glacial periods having much more vulnerable ice at lower elevation, and closer to the equator than interglacials, the orbitally-driven warming which eventually disintegrated the ice sheets was a leisurely affair. Ice sheet collapse came quickly due to the greater proportion of vulnerable ice. By comparison; today there is far less vulnerable ice, but the warming has been virtually instantaneous, in geological terms. In fact, in the last 300 million years, the Earth has not experienced (as far as we know) such a rapid rise in atmospheric carbon dioxide (Hönisch [2012]).
The altered characteristics of the background climate state, from glacial to interglacial, makes a direct comparison for modern-day difficult. But current sea level rise estimates, and the rates of rise shown in the reconstruction, are in the same ballpark. With global warming having been underway for several centuries now, and with the Antarctic and Greenland ice sheets undergoing accelerated ice mass loss due to polar warming, the past 150,000 years of sea level history suggests we should expect much higher rates of sea level rise in the future.
Posted by Rob Painting on Friday, 7 December, 2012
 |
The Skeptical Science website by Skeptical Science is licensed under a Creative Commons Attribution 3.0 Unported License. |