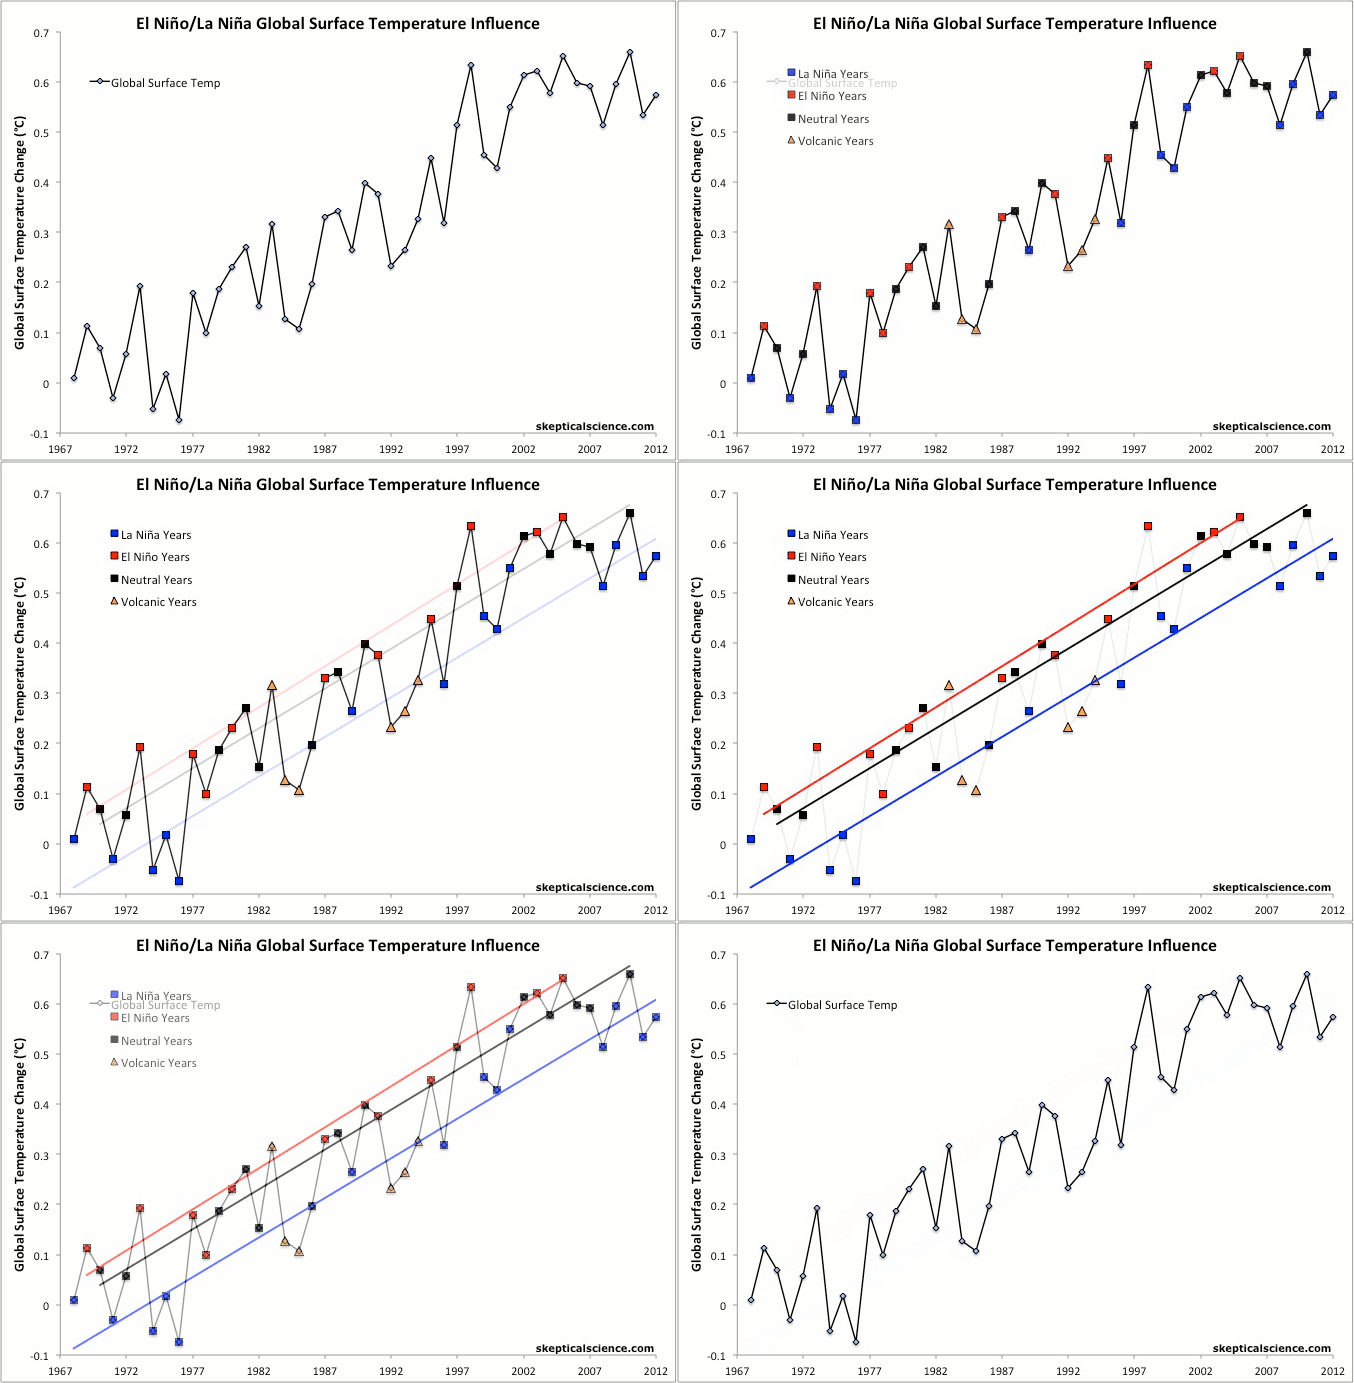
Recently, the National Oceanic and Atmospheric Administration (NOAA) announced that 2012 was the hottest "La Niña year" on record Update, NOAA now lists 2012 as the third-hottest La Niña year on record.
NOAA defines a La Niña year as one in which the first 3 months meet the La Niña criteria that the Oceanic Niño Index (ONI) is less than -0.5. The ONI, in turn, is the 3-month running average of sea surface temperature anomalies in the Niño 3.4 region of the Pacific Ocean. This is certainly one reasonable definition of a "La Niña year", but what about the other 9 months of the year? And what about the other indices that are indicative of changes in the El Niño Southern Oscilation (ENSO), like the Multivariate ENSO Index (MEI) and Southern Oscillation Index (SOI)? There are certainly many ways that a "La Niña year" could be defined.
Here I attempt to simplify this question with an update to the analysis first proposed by John Nielsen-Gammon. Rather than define a somewhat arbitrary threshold for a La Niña/El Niño year (i.e. based on the size of the index and number of months exceeding a certain threshold) or limiting the analysis to one ENSO index, I first took the average of the three indices mentioned above (ONI, MEI, and SOI, accounting for the fact that positive SOI indicates La Niña conditions while the opposite is true for ONI and MEI).
I then examined the data over the past 45 years, and split the average annual ENSO index in three, defining the 15 years having the largest La Niña influence as "La Niña years", the 15 years having the largest El Niño influence as "El Niño years", and the 15 years in the middle as "Neutral years". In this analysis I assumed a 4-month lag between changes in ENSO and changes in global surface temperature, consistent with the results in Foster & Rahmstorf (2011).
In essence, I'm simply grouping the years whose temperatures had the most (in the uppermost 33%) La Niña/El Niño influence over the past 45 years, and seeing what those groupings tell us. I excluded years which were strongly influenced by the El Chichón (1983–1985) and Mount Pinatubo (1992–1994) volcanic eruptions (because large eruptions release particulates into the atmosphere which cause a strong short-term cooling), and looked at the temperature trends in each of the three categories (Figure 1).
Figure 1: NOAA annual global surface temperatures from 1968 through 2012 with La Niña years in blue, El Niño years in red, ENSO neutral years in black, and volcanic years as orange triangles. Linear trends for 1968–2012 for each of the three categories (excluding volcanic years) are shown in the final frame. Updated on the SkS animated graphics page.
The results are pretty interesting. The trend for each of the three categories is 0.16°C per decade warming of global surface temperatures, consistent with the results in the analysis for Kevin C's "16 years" video.
2012 may reasonably be called a La Niña year (and the 2nd-hottest one on record, behind 2009), but it was not a strong one because ENSO switched to quasi-El Niño conditions for a few months in mid-2012, finishing the year in ENSO neutral conditions after the La Niña start to the year. Based on my methodology, 2012 was the 14th-strongest La Niña year in the past 45 years, with a similar La Niña influence to those in 1968, 1996, 2001, and 2009. According to NOAA, 2012 was 0.56°C hotter than 1968, 0.25°C hotter than 1996, 0.02°C warmer than 2001, and 0.02°C cooler than 2009.
Of course as Kevin's video shows, ENSO isn't the only factor in addition to greenhouse gases to influence annual global surface temperatures. There's also solar activity, human particulate emissions, other oceanic cycles, etc. Nevertheless, as Figure 2 shows, 2012 falls very close to the long-term trendline for La Niña years.
It's also interesting to note that four of the past five years qualify as La Niña years in my methodology - they are in the top 33% of the strongest La Niña-influenced years since 1968. There has not been a similar El Niño year since 2005. And half of the last 14 years qualify as La Niña years, compared to just two El Niño years since 1999. Six out of the prior eight years (1991–1998) qualified as El Niño years, although three of those were obscured by the Mount Pinatubo eruption.
In short, global surface temperatures in the 1990s were mostly amplified by El Niños, while those in the 2000s and 2010s thus far have mostly been dampened by La Niñas - a recipe for a temporary surface warming 'pause'. But when we break the data into La Niña/El Niño/Neutral categories, or when we filter out their effects as Kevin C did, we see that the underlying global surface warming trend of approximately 0.16°C per decade remains beneath the short-term noise.
Posted by dana1981 on Monday, 21 January, 2013
 |
The Skeptical Science website by Skeptical Science is licensed under a Creative Commons Attribution 3.0 Unported License. |