Climate scientists have traditionally looked at climate over long periods - 30 years or more. However the media obsession with short term trends has focussed attention on the past 15-16 years. Short term trends are much more complex because they can be affected by many factors which cancel out over longer periods. In a recent interview James Hansen noted "If you look over a 30-40 year period the expected warming is two-tenths of a degree per decade, but that doesn't mean each decade is going to warm two-tenths of a degree: there is too much natural variability".
Over the winter vacation we produced a video which tried to explain the contributions to the recent temperature trend based on the best evidence available at the time, however the rapid pace of development in this area has thrown significant doubt on the conclusions. While the video has significant educational content, the conclusions do not reflect a scientific consensus, so we will be withdrawing it and will work on an updated version.
The video was based on an approach pioneered by Lean and Rind (2008) and Foster and Rahmstorf (2011), by determining the contribution of known influences on global temperature to best explain those temperatures. However this approach can give misleading results if significant influences on temperature are missing from the analysis, or if wrong influences are included. Therefore we need a comprehensive list of possible factors which might affect the short term trend. Based on the latest literature, the following should be considered:
Natural influences (included in the 16 years video):
Observational biases (not included in the video):
Other short term influences (i.e. things we are trying to detect):
There may also be contributions from long term ocean cycles such as the AMO and PDO. Any of these factors may contribute to a slowdown in surface warming over the past 16 years.
Here is the problem: We have too many explanations for a recent slowdown, If all of these influences are present, we should probably have seen significant cooling over the past 16 years. And yet if the simple fitting calculation is correct, there has been little or no change in the underlying rate of warming.
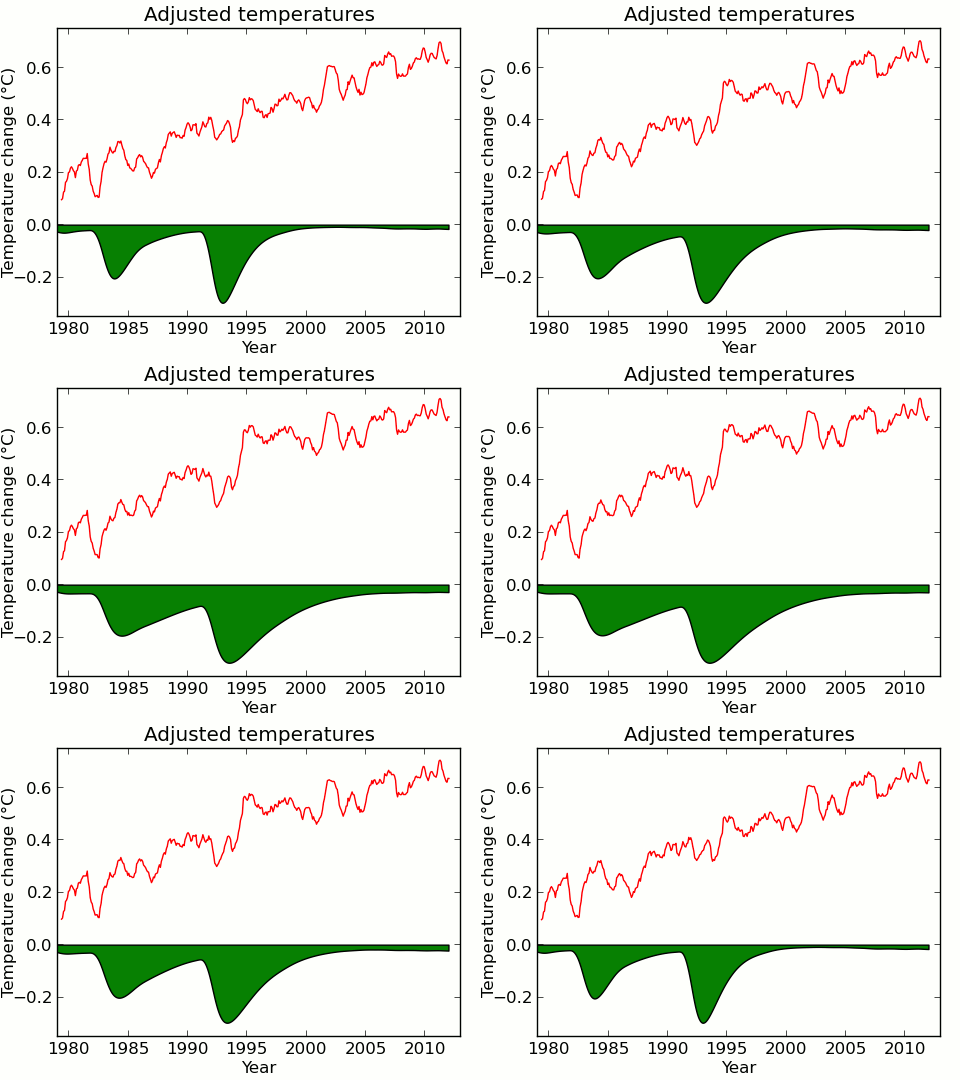
How is this discrepancy to be resolved? On the basis of analysis by Troy Masters (part 1, part 2), I believe that the most significant problem lies in fitting the volcanic response. While the magnitude of the volcanic response is fairly well estimated, its duration is not. Changes in the duration of the response translate to a big change in the adjusted trend since 1997. The following animation shows the problem:

If the Pinatubo cooling is long lived then some of the recent warming is due to a recovery from that cooling, leaving less to be explained by greenhouse warming. Or conversely, if there has been a slowdown in warming, the simple fit would account for it by demanding a short Pinatubo response.
What does the literature say about the Pinatubo response? There are papers supporting both a long response (and thus a reduction in the adjusted temperature trend) and a short response (and thus no reduction in trend). Here are a sampling:
| Short Pinatubo Response | Long Pinatubo Response |
| Parker et al 1996 | Soden et al 2002 |
| Lean & Rind 2008 | Bender et al 2010 |
| Foster & Rahmstorf 2011 | Hansen et al 2011 |
| Folland et al 2013 | Rypdal 2012 |
| Merlis et al | |
| Survey by Troy Masters |
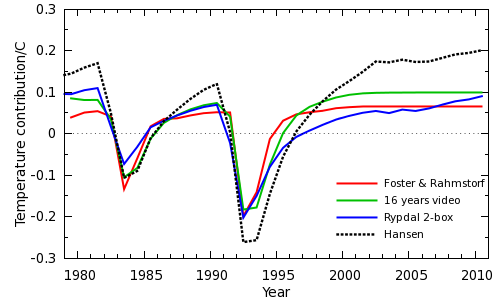
The volcanic temperature response from the video is compared to three different estimates from the table above in Figure 2:

Hansen et al (2011) produces the strongest volcanic contribution to recent trends. The impact of this difference can be seen in the adjusted trends since 1997, and the contributions of the various influences.
| 16 years | Hansen | ||
| Observed trend | 0.080 | 0.080 | |
| Volcanic | - | 0.010 | 0.082 |
| Solar | - | -0.014 | -0.012 |
| El Niño | - | -0.041 | -0.045 |
| Adjusted trend | = | 0.124 | 0.056 |
The Hansen paper is an extreme case, combining a strong volcanic forcing with a model with high sensitivity, and so probably provides an upper bound for the volcanic influence on temperature. That effect is however substantial, more than cancelling the effect of the El Niño and solar influences, and producing an adjusted trend which is less than the observed trend.
Where does this leave us? In order to reliably interpret surface temperature variations we need a good idea of all the causal factors, including El Niño, solar irradiance, volcanic eruptions, observational biases, changes in ocean circulation and possible long term oscillations. Fitting the surface temperature record is attractive because surface temperatures are easy to understand, and the calculations are easily reproducible by non-specialists. However it may be that the surface temperature record is simply too complex to analyse in this way. The more direct measure of global warming provided by measuring the energy content of the climate system avoids many of these problems, although the observational record is shorter and less complete (e.g. Church et al 2011).
There will undoubtably be new developments in the measurement and attribution of short term trends over the coming months, and we will report new results as they are released. The '16 years' video still contains useful material for showing how natural influences impact global temperatures and so we aim to produce a new version in future. However the conclusions of the current video do not represent a consensus in the peer-reviewed results, and thus we will be withdrawing the current version.
Posted by Kevin C on Tuesday, 21 May, 2013
 |
The Skeptical Science website by Skeptical Science is licensed under a Creative Commons Attribution 3.0 Unported License. |