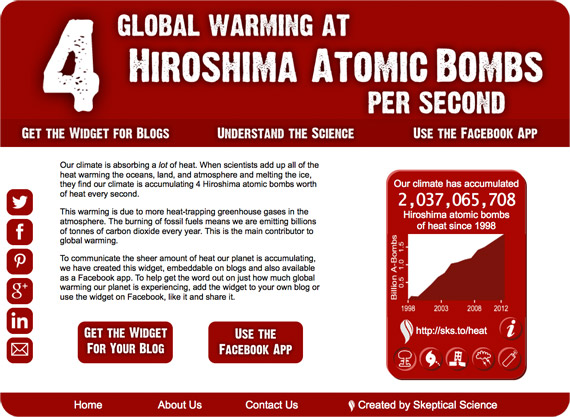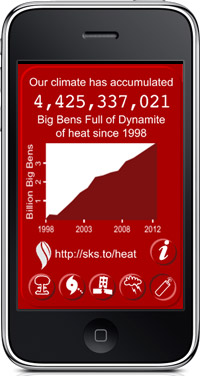
This is a working version of the widget, as it would appear on the sidebar of a blog. To use it, just click the buttons.
Our planet is building up a lot of heat. When scientists add up all the heat warming the oceans, land, atmosphere and melting the ice, they calculate that our planet is accumulating heat at a rate of 2.5x10¹⁴ Watts. This is equivalent to 4 Hiroshima bombs worth of heat per second.
When I mention this in public talks, I see eyes as wide as saucers. Few people are aware of how much heat our climate system is absorbing. To actively communicate our planet's energy imbalance, Skeptical Science is releasing the Skeptical Science Heat Widget.
The widget can be added to just about any blog or web site. You can customise the colour of the widget, the style of the design and even the year from which the heat graph begins. It's the result of months of diligent programming and testing by SkS team member Bob Lacatena (Sphaerica). If you have a webpage or blog, here's an opportunity to help raise awareness of global warming.
If you don't have a website but are on Facebook, Bob has also put together a Facebook app and an app for the iPad and iPhone. For complete instructions on how to get and install the widget on your blog or web site, visit the Skeptical Science Widgets page.
The widget shows the amount of energy that has been and continues to be added to the earth's climate system, expressed in ways that non-scientists can more easily relate to. Meanwhile, the counter actively increases with time, showing exactly how much and how fast the planet continues to warm.
For more information on the science behind the heat in the climate system, visit the widget's companion site, 4hiroshimas.info. This website was put together by Bob, in collaboration with the SkS team.
It is important to communicate the incredible scale of the planet, the climate, and what our ongoing dependence on fossil fuels is doing to the climate system. You can contribute to that awareness simply by adding the widget to your blog or sharing it with people you know through Facebook, Twitter, Linked In, Google Plus, and Pinterest. You can easily do so with the buttons on the back of the widget (click the "info" button on the front) or the buttons at 4hiroshimas.info.
 The iPad and iPhone App
You can use the iPad/iPhone app to show the counter to friends, family and co-workers. To get the iPad/iPhone app, visit 4hiroshimas.info on your device and look for the big red "Get..." button or click here to go to the instructions. Please note that you must use an iPhone or iPad to see the instructions page, and it is the only way to get the app. The app is not available on the Apple App Store, it's distributed as a "Web App."
When Dana Nuccitelli and John Cook first conceived of the widget, it was to counter a misconception that has gained in popularity over the last year - that global warming has stopped since 1998 (or sometime around then). People who deny global warming fail to take one simple fact into account - our planet continues to build up heat. In fact, the heat build-up hasn't slowed down at all over the last few decades - it has increased. The laws of physics did not cease to operate after 1998 and the greenhouse effect continues to blaze away. Our widget demonstrates this in strong, clear, visual terms.
![]() Every day the planet adds the equivalent, in heat, of the energy released by the detonation of 343,008 atomic bombs of the size dropped on Hiroshima.
Every day the planet adds the equivalent, in heat, of the energy released by the detonation of 343,008 atomic bombs of the size dropped on Hiroshima.
Every day the planet adds the equivalent, in heat, of the energy needed to power 153,792 hurricanes of the magnitude of Hurricane Sandy.
Every day the planet adds the equivalent, in heat, of the energy released by 43.2 billion lightning bolts.
According to one study (Levitus et al, 2012):
"We have estimated an increase of 24x1022 J representing a volume mean warming of 0.09°C of the 0-2000m layer of the World Ocean. If this heat were instantly transferred to the lower 10 km of the global atmosphere it would result in a volume mean warming of this atmospheric layer by approximately 36°C (65°F)."
The total heat content data used in the widget has been taken from Nuccitelli et al (2012), which in turn took the atomsphere, land and ice melt data from Church et al (2011), and the ocean temperatures above 2000 meters from Levitus et al (2012).
If you are frightened by recent developments (Japan reneging on its prior emissions targets, record global emissions, repeated extreme weather events, and others), then you can help to spread the message about climate change, and the science behind climate change, by both hosting the widget itself and using social media to help it spread.
Get involved, and help to spread the knowledge that our climate is warming at the rate of 4 Hiroshima atomic bombs per second – and we're doing very little to stop it.
Posted by John Cook on Monday, 25 November, 2013
 |
The Skeptical Science website by Skeptical Science is licensed under a Creative Commons Attribution 3.0 Unported License. |