The greenhouse effect, where some atmospheric gases let through sunlight but absorb the infrared heat given off by Earth, can be understood in amazing detail by starting off with the spread of colours in a rainbow or on an oil slick. Greenhouse gases warm Earth’s surface by about 33 C and the carbon dioxide we’re releasing by (mostly) burning coal, oil and gas is seen by 97% of climate scientists to be causing most of the recent global warming.
This is a very unpopular message, and it has been attacked using loads of myths we’ve covered on Skeptical Science. One of the most ‘out there’ is that the greenhouse effect doesn’t exist, so carbon dioxide can’t cause global warming (e.g. quoted here).
These claims are not taken seriously by climate scientists, missile designers, laser physicists, astrophysicists or meteorologists. Even self-styled 'skeptical' blogger Anthony Watts doesn't buy it.
The greenhouse effect is measured by instruments like this one every single day:

Figure 1: A pyrgeometer, a device for measuring infrared light coming down from the sky. Even at night it measures infrared, thanks to the greenhouse effect (image: Wiki).
And if these greenhouse skeptics were right, then lasers and heat-seeking missiles wouldn’t work like they do, and we couldn’t have measured the afterglow of the Big Bang either.
But what about rainbows and oil slicks? They reveal something very important about light: we can split it up into different colours. It even comes in colours we can’t see like infrared or ultraviolet. Greenhouse gases in the sky shine down infrared light on us day and night, keeping us warm. And more greenhouse gases equals more warmth.

Figure 2: Takakkaw Falls rainbow in the misty spray from the waterfall. Rainbows show that light is made of many colours, and we can split light and analyse these colours separately. This is a key technique that has identified the greenhouse effect (stunning image courtesy of Wiki).
Just as a rainbow or oil slick splits up light into different colours we can see, from red to violet, we have tools that split up infrared light to give an infrared spectrum. We can measure the brightness of each infrared colour, and find out an amazing amount about the greenhouse effect and the gases in the atmosphere.
The colour of light from a gas depends on exactly what that gas is, the familiar glow of hot sodium vapour is the dull orange spilled by street lamps.

Figure 3: A lamp, where the orange colour of its glow reveals that the gas inside contains sodium vapour (Wiki).
In the atmosphere, each gas has its own spectrum and some gases like water vapour and CO2 have an infrared glow that makes them important for the greenhouse effect. And this has been measured over and over again using the full spectrum.
According to the greenhouse skeptics this is impossible: there can’t be radiation coming down from the atmosphere and heating us up. They have written blog posts and even made their own magazines to publish articles on this, but have failed to publish in expert-reviewed scientific journals.
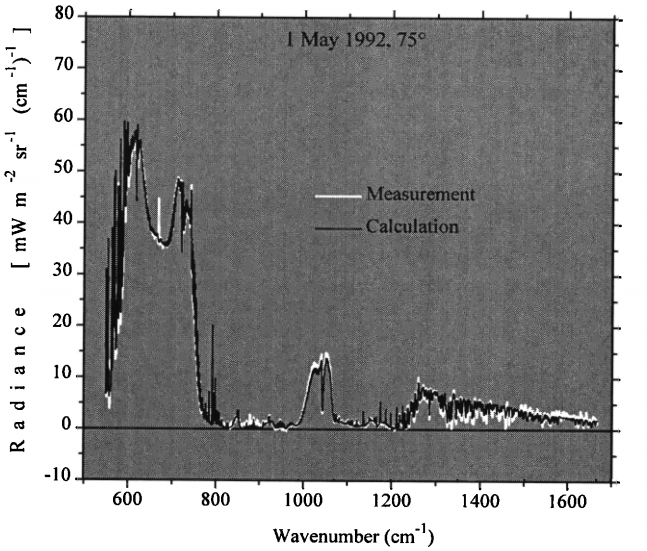
The sort of work that has got into these expert journals includes Tjemkes et al. (2003), where they flew aircraft off the US Eastern Seaboard and near Ascension Island and measured the infrared spectrum in great detail. They then used standard physics, including a computer code developed by the US Department of Defence for guiding heat-seeking missiles.
For almost every bit of the infrared spectrum, the physics predicted the measurement to an accuracy of better than 1%.

Figure 4: One example of comparing a measured spectrum with physics calculations. The bottom axis shows the 'colour' of the light and the side axis shows how bright the light is at that colour. The measurements (white) almost exactly match what is calculated (black). Graph modified from Walden et al. (1998).
Physics works brilliantly, and it works across the entire spectrum for every ‘colour’ of infrared, whether you’re measuring the glow of the sky as it shines down on the Antarctica plateau (Walden et al. (1998)) or using the IASI instrument strapped to a satellite as it flies over Sodankylä in Finland (Calbet et al. (2011)).
For almost every colour of infrared, standard physics makes an almost-perfect prediction. Modern research is filling in the details and won’t change the results by more than a few percent.
Science makes ‘models’ which try to predict how the real world works, and the amazingly precise models we have today have been tested over and over again, and that’s why the greenhouse effect is accepted by scientists worldwide.
Those who deny the greenhouse effect have written reams of blog posts and magazine articles full of bluster. They haven’t produced a model that explains any of these measurements.
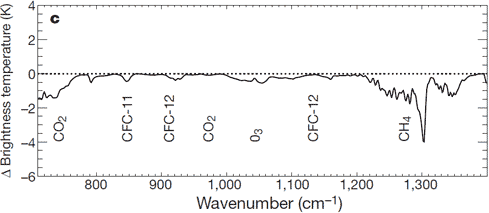
These models are also a key part of how we know that we are heating up Earth. Adding greenhouse gases (like CO2 and methane) traps more heat in the atmosphere (Myhre et al. (1998)). This change has been measured by satellites which split the spectrum (e.g. Harries et al. (2001), Chen et al. (2007), Chapman et al. (2013)). The first of those studies has led to a graph we've often posted on Skeptical Science, showing the change in the amount of infrared light escaping from Earth depending on its colour. Thanks to this, we know that our greenhouse gases are trapping enough heat to be responsible for most of the recent global warming, and that there's a lot more warming to come.

Figure 5: Direct measurement of the man-made greenhouse effect getting stronger, thanks to carbon dioxide (CO2) and methane (CH4). This is the change in how much energy is escaping Earth at different 'colours' from 1970 to 1996. Absorption by carbon dioxide and methane means that the satellites see less at those colours than they did in the past: this extra heat warms the Earth. Image from Harries et al. (2001)
Posted by MarkR on Monday, 3 February, 2014
 |
The Skeptical Science website by Skeptical Science is licensed under a Creative Commons Attribution 3.0 Unported License. |