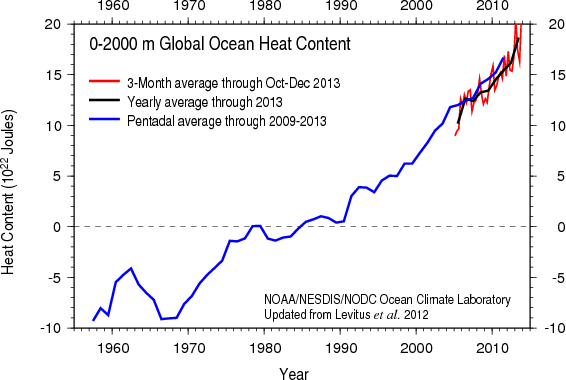

Figure 1: Global ocean heat content 1955-2013. (Source)
In 2013 the Earth’s oceans accumulated energy at a rate of 12 Hiroshima atomic bombs per second, according to global ocean heat content records from the US National Oceanographic Data Center (NODC). This rapid heating in 2013 compares to an average of 4 Hiroshima bombs per second since 1998, and 2 bombs per second since records began in 1955.
This is not the usual way to begin an article about global warming observations, but I have chosen to do so because ocean heat content is objectively the most important piece of evidence. The vast majority of heat from global warming goes into the oceans, so ocean heat content is a more reliable indicator of climate than surface or atmospheric temperature. This data shows global warming has accelerated in the last 15 years, contrary to denialist claims that global warming has “slowed”, “paused”, or “stopped” because the upper ocean, atmosphere, and surface have warmed more slowly in recent years. Warming oceans fuel hurricanes, raise sea level, melt sea ice, devastate coral reefs, and force fish to migrate to cooler waters.
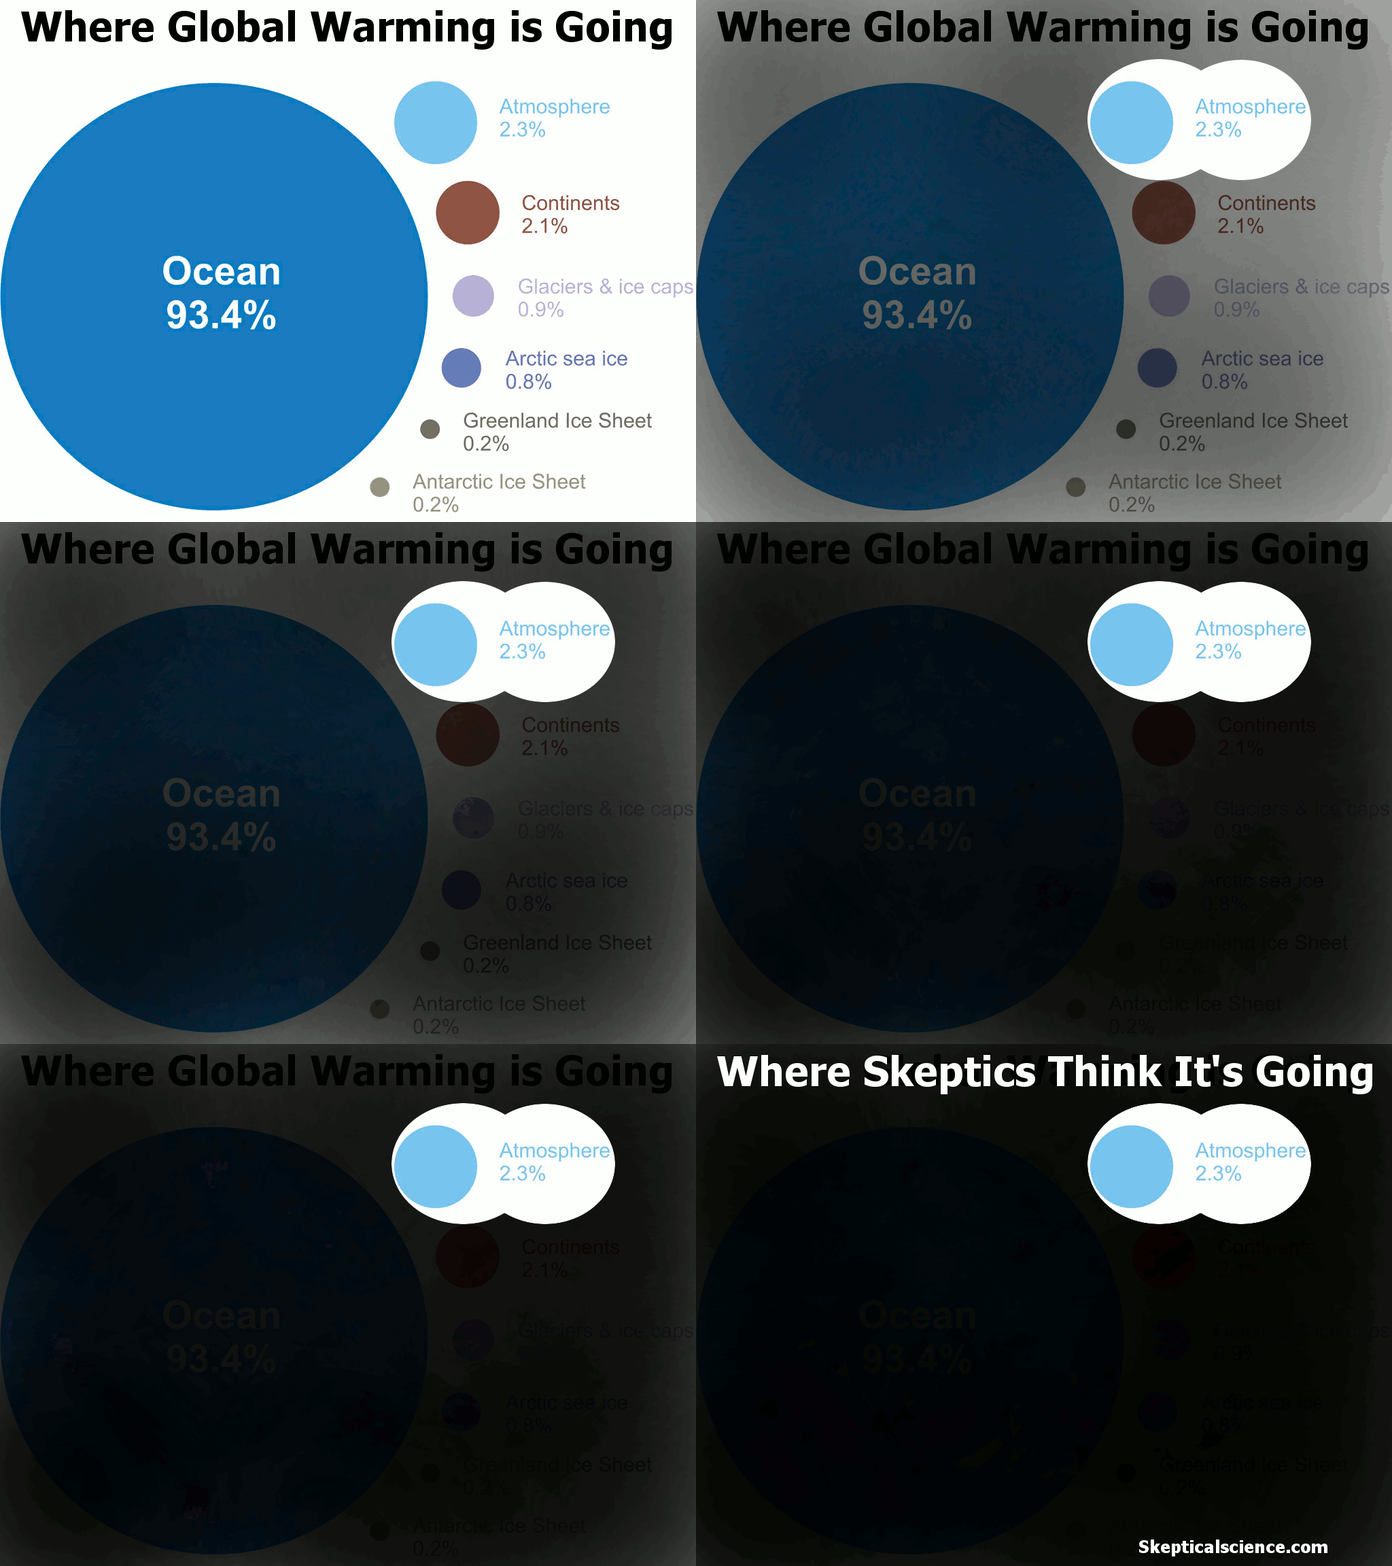
Figure 2: Where global warming is going.
Satellite measurements confirm Earth is gathering heat at the rate indicated by ocean heat content. This can be expected to continue as atmospheric CO2 is currently at 400 ppm and rising (its highest level in at least 13 million years and well above the estimated safe level of 350 ppm).
Some of the heat also goes into melting ice. The disappearance of Arctic sea ice has accelerated dramatically, hitting record low minimum volume in 1999, 2002, 2003, 2004, 2005, 2006, 2007, 2010, 2011, and 2012. At its 2012 minimum, Arctic sea ice volume was a mere 20% of the 1979 minimum volume. In 2013 it was 30% of the 1979 volume, which deniers spun as a “recovery” from 2012, but in reality the trend remains sharply downward. The melt is proceeding much faster than predicted in the models used by the Intergovernmental Panel on Climate Change (IPCC). If the trend is extended forward into the future, the Arctic Ocean in September will soon be entirely liquid.
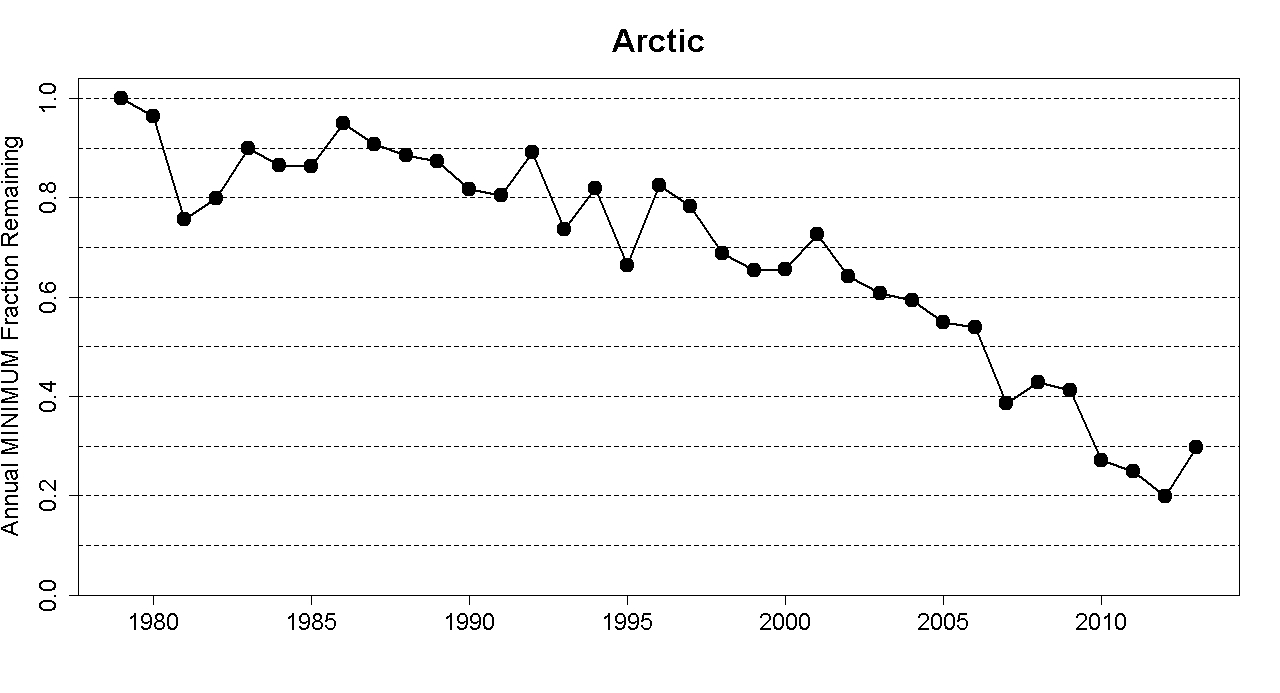
Figure 3: Fraction of 1979 minimum Arctic sea ice volume remaining at each minimum from 1979 to 2013. (Source)
The disappearance of Arctic sea ice is reducing the northern polar region’s surface reflectivity from very high to very low. This is a feedback that amplifies global warming and threatens to set off a chain reaction of tipping points, including large-scale release of carbon from melting permafrost and collapse of the Greenland ice sheet. Already permafrost is starting to thaw and emit carbon, and ice sheet mass loss is accelerating exponentially.
Several studies found climate scientists have systematically underestimated the impacts of global warming. New results are more than 20 times more likely to be worse than predicted than they are to be better. It appears scientists are overcorrecting in response to the deniers’ accusations of alarmism. One study concluded:
If the intention is to offer true balance in reporting, the scientifically credible ‘‘other side’’ is that, if the consensus estimates such as those from the IPCC are wrong, it is because the physical reality is significantly more ominous than has been widely recognized to date.
So contrary to what the denialists claim, there is no “slowdown” in global warming and certainly no “pause” or “cooling”, as the Earth continues to accumulate heat faster than ever. It’s true the rate of surface warming appears to have slowed slightly in the last 15 years. However, 2013 was still the 5th warmest year in the 164-year global temperature record, according to the University of York.
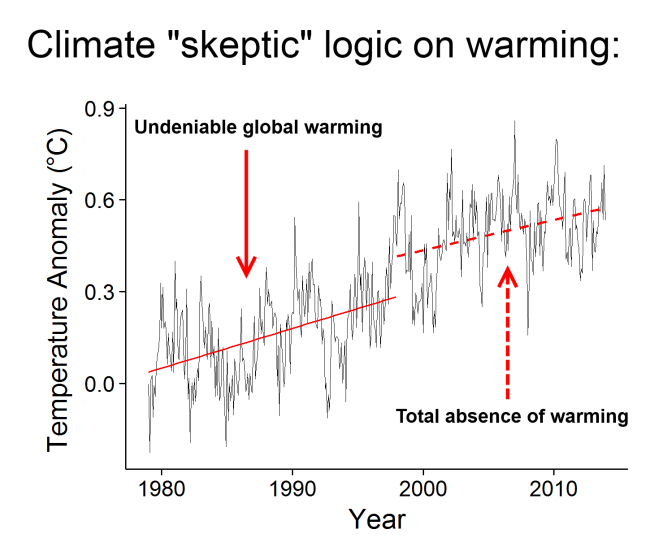
Figure 4: Comparison of global surface temperature trends during 1979-1997 and 1998-2013 in the University of York analysis. (Source)
The global temperature during 2013 was 0.54°C above the 1961-1990 average. (Climatologists usually give temperatures as anomalies relative to an average, because they are easier to compare than absolute temperatures.) 2013 also included the warmest September and November, 4th warmest June, 5th warmest July and December, 6th warmest August, 7th warmest January, 8th warmest April, 9th warmest May, and 10th warmest October. If you remove the seasonal cycle, November 2013 was the 6th warmest of all months.
The four warmest years were 2010 (0.63°C), 2005 (0.59°C), 2007 (0.56°C), and 2009 (0.55°C). Every one of the 13 years so far in the 21st century is one of the 14 warmest (the other year being the oft-cherry-picked outlier 1998). The 2010s to date are warmer than the 2000s, the warmest complete decade on record (followed by the 1990s and 1980s). The last year with an annual temperature cooler than average was 1985.
The University of York dataset is a new analysis (too new to have been included in the recent IPCC report) which interpolates temperatures in regions with few weather stations. In particular it covers the Arctic, which is warming faster than the rest of the planet because of the regional amplifying feedback described above. It is considered more accurate than older analyses which do not use interpolation, and reveals the rate of global warming since 1997 has been twice as fast as previously believed, identical to the trend since 1951 and only a quarter less than the trend since 1980.
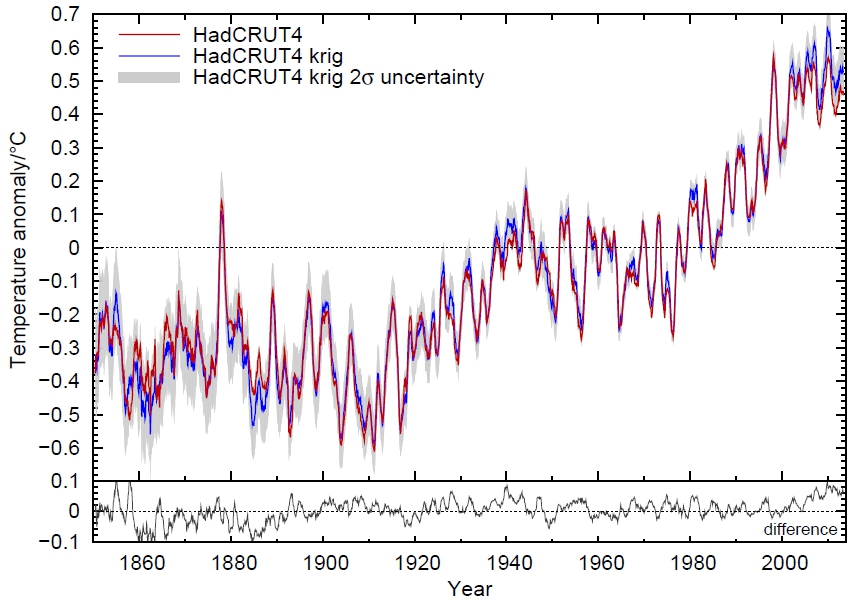
Figure 5: Global surface temperatures 1850-2013. Blue line shows temperatures corrected to cover the entire globe. Red line shows uncorrected temperatures. (Source)
But you don’t have to trust the University of York. In all analyses, 2010 is the warmest year; 2013 is among the warmest (though its precise ranking varies); there is a warming trend since 1998; each of the last three decades has been successively warmest on record; and the Earth has warmed ~0.8°C since the preindustrial era. Even a reanalysis by a team of skeptics confirms the warming trend.
While surface warming may have slowed(a result that looks more significant in datasets excluding the rapid Arctic warming), describing this as a “slowdown” is misleading because its causes are merely temporary.
The main cause of slower atmospheric warming is an ocean circulation cycle called the Interdecadal Pacific Oscillation (IPO). Ocean cycles periodically redistribute heat within the Earth’s climate system (particularly between the ocean and the atmosphere), and are unrelated to long-term climate change caused by heat entering and leaving the system. This sort of internal variability is the reason climate scientists focus on long-term trends instead of short-term ones, and the total amount of heat building up rather than the rate of surface warming.
The IPO controls the relative frequency of phases in the shorter Southern Oscillation, which alternates between El Niño (warm), La Niña (cool), and neutral. In an El Niño phase, the trade winds slow and the surface of the tropical Pacific Ocean is warmer than usual. The anomalous warmth of 1998 was due to a super El Niño. In a La Niña phase, the trade winds accelerate and warm water is pushed to the western Pacific, bringing cold water to the surface behind it. 2011 and 2012 were cooler than the surrounding years because they occurred during a La Niña. The warmth of 2013 occurred in neutral Southern Oscillation conditions, in contrast to most warm years which tend to occur during an El Niño. Years with comparable Southern Oscillation conditions tend to be getting warmer.
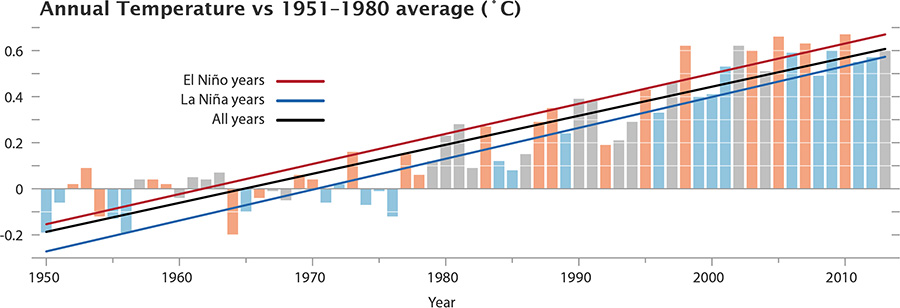
Figure 6: Annual global surface temperatures 1880-2013 from NASA, with El Niño years in red, La Niña in blue, and neutral years in grey. (Source)
Since 2001, the IPO has been in a cool phase (each phase lasts about 20 years) in which trade winds speed up and La Niña prevails. In this way, the IPO is temporarily burying much of the incoming heat from global warming in the depths of the ocean.
The buildup of heat has continued despite natural influences having had a net negative effect on the amount of heat coming in. The most important natural factor in the last decade has been the 11-year solar cycle, which had an unusually extended minimum during 2005-2010. The cumulative effect of reflective particles emitted by small volcanic eruptions may have contributed another cooling influence. These natural factors have temporarily offset part of the warming that otherwise would have occurred due to human-emitted greenhouse gases.
Another possible reason for slower surface warming is particulate air pollution (which, in contrast to greenhouse gas pollution, temporarily cools the Earth by reflecting sunlight). The amount and effect of these particles is poorly measured at present due to a lack of research funding, but emissions from increasing industrial activity in Asia may be cancelling out reductions from developed countries. This represents yet another potential factor helping to temporarily conceal global warming.
The rate of surface warming remains within the range of model projections. Climate models were never designed to predict 15-year trends because the timing of ocean cycles is unpredictable. Instead they ran many simulations with random ocean fluctuations, and some of those simulations indeed predicted periods where atmospheric warming appeared to pause while the deep ocean warmed more rapidly.
Furthermore, new climate models are able to explain the surface temperatures observed in recent years by accounting for the observed ocean and solar cycles. Adjusting the surface temperature record to remove all natural factors (oceans, Sun, and volcanoes) again reveals global warming has continued, and if anything accelerated, since 2000.
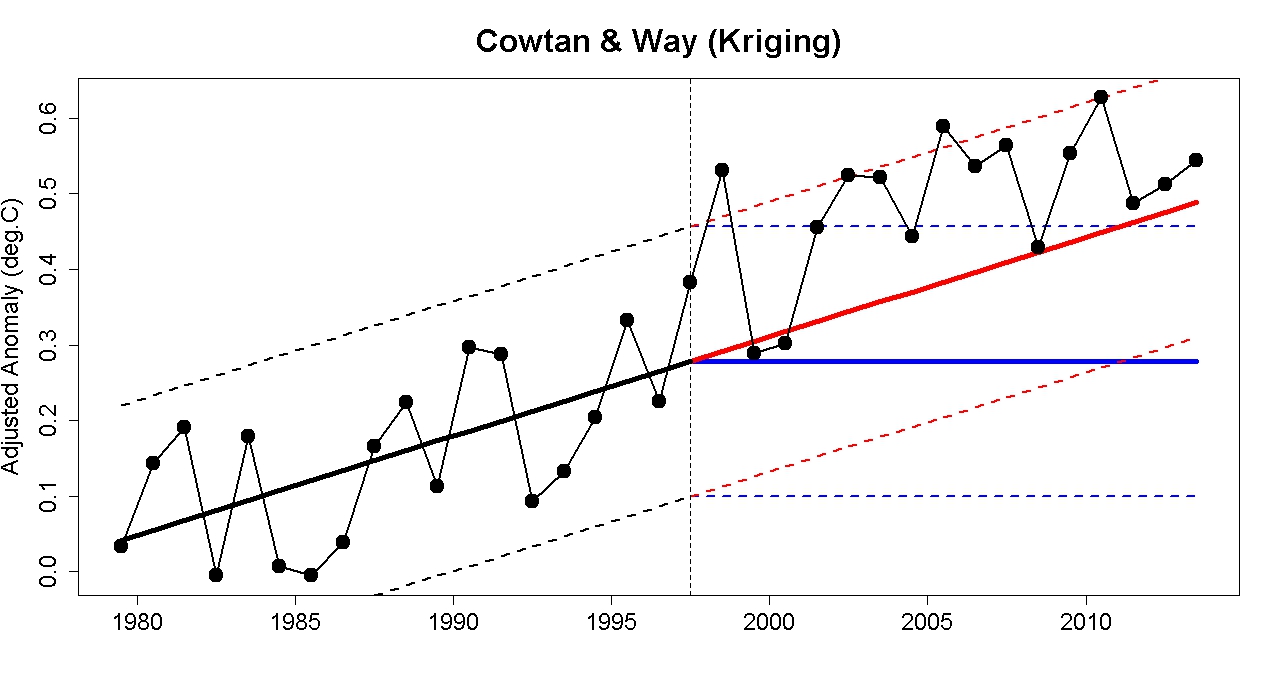
Figure 7: University of York surface temperature record with natural influences removed. Blue line = 1979-2000 trend. Red line = expected temperatures if 1979-2000 trend extended to present (note actual observed temperatures are mostly above this line). (Source)
Most of the world was hotter than average during 2013:
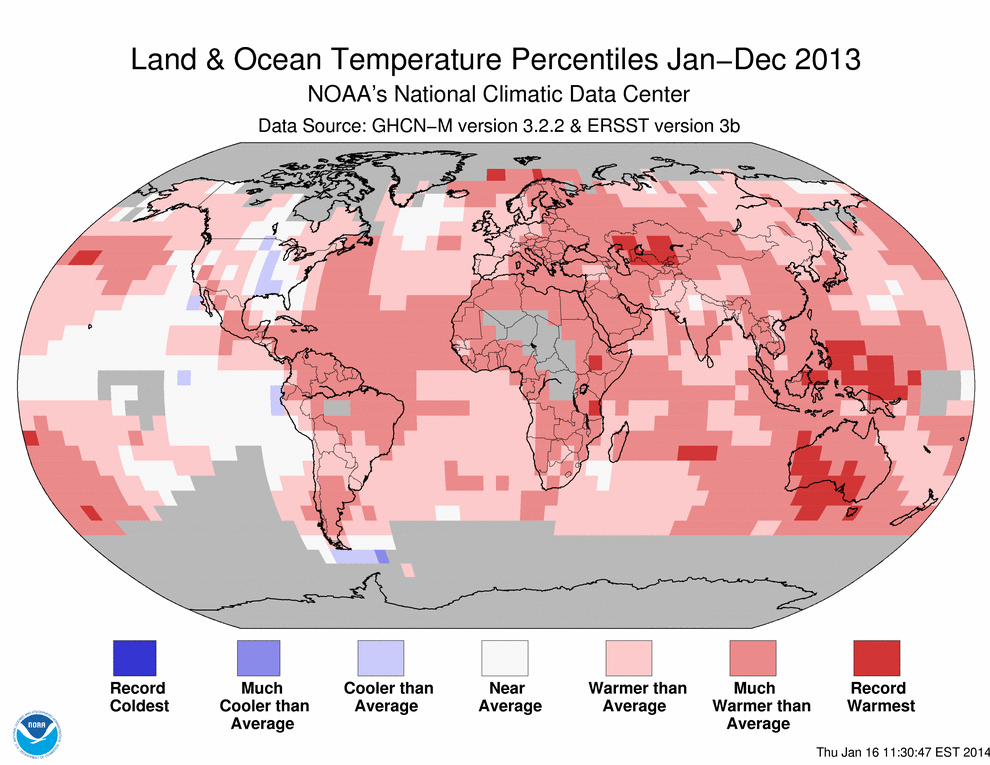
Figure 8: Map of temperature anomalies in each region of the world during 2013. (Source)
The most extreme heat was in Australia, which suffered its hottest year on record (1.20°C above the 1961-1990 average), frequent heatwaves, and warmer than average temperatures throughout the year. Again, the Australian heat occurred despite the neutral Southern Oscillation. Australia broke all of the following records in 2013:
Yet another Australian heatwave began on 27 December, continuing into January 2014 and breaking records in many places. It was soon followed by one of southeast Australia’s most significant heatwaves (13–18 January 2014), killing almost 400 Australians and rivalling the 2009 heatwave that caused the Black Saturday bushfires.
Parts of central Asia, Ethiopia, and Tanzania suffered record heat. Greenland recorded its warmest air temperature (25.9°C on 30 July). In August, China saw one of its worst ever heatwaves, killing over 40 people. Russia experienced its hottest November and December (with Siberia 9°C above average in December). Few parts of the world were cooler than average, and nowhere experienced record cold.
Arctic, Atlantic, Indian, Southern, and western Pacific surface temperatures were all warmer than average. The warm oceans helped fuel an above-average North Pacific typhoon season. Typhoon Haiyan was the strongest tropical cyclone ever to make landfall, killing over 5,700. Although global precipitation was near-average, extreme flooding and drought occurred in many parts of the world.
The most notable cold weather that occurred in 2013 was actually a side effect of global warming. The unusual Arctic warmth led to a record negative phase of the Arctic Oscillation in which cold Arctic air moved south (like a freezer door being left open). This in turn caused a cold northern spring in the US and Europe. This “warm Arctic, cold continents” phenomenon has occurred in several recent years and may be a permanent shift in weather patterns. Unfortunately this means North America, the hub of climate change denial, is experiencing consistently cold winters while the rest of the Earth’s surface cooks.
All the extreme weather we experience today is occurring in the context of a climate system containing much more heat than it did 50 years ago. An increase in average temperature increases extreme hot weather:
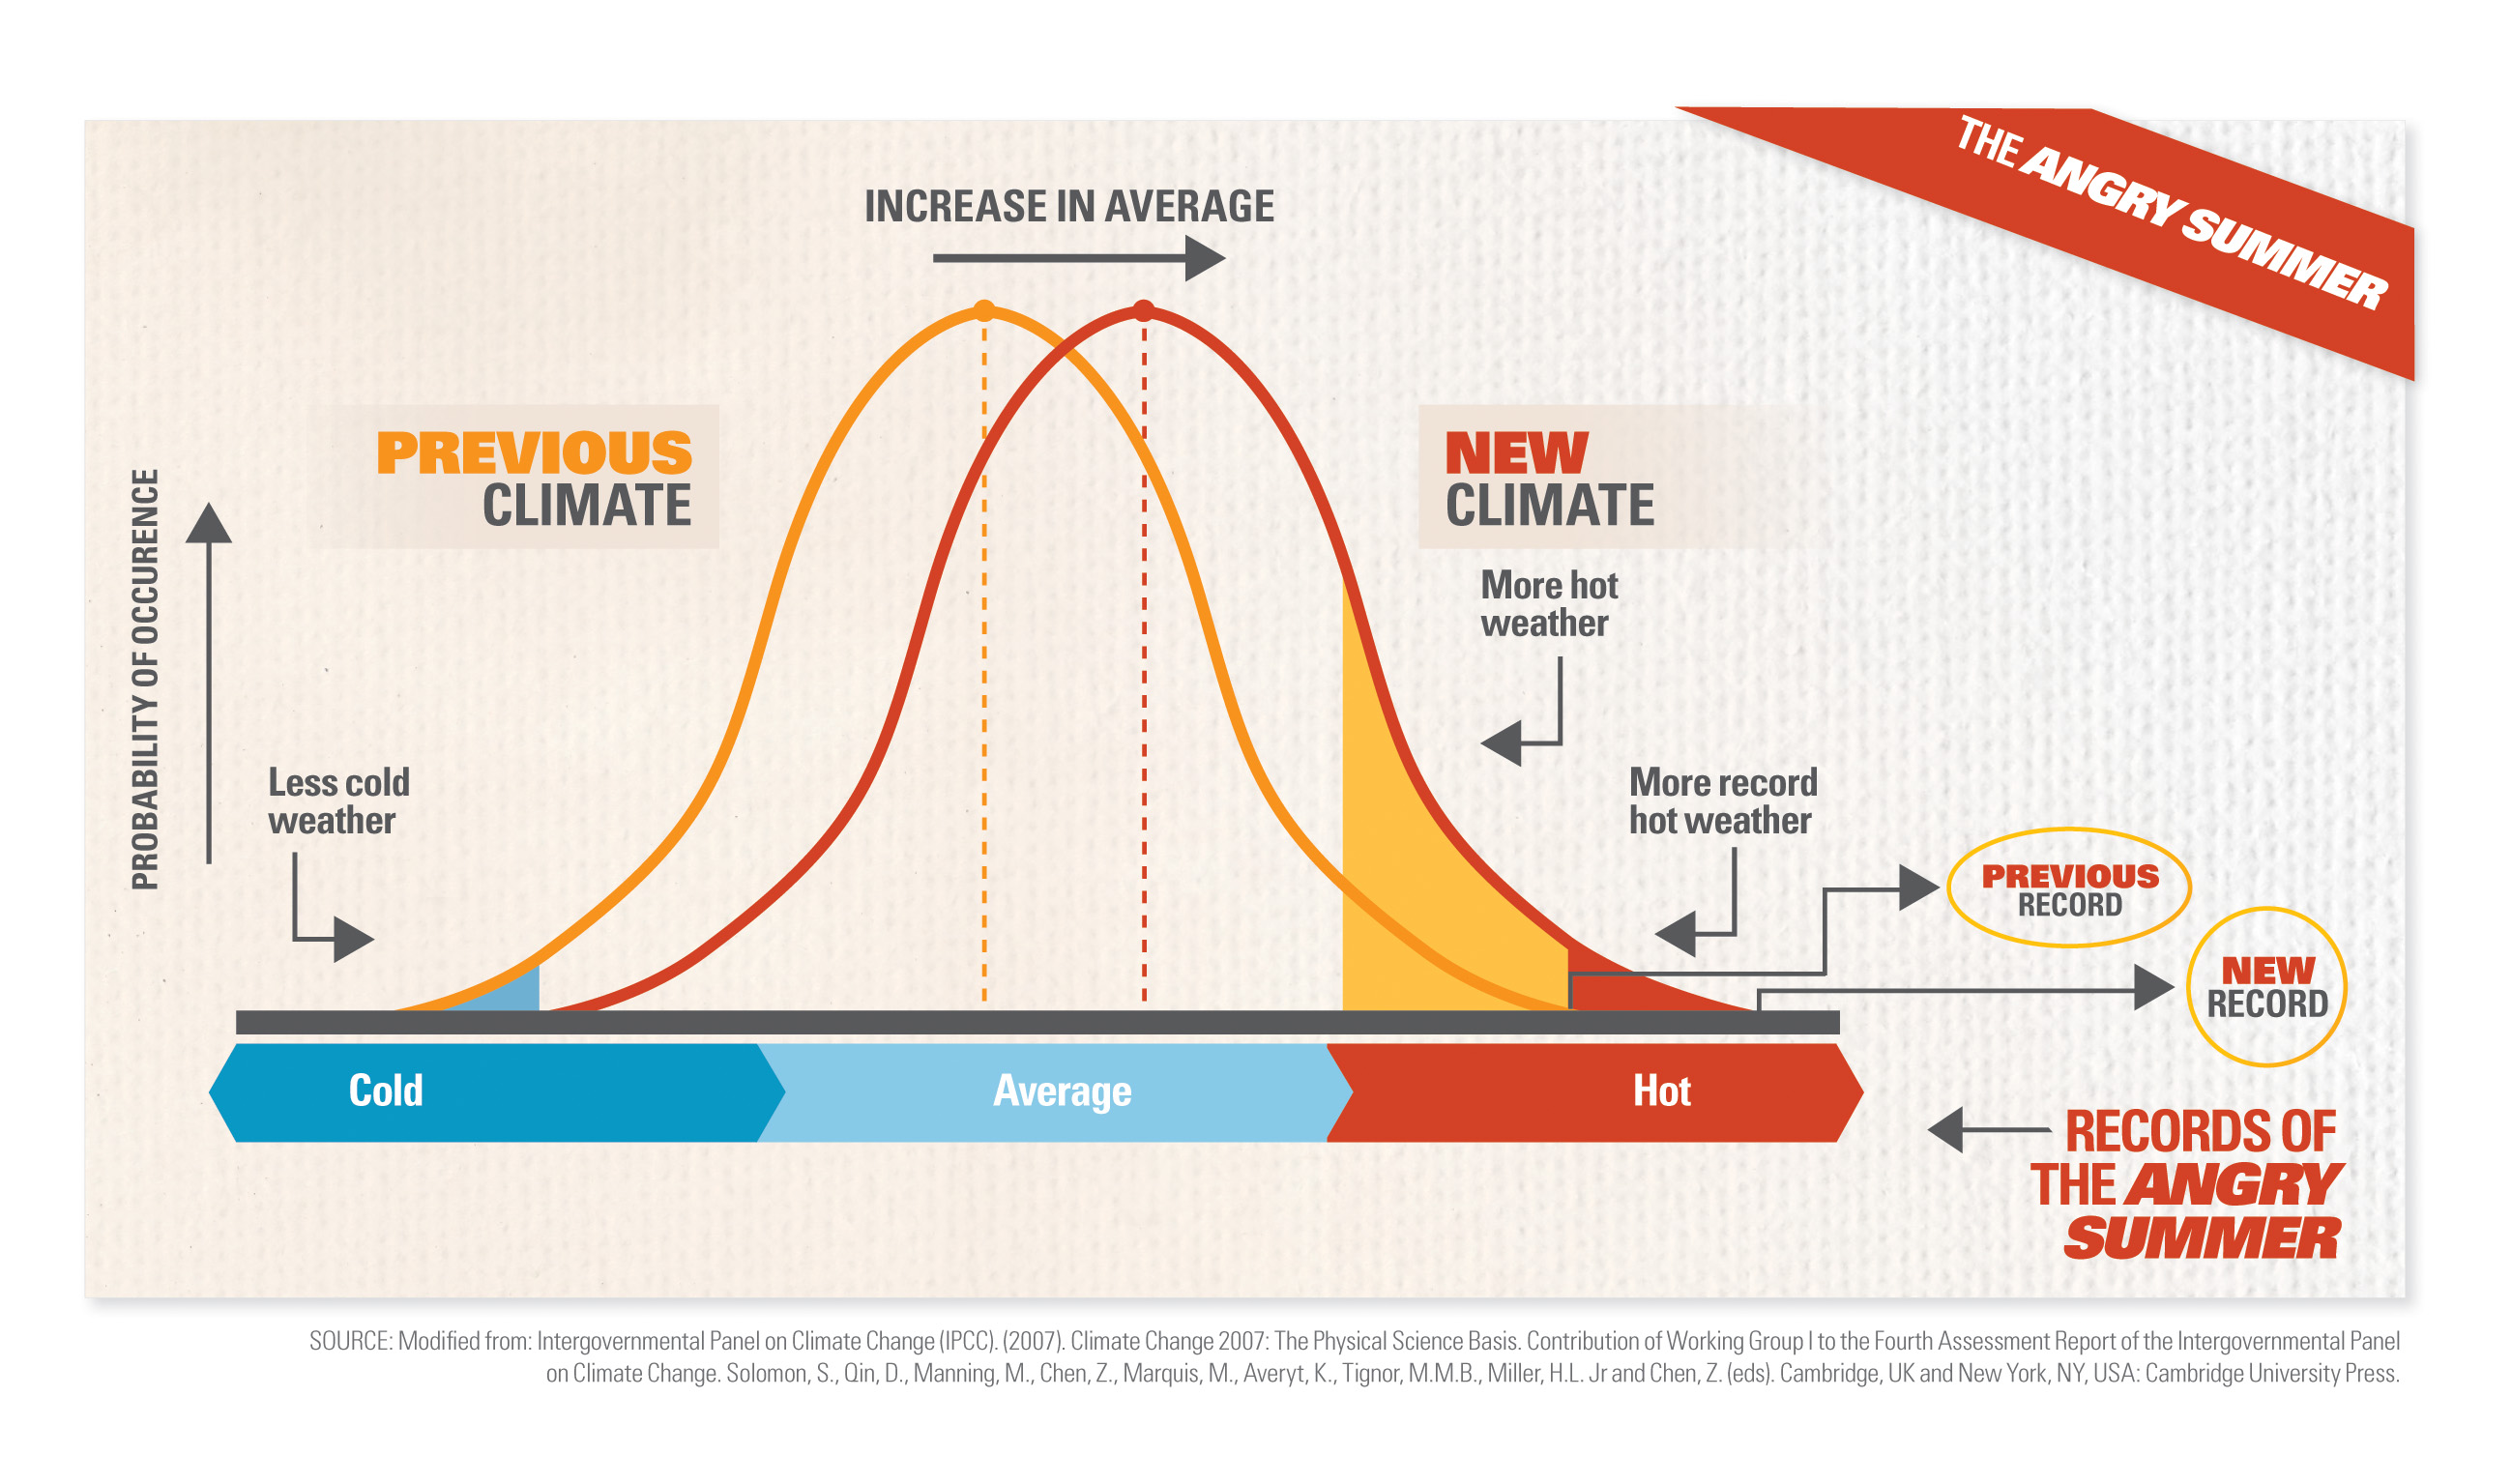 Figure 9: Illustration of how increasing average temperature increases extreme high temperatures. (Source)
Cold weather doesn’t contradict a warming trend, just as an athlete taking steroids will improve their average strength and break more records but still have moments of weakness. Observations confirm the distribution of hot and cold temperatures is shifting as shown in the graph above. For example, heat records in Australia are now happening three times more often than cold ones.
The increase of energy in the climate system also causes the water cycle to intensify: more water evaporating from the ground; more water being held in the air; more water falling as rain. The combination of hotter temperatures and drier soils leads to more frequent and worse bushfires.
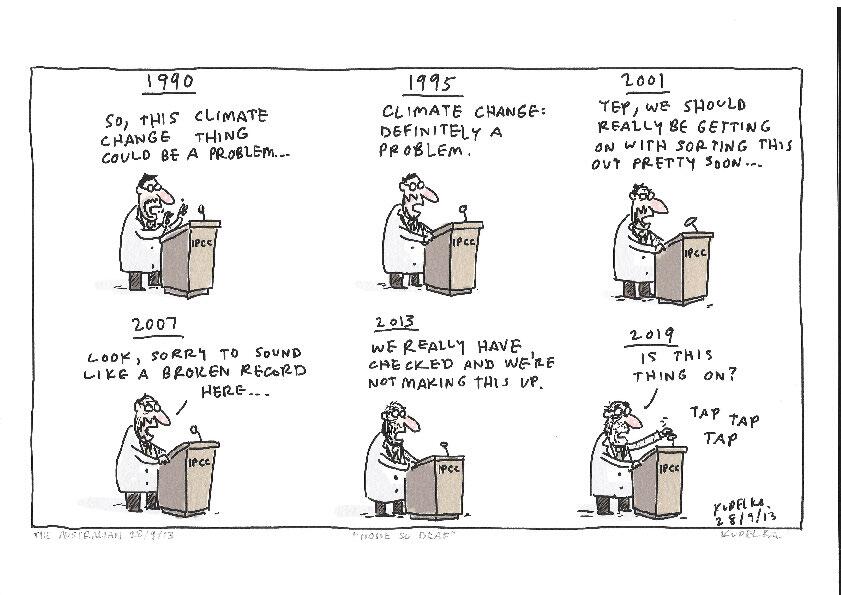
The central conclusion from last year’s IPCC report was that human-caused global warming is more evident than ever, though the report neglected to highlight key evidence suggesting the climate is already reaching dangerous tipping points. Yet as I complained at the time, media coverage of the IPCC report was dominated by the false narrative of the warming “pause” and accusations of an IPCC conspiracy to exaggerate warming. Why did this happen?
Deniers have been claiming since 2006 that global warming has stopped, but until recently the myth was confined to the right-wing echo chamber (already a vast sphere encompassing the News Corp multimedia empire, talkback radio, and much of the business press). Its profile was raised considerably last April, when Reuters began promoting the idea with an article titled “Climate scientists struggle to explain warming slowdown” (I won’t dignify it with a direct link). This is indicative of a broader trend in Reuters’ climate coverage. The reason became clear in July, when Asian climate correspondent David Fogarty quit Reuters and revealed:
From very early in 2012, I was repeatedly told that climate and environment stories were no longer a top priority for Reuters and I was asked to look at other areas. Being stubborn, and passionate about my climate change beat, I largely ignored the directive…
In April last year, Paul Ingrassia (then deputy editor-in-chief [since promoted to managing editor]) and I met and had a chat at a company function. He told me he was a climate change sceptic. Not a rabid sceptic, just someone who wanted to see more evidence mankind was changing the global climate.
Progressively, getting any climate change-themed story published got harder. It was a lottery. Some desk editors happily subbed and pushed the button. Others agonised and asked a million questions. Debate on some story ideas generated endless bureaucracy by editors frightened to take a decision, reflecting a different type of climate within Reuters – the climate of fear.
By mid-October, I was informed that climate change just wasn’t a big story for the present, but that it would be if there was a significant shift in global policy, such as the US introducing an emissions cap-and-trade system.
Very soon after that conversation I was told my climate change role was abolished.
IPCC authors knew the supposed slowdown was a non-issue, but according to coordinating lead author Dennis Hartmann:
it became more and more of a public issue, so we felt we had to say something about it, even though from an observational perspective, it’s not a very reliable measure of long-term warming.
In August, a draft of the report’s Summary for Policymakers was leaked to Reuters, containing a statement that “Models do not generally reproduce the observed reduction in surface warming trend over the last 10-15 years.” This sentence was easy to take out of context to support the denialist narrative of a slowdown scientists can’t explain. The language was moderated for the final report in September (which the IPCC made the mistake of releasing on a Friday), but the damage was done. All the journalists wanted to talk about the supposed pause
(Source)
In summary, the Earth is gaining heat faster than ever before. Arctic sea ice is melting at an astonishingly accelerating rate and could soon be all gone. Most indications of climate change are proving worse than scientists predicted. When you include the fast-changing Arctic, surface warming in the last 15 years has continued at only a slightly slower rate. This apparent “slowdown” in surface warming is temporary and can be explained by a combination of ocean and solar cycles, with a possible contribution from reflective particles emitted by volcanoes and/or Asian industry. Global warming is driving an increase in extreme weather, with almost everywhere warmer than usual during 2013. The idea of a global warming “pause” is a false narrative promoted by ideologically motivated deniers, uncritically propagated by journalists, and unwittingly reinforced by the IPCC.
The apparent slowdown of surface warming is not only giving us a false sense of security; it actually indicates warming will accelerate in the future.
The “slowdown” of surface warming will not continue forever because natural cycles are just that: cycles. Although currently they are counteracting the underlying greenhouse warming trend, sooner or later the cycles will turn around and reinforce it, causing surface warming to catch up to where it would otherwise be. Solar activity is already ramping up again. And when the IPO inevitably shifts back into a warm phase, all the heat now being stored in the deep oceans will be released back into the atmosphere. Even if the cycles somehow get stuck, they will be overwhelmed by rising greenhouse gases as emissions continue (even if solar activity fell to its 17th-century low, the effect would be outweighed by just seven years of greenhouse gas emissions). Natural cycles are now merely waves on the rising tide of greenhouse warming.
Particulate air pollution also cannot continue sustainably because (by definition) it causes other harmful effects. In any case, it remains in the atmosphere for a much shorter timeframe than CO2, and cannot counter its ocean acidification impacts.
Temperatures over the next couple of years will be largely determined by the Southern Oscillation. Short-term models project it will either remain neutral or shift to an El Niño phase by mid-2014. In the latter case, 2014 will probably be warmer than 2013, and 2014 or 2015 is likely to be a record-smashing hot year.
Total cumulative CO2 emissions will be the main factor in the magnitude of long-term global warming. Under the world’s current climate policies we’re headed for >4°C warming by 2100, a temperature unprecedented for the human species and probably beyond our capacity to adapt. If we want global warming to truly pause, we must hit the pause button. We need to leave the vast majority of the Earth’s fossil fuel reserves in the ground, even just to have a good chance of limiting global warming to the unsafe level of <2°C. To have any hope of stabilizing the climate, we urgently need to phase out global greenhouse gas emissions as quickly as possible. Most importantly, we must phase out the largest and longest-lived cause of global warming, fossil fuel CO2 emissions.
There is no time to lose. Rapid global surface warming will be back – faster than ever before.
This post was originally published at Precarious Climate.
Posted by James Wight on Wednesday, 12 March, 2014
 |
The Skeptical Science website by Skeptical Science is licensed under a Creative Commons Attribution 3.0 Unported License. |