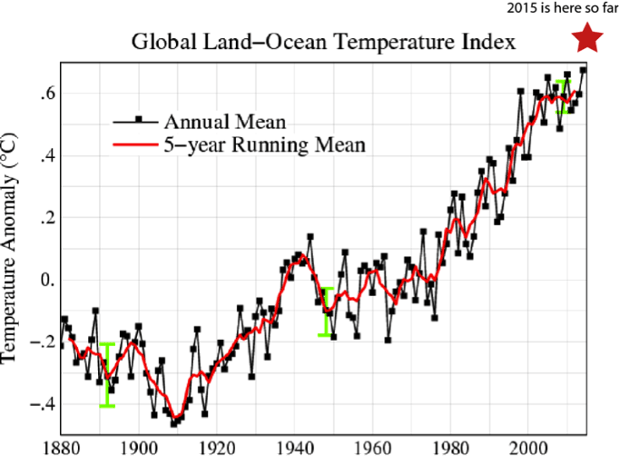
Just today, NASA released its global temperature data for the month of May 2015. It was a scorching 0.71°C (1.3°F) above the long-term average. It is also the hottest first five months of any year ever recorded. As we look at climate patterns over the next year or so, it is likely that this year will set a new all-time record. In fact, as of now, 2015 is a whopping 0.1°C (0.17°F) hotter than last year, which itself was the hottest year on record.
Below, NASA’s annual temperatures are shown. Each year’s results are shown as black dots. Some years are warmer, some are cooler and we never want to put too much emphasis on any single year’s temperature. I have added a star to show where 2015 is so far this year, simply off the chart. The last 12 months are at record levels as well. So far June has been very hot as well, likely to end up warmer than May.

Global surface temperature estimates from NASA GISS.
So why talk about month temperatures or even annual temperatures? Isn’t climate about long-term trends?
First, there has been a lot of discussion of the so-called ‘pause.’ As I have pointed out many times here and in my own research, there has been no pause at all. We know this first by looking at the rate of energy gain within the oceans. But other recent publications, like ones I’ve written about have taken account of instrument and measurement quality and they too find no pause.
Second, there has been a lot of discussion of why models were running hotter than surface air temperatures. There was a real divergence for a while with most models suggesting more warming. Well with 2014 and 2015, we see that the models and actual surface temperatures are in very close agreement.
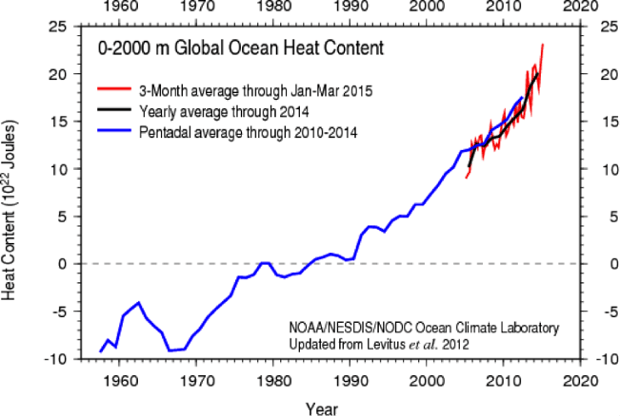
When we combine surface temperatures with ocean heat content, as seen below, a clear picture emerges. Warming is continuing at a rapid rate.

Global ocean heat content estimates from NOAA.
There is an emerging view that the so-called surface warming slowdown was caused from poor instrument coverage around the globe, volcanic eruptions, and a multi-year oscillation in the oceans. The issue of instrument coverage is being fixed as we speak.
But, any short term fluctuations can only temporarily influence the long term trend. In the ocean heat content image above, you might notice a slight change in the trend around 2005. The trend change has since disappeared; it was associated with the ocean oscillations I mentioned earlier.
The recent warming skyrocket has put the contrarians in a bad position. In 2013, when contrarian Christopher Monckton repeated a claim that temperatures might decrease by 0.5°C in two years, I challenged him to a $1000 bet. He never took that bet, but we can see he would have lost handily if he had.
More recently, contrarian Judith Curry was reported as warning about decades of cooling (or perhaps lack of warming) stretching out to the 2030s. We see that this prediction is not looking very likely. Other contrarians have made similar predictions and it makes one wonder how much evidence will have to pile up before they climb down.
Just a few months ago, Roy Spencer (another climate contrarian) claimed, “We are probably past the point of reaching a new peak temperature anomaly from the current El Niño, suggesting it was rather weak.” While it remains to be seen whether or not he is correct, his own data have shown an uptick in temperatures, and the most recent months have continued the very warm trend. Barring something really unusual, the trend will continue until the end of this year.
I asked climate expert Dr. Joe Romm, Founding Editor of Climate Progress for his thoughts. He reminds us,
Posted by John Abraham on Monday, 15 June, 2015
 |
The Skeptical Science website by Skeptical Science is licensed under a Creative Commons Attribution 3.0 Unported License. |