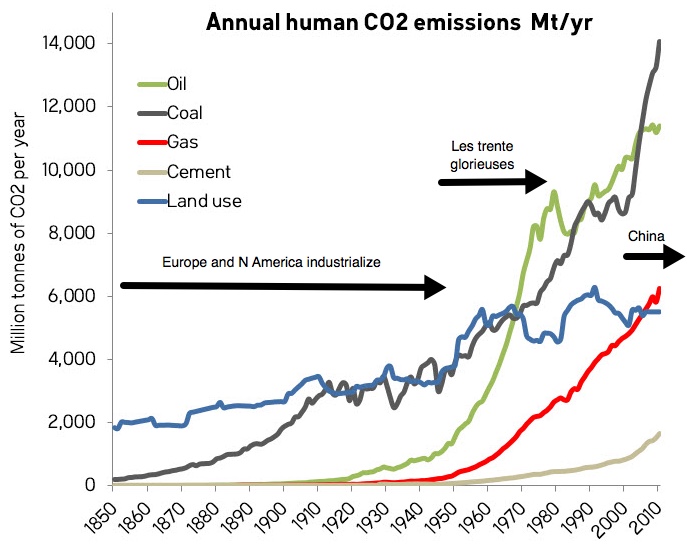
Source of the emissions data is from the CDIAC. See the SkS post The History of Emissions and the Great Acceleration for further details.
In the first part of this series, I examined the implications of relying on CCS and BECCS to get us to the two degree target. In the second part, I took a detailed look at Kevin Anderson's arguments that IPCC mitigation scenarios aimed at two degrees are biased towards unproven negative-emissions technologies and that they consequently downplay the revolutionary changes to our energy systems and economy that we must make very soon. In this last part, I'm going to look at the challenges that the world faces in fairly allocating future emissions from our remaining carbon budget and raising the money needed for climate adaptation funds, taking account of the very unequal past and present.
Until now, economic growth has been driven and sustained largely by fossil fuels. Europe and North America started early with industrialization and, from 1800 up to around 1945, this growth was driven mainly by coal. After the Second World War there was a period of rapid (~4% per year) economic growth in Europe, N America and Japan, lasting about thirty years, that the French refer to as Les Trente Glorieuses, The Glorious Thirty. This expansion was accompanied by a huge rise in the consumption of oil, coal and natural gas. After this there was a thirty-year period of slower growth (~2%) in the developed economies, with consumption fluctuations caused by oil-price shocks and the collapse of the Soviet Union. During this time, oil and coal consumption continued to grow, but not as steadily as before. Then, at the end of the twentieth century, economic growth took off in China, with a huge increase in the consumption of coal.
Source of the emissions data is from the CDIAC. See the SkS post The History of Emissions and the Great Acceleration for further details.
If we are to achieve a stable climate, we will need to reverse this growth in emissions over a much shorter time period, while maintaining the economies of the developed world and, crucially, allowing the possibility of economic growth for the majority of humanity that has not yet experienced the benefits of a developed-country middle-class lifestyle.
Here are the the annual emissions sorted by country and region:
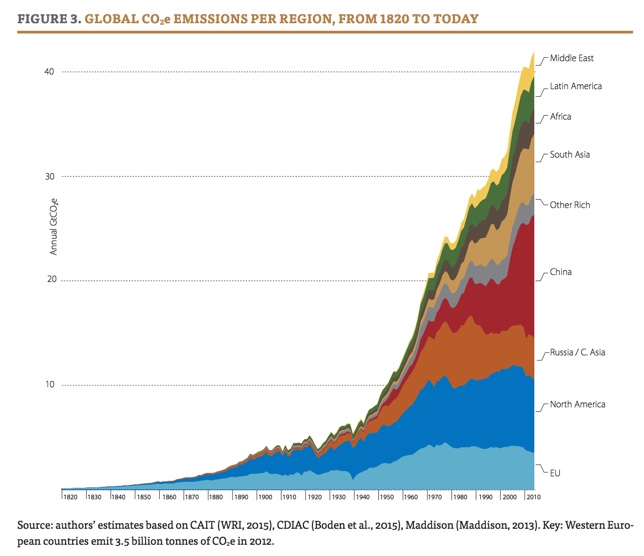 From Chancel and Piketty (2015)
This shows how the European Union (and its precursor nations), North America and the Soviet Bloc/Russia dominated emissions up to 1970, when they started to stabilize. After that, other world regions increased their consumption of fossil fuels. Around 2000, China's emissions shot up as their economy grew rapidly.
It is cumulative rather than annual emissions that matter for climate change. Below is a chart showing how much the economic regions of the world contributed as a proportion of total cumulative emissions.
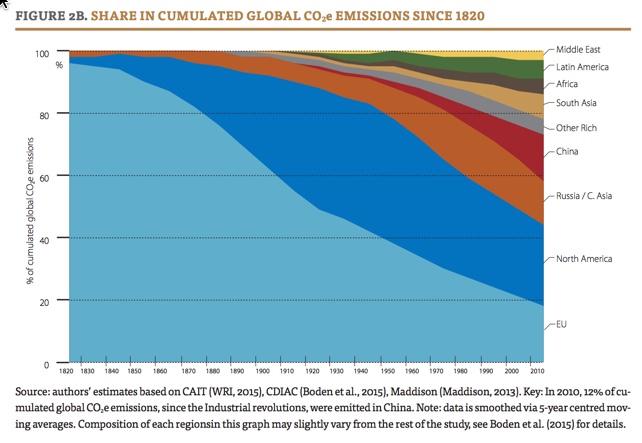 From Chancel and Piketty (2015)
In 2015, the EU, North America and the former Soviet Union were still responsible for 60% of cumulative emissions. Put another way, even today, nations comprised of people of mostly European origin in the Northern Hemisphere are responsible for more than half of the global warming problem, but their relative share is falling fast as the rest of the world catches up.
How do the current emissions look on a per-person basis?
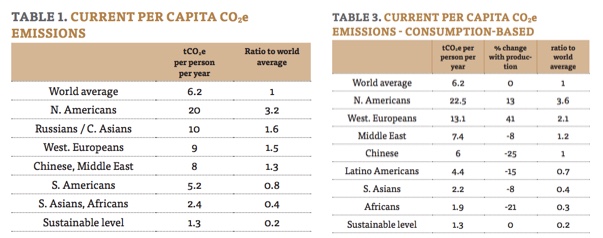 From Chancel and Piketty (2015) The left-hand graph shows the per-capita emissions in the way they are conventionally calculated and the right-hand graph shows the emissions corrected to account for the emissions used to make imported goods.
Even though the Western Europeans, North Americans and ex-Soviet Bloc as regions are now emitting less than the rest of the world, when measured on a per-capita basis, these regions are still emitting more than their fair share. This is especially true for the North Americans, who emit more than three times the world average. Once you account for the fact that N America and Europe outsource some of their consumption to factories in Asia and Latin America, the imbalance becomes even worse, as the right-hand table above shows. The Chinese, once you account for their exports, are actually average per-capita emitters of CO2.
Given the past and present emissions and the need to reduce emissions drastically over the next few decades, how could we share the burden of that reduction in any kind of fair way?
Glen Peters et al. (2015) published a recent paper, Measuring a fair and ambitious climate agreement using cumulative emissions, in which they lay out how quickly the USA, the EU and China will have to reduce their emissions to meet the 2 degree target. They adopted a framing used in a 2014 paper by Michael Raupach and others (paywalled), that showed how the remaining carbon pie can be divided up two ways:
a) Inertia, the remaining pie is distributed according to how fast individual countries are currently consuming it;
b) Equity, allocating equal shares for all, based on estimates of future population when there will be 9 billion people.
The two divisions, plus a middling one, look like this:
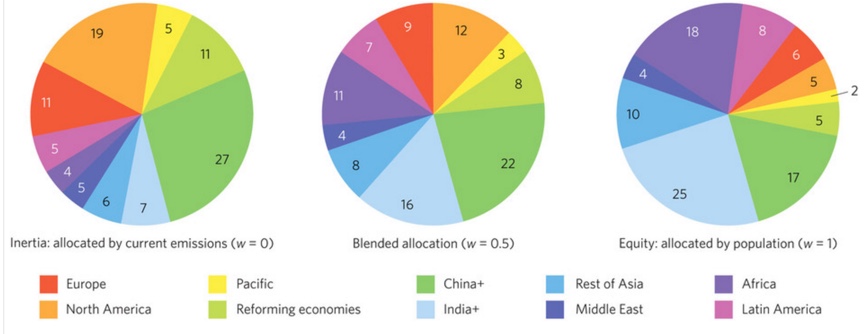
North America's share based on "inertia" is 19% of the remaining budget, whereas under "equity" it falls to 5%. On the other hand, India's share goes from 7% to 25%. Granting some degree of equity gives developing nations more room to grow through increased emissions, while it places more stringent constraints on developed nations.
Here's how Peters et al. (2015) model the mitigation pathways for the big three under inertia and equity constraints:
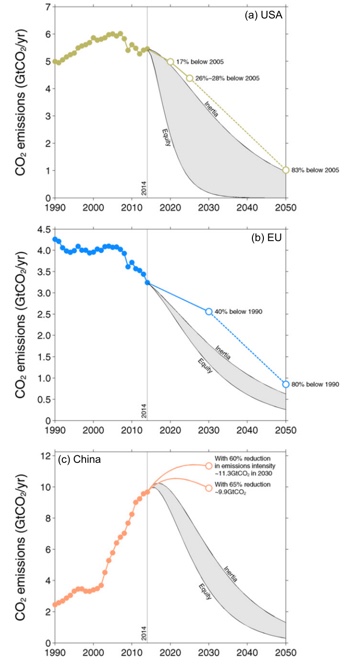
From Peters et al. (2014), note that "EU" includes some Eastern European countries classified under "reforming economies" in the previous Raupach et al. pie-charts. The light coloured lines and open dots represent recently-made mitigation pledges (INDCs).
The USA has to accelerate its reductions in emissions even to stay on track with the inertia trajectory. To get anywhere near its equity allocation would entail an unrealistic decarbonization of the economy over twenty years. The EU can continue along a projection of its recent progress but, judging by its own pledges, it will significantly overshoot even the inertia pathway in 2030. China would have to peak its emissions immediately and decline much faster than its pledges predict.
Let's see how the pledges of the big three stack up against global mitigation curves calculated for 66% chances of staying below 2 and 3 degree C targets:
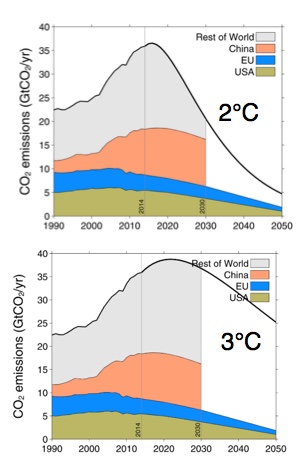 From Peters et al (2015) (top) and their supplemental material (bottom); the 2 and 3 degree C labels have been added for clarity.
Even a casual inspection of the curves shows that the Paris pledges from the big three will provide no room for future emissions for all of the other countries in the 2 degree case. If we are to give the world a chance to stay under 2 degrees, we will have to do much better than we have so far promised. To do so with any semblance of fairness towards developing countries will require the rich and middle-income nations to do much, much better.
Here's a video from Climate Interactive that lays out what all of the Paris emissions pledges add up to and what more needs to be done to get to the 2 degree target.
I summarized all of the steps needed to to go from Paris to two degrees in my post The chance of staying below two degrees: INDCs and the Seven Ifs. I also did a cocktail-napkin estimate of the probability of us getting from Paris to two degrees.
From the standpoint of some developing countries, even the "equity" scenario is inequitable, since it is based on calculated fair shares of the pie going forward. It does not consider the fact that the old fat-cat economies have already consumed a big share of the pie already. How much this would affect things depends on when you start measuring the start of the pie-eating from. From the Supplemental information of Raupach et al. (2014):
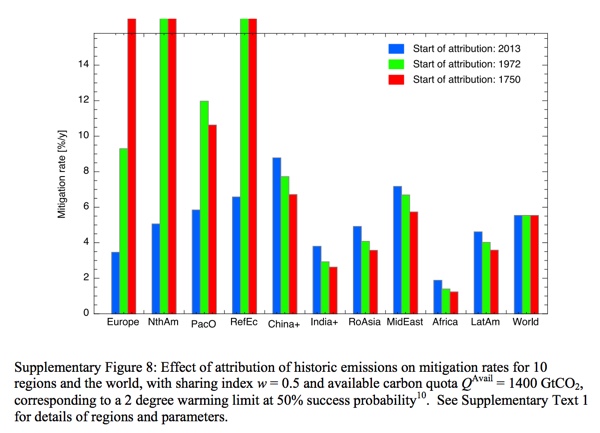
Generally speaking, economists consider that a 4% mitigation rate is the maximum rate at which a nation can decarbonize without serious harm to its economy. Setting attribution dates earlier than 2013 would saddle those countries that have been rich for longer with mitigation burdens that they would not be able to meet.
If the world is to meet the two-degree target, it cannot do so in ways that allocate carbon emissions targets with complete fairness. Compensation and assistance from the rich countries will be required. Deciding how much this amount will be and figuring out who pays it is likely to be at the very crux of the Paris talks and beyond. Economist Jeffrey Sachs comments that the world is not yet responding quickly enough on the funding front.
So far, I have looked only at the wealth and emissions between countries. Once we also look at the equity within countries, the picture becomes more complex.
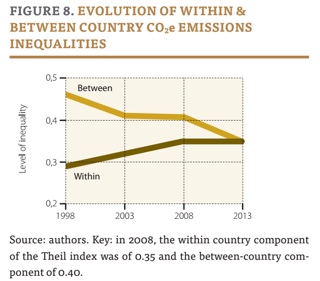 When the Kyoto Protocol was signed in 1997, developed countries took on a bigger mitigation burden than developing countries. At that time, it was relatively easy to distinguish between rich and poor. With the rise of China, the situation has changed: a large part of humanity now lives in a middle-income country with rich-country emissions.
In addition, inequality within countries has increased as the benefits of rapid development have not yet spread to all corners of China and, in rich countries, the plutocrat class has continued to be enriched, while the middle and lower classes tread economic water. During the Great Recession of 2008-2009 the wealth of the very richest in the rich countries generally recovered quickly, whereas the middle classes tended to be hit harder and their wages and wealth has stayed flat.
As the graph from Chancel and Piketty shows, inequality between nations has now decreased to meet rising inequality within nations.
Dividing up rich and poor is no longer as simple as putting rich nations in one box and poor nations in another.
The graph below, also from Chancel and Piketty, shows how emissions are distributed among the rich 10%, the middle 40% and the poor 50%. (In case you were wondering, to get into the global 10% requires an individual annual income in N America of about $16,000. If you are a single, rich-country professional, with an income of $80,000 or more, you are likely a global emissions one-percenter. See the right-hand column in their Table 10.) The mean emissions of the N American members of the global 10% are 32 tonnes of carbon per person per year, for the 1%, the figure is 86 tonnes.
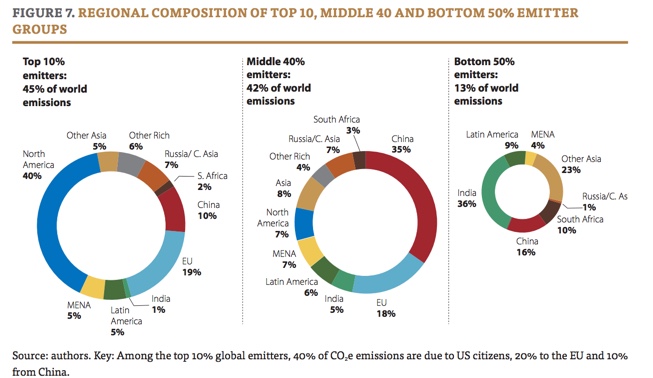
The top 10%, although they would not all necessarily be considered well-off by most people in rich countries, are responsible for nearly half of the world's emissions. The largest proportion of these people lives in N America, but there are significant populations in Europe and China, and about one-third of these high polluters are scattered elsewhere around the world.
The middle 40%, who emit at world average amounts per person, is dominated by China, but there is substantial representation in this group by all regions, including the EU and N America. Although these people are richer than the global average, they include the poorest people in the developed countries. They all aspire to join the 10%. God help us if they achieve this by burning the same amount of fossil fuels per head as the 10% currently do.
The poorest half of the world, dominated by Asians and Africans, produce far less than average per-person emissions. Of course, they all want nothing more than to be members of the global middle class. (By the way, "South Africa" in the diagrams really means "Sub-Saharan Africa".)
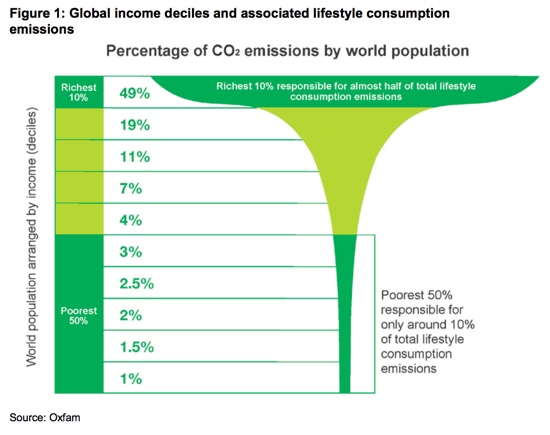
Oxfam has illustrated the same grossly unequal emissions distribution with a graph that looks, appropriately enough, like a Champagne coupe.
Estimates range widely of how much money needs to be transferred from rich to poor to finance climate change adaptation and development of clean energy sources. At the UNFCCC talks, negotiators are looking at a number around $100 billion per year by 2020. Chancel and Piketty favour a €150 billion ($163 billion) amount, but they report that estimates vary from $65 to $325 billion. (In comparison, the Marshall Plan that helped Europe rebuild after World War Two cost about $32 billion per year over four years in today's money.) The question is: where to collect this money from? In any equitable system, the money should not just come from rich countries, but from the high emitters, wherever they live.
Chancel and Piketty look at four different carbon tax strategies and favour a progressive one that collects money from the 10%. This would entail N Americans paying 46% of the adaptation fund, the EU 16% and the Chinese 12%, with the rest of the world making up the remaining 26%. They admit, though, that setting up such a system would be administratively and politically extremely difficult.
They do have a simpler suggestion for how to allocate contributions.
Chancel and Picketty propose instead that air travellers pay a fee per flight taken. At a level of an average $57 per ticket, this would raise $163 billion per year. Roughly speaking, the number of flights a person takes is a proxy for their overall carbon emissions. The 1% fly a lot more, for both business and pleasure. The 90% hardly fly at all. This fee would be far in excess of simply paying for the carbon emissions of the flight. In very few cases is flying a basic human need. Currently, most aviation fuel is tax-free, so adding a fee to each ticket would right that rather regressive anomaly.
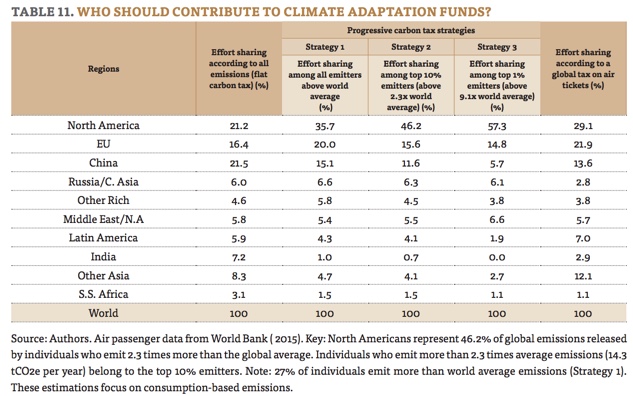
The effort-sharing of a flight-ticket tax (rightmost column above) would not be quite as progressive as carbon-taxing the high emitters, but it might be easier to administer. It would likely be very unpopular among voters in rich countries and the airlines would certainly hate it. It would probably suffer a US veto, as did an earlier European attempt to introduce an airline carbon tax.
It seems that raising the $100 billion will require the richer countries to transfer funds from their general revenues, as some countries are pledging to do in Paris. As with other promises of foreign aid, it is all too easy for countries to renege on such pledges and spend instead on domestic priorities. There will also be a temptation for countries to see these transfers as part of existing foreign-aid budgets, leaving little additional allocation for climate funding.
To sum up:
Had the world got its act together twenty years ago it could have adopted climate policies that were effective, feasible and fair. Of those three characteristics of good policy, at best, we now only get to pick two.
Chancel, Lucas and Piketty, Thomas (2015) Trends in the global inequality of carbon emissions (1998-2013) & prospects for an equitable adaptation fund. Paris School of Economics. PDF
Peters, G. P., Andrew, R. M., Solomon, S., & Friedlingstein, P. (2015). Measuring a fair and ambitious climate agreement using cumulative emissions. Environmental Research Letters, 10(10), 105004. PDF
Raupach, M. R., Davis, S. J., Peters, G. P., Andrew, R. M., Canadell, J. G., Ciais, P., ... & Le Quéré, C. (2014). Sharing a quota on cumulative carbon emissions. Nature Climate Change, 4(10), 873-879.
Thanks to George Morrison, Howard Lee and David Kirtley for their helpful comments.
Posted by Andy Skuce on Wednesday, 9 December, 2015
 |
The Skeptical Science website by Skeptical Science is licensed under a Creative Commons Attribution 3.0 Unported License. |