The oceans are by far the largest heat reservoir in the Earth's climate system, so much so that they make up a whopping 93% of global warming. Thus global warming is really the story of ocean warming. In many blog posts in recent years (see, here, here and here for example) Skeptical Science has consistently drawn attention to the fact that the oceans are continuing to accumulate heat and therefore, despite short-term fluctuations in both surface and atmospheric temperatures, global warming is proceeding largely as anticipated by the scientific community.
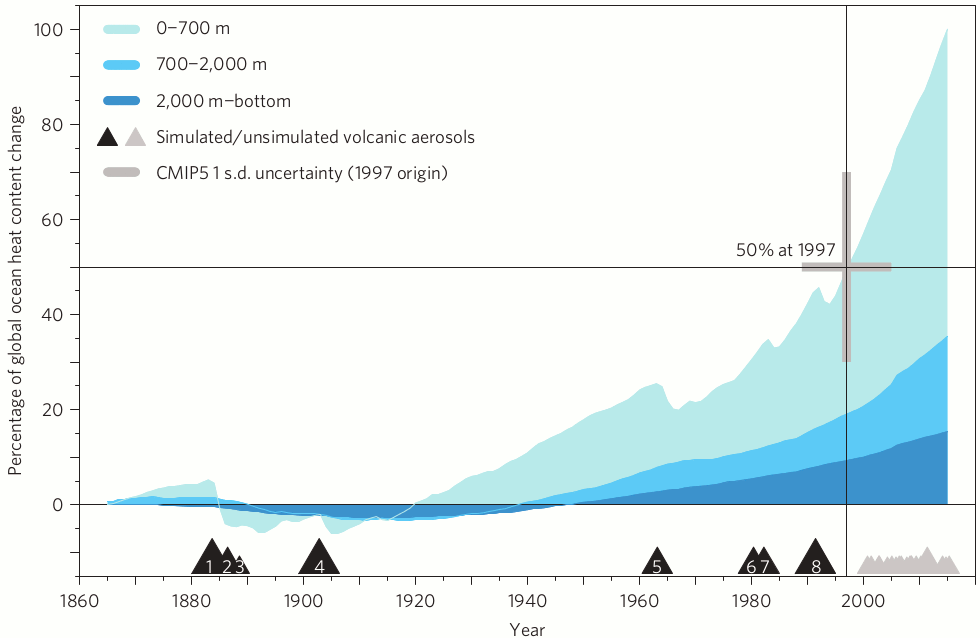
A recent paper, Gleckler et al [2016], manages to put the recent warming of the ocean into a broader, longer-term, perspective. Using ocean temperature measurements obtained from various sources and methods, and utilizing data from the pioneering HMS Challenger expeditions of the late 19th century (Roemmich et al [2012]), the researchers were able to compare the observations stretching back to the mid-1800's with climate model simulations. They found the model simulations were consistent with this diverse collection of ocean temperature data. Perhaps the most startling result of this analysis is just how much the oceans have warmed in recent decades, with the recent acceleration so pronounced that the rate of ocean heat uptake in the industrial-era has doubled since 1997.

Figure 1 - The CMIP5 multi-model mean ocean heat content change from 1865 to 2015 expressed as a percentage for 3 ocean depth layers. The gray bars indicate the 1-standard deviation uncertainty and the black triangles along the bottom denote simulated large volcanic eruptions (which disperse light-scattering sulfate particles). Gray triangles show the many unsimulated small & moderate volcanic eruptions after 2000. Image from Gleckler et al (2016).
How additional greenhouse gases in the atmosphere cause the ocean to grow warmer is not generally well-known, so it's useful to provide some background context for this new research paper. In a similar vein to the warming of the atmosphere, the warming of the oceans occurs in response to the slowing of heat loss. It works like this: highly energetic solar (shortwave) radiation enters the surface layers and warms the ocean. The overlying air is typically cooler than the sea surface, so some ocean heat is lost to the atmosphere and any surplus is eventually radiated away to space high up in the atmosphere. The amount of heat in the ocean is therefore a balance between solar radiation entering the ocean and the energy which leaves it - mainly through evaporation. The oceans can warm through an increase in solar output (the sun has actually cooled in recent decades, thereby eliminating that as a potential cause) or by reducing the rate of heat loss to the atmosphere. This is where additional atmospheric greenhouse gases come in.
The heat lost at the ocean-atmosphere interface results in a less than millimeter-thin layer of ocean surface being colder than the water layers immediately beneath. This is known as the cool-skin layer. In the water just below, heat is moved about through turbulence - individual atoms and molecules jostle about taking their heat with them. They also collide with each other and can exchange heat that way. The boundary created by the ocean-atmosphere interface means this turbulence breaks down as the water molecules are restricted from jostling about within this thin layer. The only way in which heat can move through this layer is via molecular conduction - heat flowing from one atom/molecule to another, as happens in a solid. With conductivity the rate of heat transfer varies with the steepness of the thermal gradient; a decrease in thermal gradient causes a decrease in the rate of heat transfer to the atmosphere.
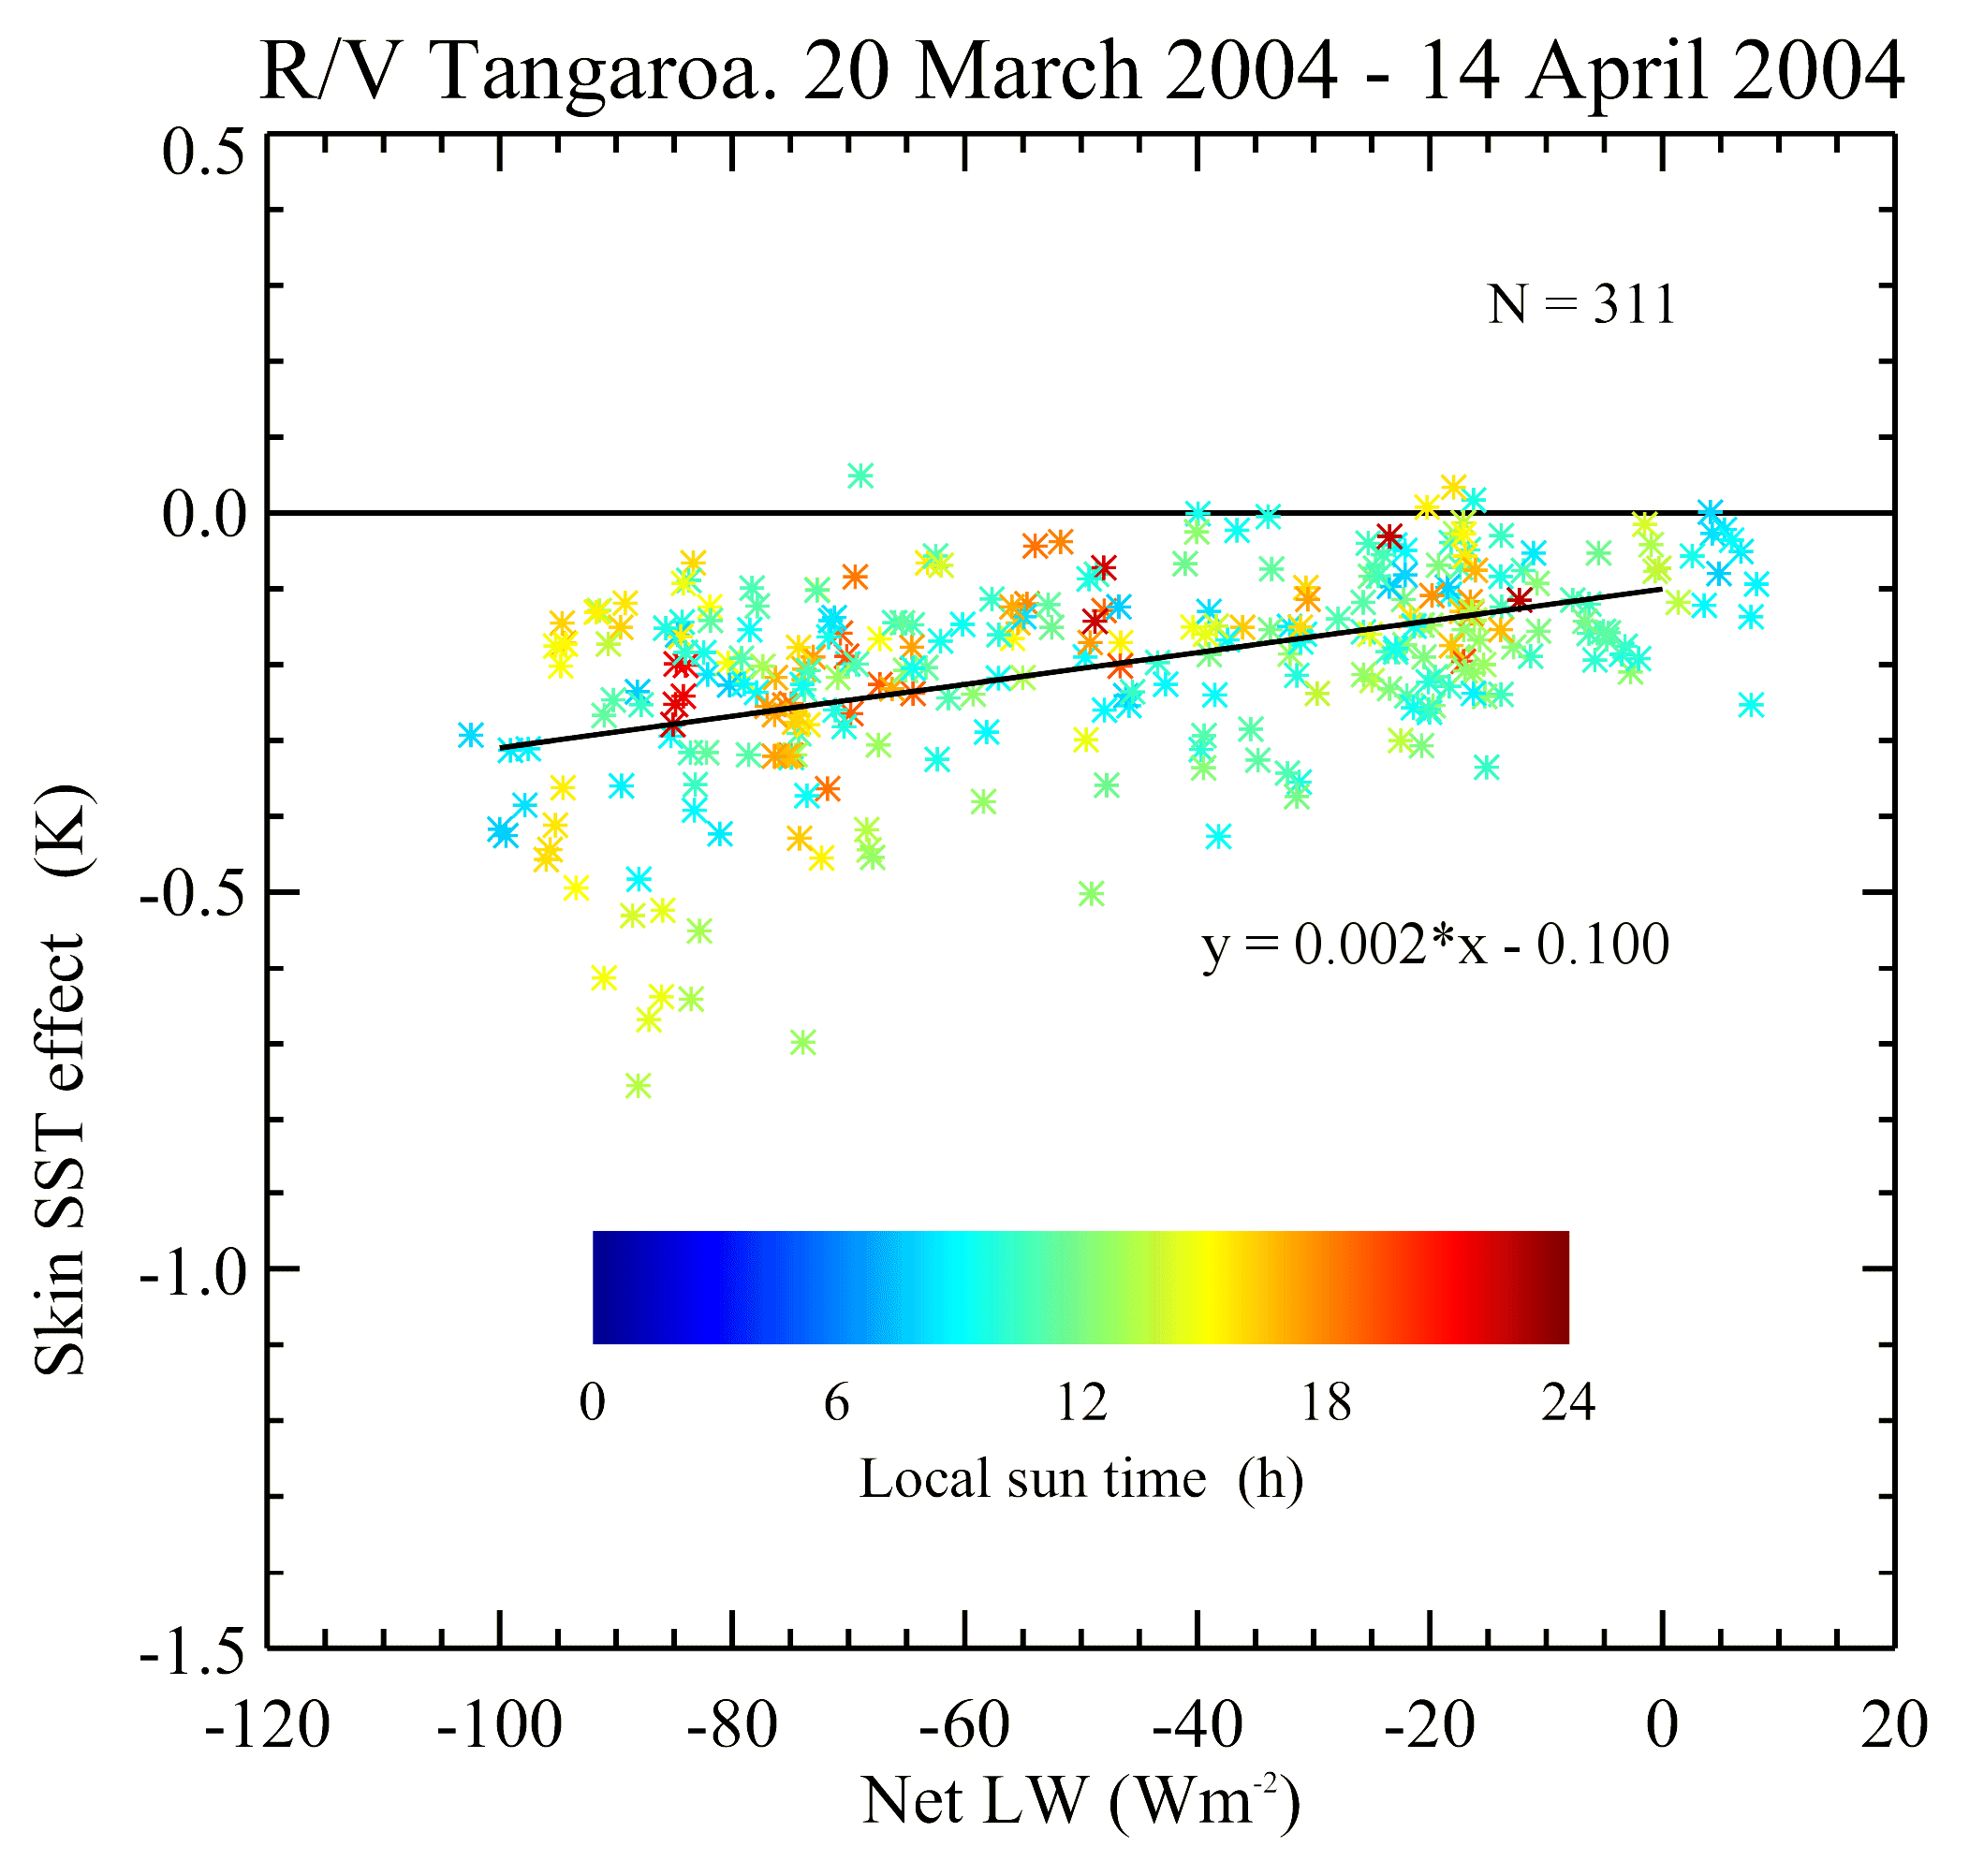
An increase in atmospheric greenhouse gases results in more atmospheric warming and more heat (longwave radiation) being re-radiated in all directions. Crucially, the heat directed back to the ocean surface increases. This additional heat is not energetic enough to penetrate the surface layers but is sufficient to warm the upper layer of the ocean cool-skin and therefore lower the thermal gradient through the conductive layer. This slows the rate of heat loss from the ocean and the oceans grow warmer. Of course this is a simplification, but the net effect of a number of interacting processes is to trap more of the sun's energy in the ocean as the atmosphere warms. A real-world demonstration of this heat-trapping capability under stronger longwave radiative forcing is provided in Figure 2. Cloud cover directs more heat back toward the ocean surface than clear-sky conditions. This effect is much stronger than the greenhouse gas forcing of the cool-skin layer, but it is a simple illustration of this mechanism at work.

Figure 2 - The change in the skin temperature to bulk temperature difference as a function of the net longwave radiation. The net forcing is negative as the clear/cloudy sky temperature is less than the ocean skin, but the key is to note that this approaches zero as longwave radiation increases (left-to-right). Image from Real Climate.
Gleckler et al [2016] examined changes in ocean heat content by comparing observations with the latest climate model simulations (CMIP5). They looked at three ocean layers, 0-700 meters, 700-2000 meters, and 2000 meters-plus. There is nothing intrinsically special about these three ocean layers other than that they represent the limits of measurement technology over time. Measurements of depths down to 700 meters have been made for many decades, but regular sampling of the 700-2000 meter layer has only been available since about 2003-2007 - with the roll out of the near-global Argo system of autonomous floats. By comparison the abyssal ocean (+2000 meters) has barely been measured at all. We don't expect a lot of warming down that deep, but climate models indicate the deep ocean cannot be neglected in terms of balancing Earth's energy budget (Palmer et al [2011]).
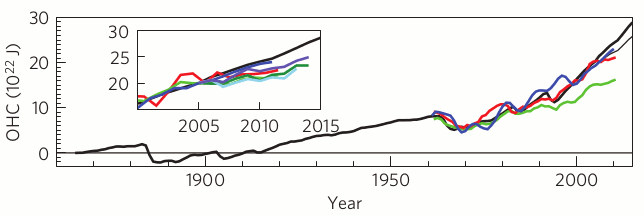
Measurements further back in time have greater uncertainty due to sparse sampling and a recent paper (Durack et al [2014]) suggests that warming, especially in the less well-sampled southern hemisphere, may be biased low earlier in the record. With this caveat in mind the authors found from 2005 onwards the ocean in the climate model simulations started to warm faster than observations (inset of Figure 3). One possible explanation is that after the year 2000 the climate models effectively have zero volcanic aerosol forcing. Because moderate-to-large volcanic eruptions eject considerable volumes of light-scattering sulfate particles into the atmosphere, they block incoming sunlight and therefore can reduce ocean warming. By not accurately simulating the cooling influence of observed volcanic eruptions after the year 2000, the forcing in the models is probably greater than that which actually occurred. A thorough examination of this issue was not carried out as it would require a level of work suitable for an entirely new paper, however the authors did apply a simple 'correction' to the model results based upon recent observational research. This can be seen in the main body of Figure 3. The correction yields a 7% reduction in simulated total industrial-era ocean heat and a much closer correspondence between the multi-model mean (the average of all the model runs) and observations.

Figure 3 - 0-700 meter layer climate model vs observational ocean heat content (OHC) comparison. The thick black line is the multi-model mean (MMM) and the thin black line after 2000 is the adjusted MMM to account for the 'missing' volcanic aerosols after 2000. The coloured lines are various published estimates of OHC, and the inset shows estimates based on Argo only set to the multi-model mean value in 2006. Image adapted from Gleckler et al [2016].
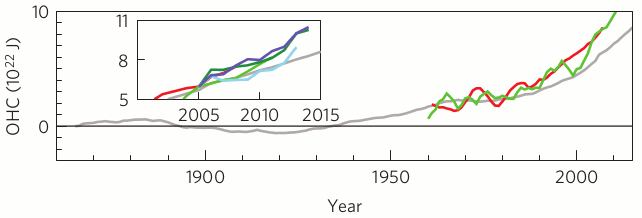
An interesting feature of the 700-2000 meter layer simulations versus observations is that this deeper layer is warming more rapidly than the climate models expect - see Figure 4. However it should be remembered that the multi-model mean averages out even decadal-scale variability, whereas the observations exhibit noticeable fluctuations on these time scales. Whether this seeming mismatch tells us anything useful only time will tell.

Figure 4. 700-2000 meter layer climate model vs observational ocean heat content. The thin gray line represents the MMM and the coloured lines are published estimates of OHC. Inset are Argo-based estimates set to the multi-model mean value in 2006. Image adapted from Gleckler et al (2016).
The findings of Gleckler et al will be no great surprise to regular Skeptical Science readers as it affirms, and is consistent with, a whole bunch of prior scientific research, but it does provide some quantitative analysis of industrial-era ocean warming and allow us to crunch some simple numbers. Since 1997 the climate model simulations indicate the oceans are now warming at 5 Hiroshima bombs per second, up from the 4 per second used in the global warming widget. It also throws into stark contrast the absurdity of contrarian claims of a pause in global warming, as 93% of the Earth's climate system has doubled its heat content uptake since 1997. It should be obvious that ocean warming won't stop until humans get a handle on carbon emissions.
Posted by Rob Painting on Thursday, 4 February, 2016
 |
The Skeptical Science website by Skeptical Science is licensed under a Creative Commons Attribution 3.0 Unported License. |