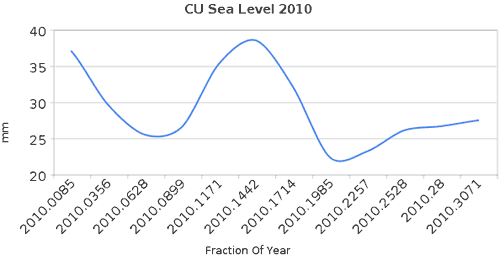
A proper understanding of climate requires we consider all the data, the full body of evidence. A common rhetorical technique used to portray a skewed picture is the technique of cherry picking. This involves choosing just the select pieces of data that paint a certain picture, even if the full body of evidence gives the completely opposite result. A vivid example of this is a recent post by Steve Goddard which casts doubt on the fact that we've experienced record hot temperatures over the last year, citing falling sea levels in 2010. This is based on the following graph showing satellite measurements of sea levels over 2010:

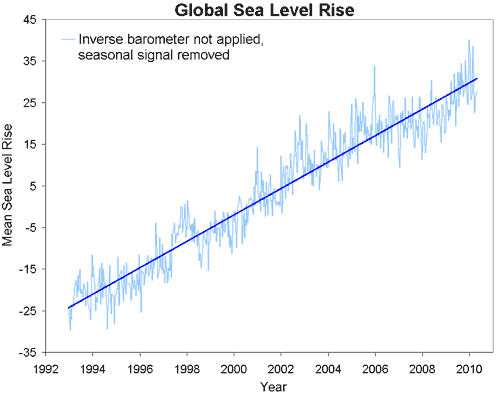
The satellite data comes from the University of Colorado - you can download the data directly. This data goes back to 1992. Here's what the full body of evidence looks like:

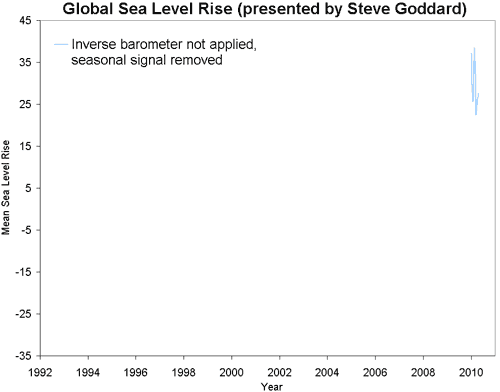
Early in 2010, global sea levels hit the highest levels on record. Realising this fact is not possible when the only data presented is the following:

Of course, there's a lot more that can be picked apart in Goddard's blog post (and readers are welcome to contribute to this process). There's no discussion of why sea levels might be dropping this year (I suspect it has something to do with the switch from El Nino conditions in early 2010 to La Nina conditions in the middle of the year). There is no exploration of what other factors besides air temperature contribute to glacier ice loss - Robert has explained the complexities of why glaciers loss mass here, here and here.
Instead all we are presented with is strong conclusions drawn from a very short piece of climate data. This is taken from a noisy signal showing many ups and downs throughout the long-term trend of sea level rise. A proper understanding of climate deserves much more than this.
Posted by John Cook on Sunday, 3 October, 2010
 |
The Skeptical Science website by Skeptical Science is licensed under a Creative Commons Attribution 3.0 Unported License. |