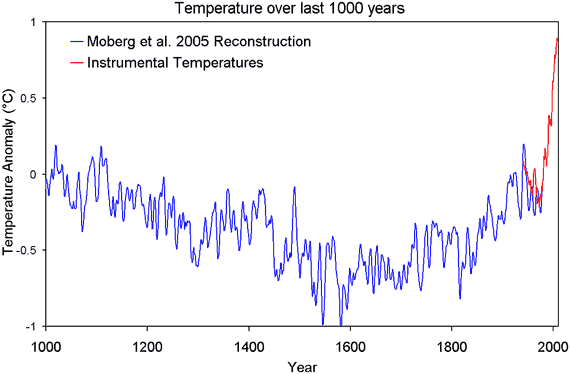
The hockey stick, a reconstruction of temperature over the last 1000 or so years, is a much maligned graph. Critics of the hockey stick insist it underestimates past climate change. In particular, many insist that temperatures during the Medieval Warm Period were warmer than now. The next logical leap is that if past natural climate change is comparable to today, then current climate change must also also natural. The irony of this line of thinking is that if the Medieval Warm Period did turn out to be much warmer than currently thought, this doesn't prove that humans aren't causing global warming. On the contrary, it would mean the danger from man-made global warming is greater than expected.

Figure 1: Northern hemisphere temperature reconstruction from Moberg et al 2005 plus instrumental measurements of northern hemisphere land temperature (CRUTemp).
To understand this, you first need to grasp the fact that climate doesn't change by magic. It changes when it's forced to change. When our planet suffers an energy imbalance (eg - the energy imbalance caused by rising CO2), it gains or loses heat. This change in heat is known as a radiative forcing or climate forcing. When our climate experiences a forcing, global temperature changes.
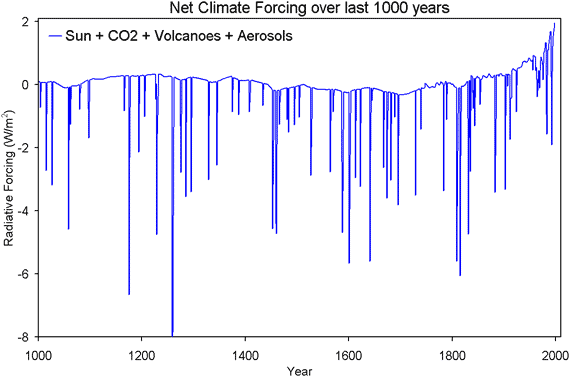
So to understand climate change over the last 1000 years, you need to look at the climate forcing over that time. The overall or net climate forcing is the combined effect of the drivers of climate over this time frame: mainly solar variations, changes in carbon dioxide, volcanic eruptions and aerosols:

Figure 2: The combined radiative forcing from solar variations, CO2, volcanoes and aerosols (Crowley 2000).
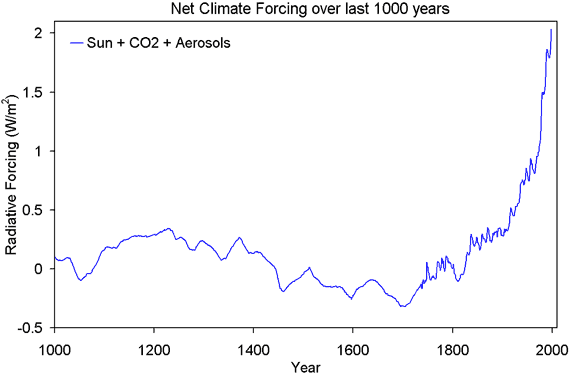
The dramatic spikes are the strong negative forcing from volcanic eruptions. To gain some visual clarity, Figure 3 shows net climate forcing without volcanic eruptions. This gives us a good approximation of net climate forcing as volcanoes for the most part only affect climate for a few years before the sulfate aerosols from the eruption are washed out of the atmosphere.
 Figure 3: The combined radiative forcing from solar variations, CO2 and aerosols - volcanoes are omitted (Crowley 2000).
The reason we see a hockey stick shape in temperature is because the climate forcing that drives temperature also shows a hockey stick shape. But from this data, we can do a lot more than compare shapes. We can calculate how much global temperature should change when it's subjected to a climate forcing. This information is crucial in enabling us to predict how climate will act in future decades in response to rising greenhouse gases.
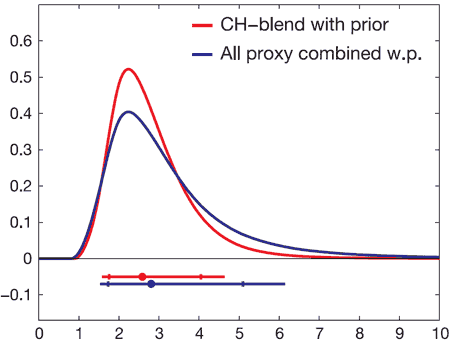
The temperature response to a climate forcing is known as climate sensitivity. Technically, climate sensitivity is defined as the change in global temperature if the planet experiences a climate forcing of 3.7 Watts/m2 (which is how much climate forcing you get from a doubling of CO2). The amount of positive feedback in our climate system determines how sensitive our climate is. If there's net negative feedback, the climate sensitivity will be less than 1.2°C. If climate sensitivity is greater than 1.2°C, our planet has net positive feedback. Climate sensitivity can be calculated by using temperature change over the past 750 years along with the change in radiative forcing (Hegerl et al 2006). Doing this yields the following result:

Figure 3: Climate sensitivity from palaeoreconstructions going back 750 years, combined with climate sensitivity calculated from instrumental records. The horizontal bars represent the 5 to 95% range, indicating a climate sensitivity range of 1.5C to 6.2C (Hegerl et al 2006).
When you combine the temperature record over the past millennium with climate forcings, you get a climate sensitivity around 3°C. In other words, net positive feedback. This is consistent with the IPCC climate sensitivity range of 2°C to 4.5°C. Positive feedback is the reason why we expect to see strong warming over the next century in response to the climate forcing from rising CO2.
Can you now see the irony in insisting on a warmer Medieval Warm Period? If for some reason, temperatures over the Medieval Warm Period turn out to be warmer than previously thought, this means climate sensitivity is actually greater than 3°C. The climate response to CO2 forcing will be even greater than expected. So to argue for a warmer Medieval Warm Period is to argue for greater climate sensitivity and greater future warming due to human CO2 emissions.
UPDATE 21 Oct 2010: I've corrected the labelling of Figure 1 from "instrumental temperature measurements of northern hemisphere (HadCRUT)" to "instrumental measurements of northern hemisphere land temperature (CRUTemp)" to clarify that the instrumental data is land temperature, not land and ocean (as the Moberg data is also land only).
Posted by John Cook on Tuesday, 19 October, 2010
 |
The Skeptical Science website by Skeptical Science is licensed under a Creative Commons Attribution 3.0 Unported License. |