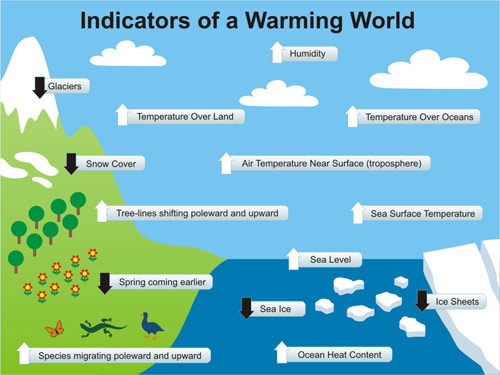
I've added another pic to the high-rez Climate Graphics. This one is a graphic summary of just some of the evidence for global warming. When someone tells you global warming isn't happening, this serves as a visual reminder that you need to consider all the evidence to understand what's happening to our climate. Signs of warming are being found not only all over the globe but in many different systems. Ice sheets are shrinking. Tree-lines are shifting towards the poles and up mountains (eg - to cooler regions). Glaciers are retreating. Spring is coming earlier. Species are migrating to cooler regions. And so on...

This pic is adapted from The Guide to Global Warming Skepticism, stretched to 1024 x 768 pixels for powerpoint presentations. The attentive reader may have noticed it bears more than a passing resemblance to a pic from the NOAA State of the Climate Report. Yes, I borrowed the concept from them but hey, in the NOAA Report (page 4), they borrowed my graphic on where global warming is going so we're even! :-)
However, I did think the NOAA graphic could use some fleshing out. There is a fantastic paper A globally coherent fingerprint of climate change impacts across natural systems (Parmesan & Yohe 2003). This paper looks at changes in a whole range of systems, including more than 1700 species. What they find is the distribution of plants and animals are shifting towards the poles around 6 kilometres per decade. Spring events are advancing just over 2 days per decade. Animals are also mating earlier and I'm fairly sure this is because of warming, not because they're getting randier.
There are a number of other indicators of warming that I considered including in the graphic. For example, lake and river ice cover are freezing later and breaking up earlier (Magnuson 2000, Hodgkins 2005, which would've made a good visual inclusion. Arctic permafrost is warming at greater depths (Walsh 2009) but how do you depict that? Lakes are warming (Schneider & Hook 2010) and the growing season is lengthening (Christidis 2007). But there was only so much room to fit in the graphic before it gets too crowded. Maybe I'll do a poster version one day.
As with all our Climate Graphics, this one is under a Creative Commons license so you're welcome to reuse it. It's available in a number of formats:
Posted by John Cook on Thursday, 30 December, 2010
 |
The Skeptical Science website by Skeptical Science is licensed under a Creative Commons Attribution 3.0 Unported License. |