This is an opinion piece. I offer my views of how some data is presented to focus on small gains and away from large setbacks in addressing the climate crisis. I invite you to give your opinions in the "Comments" section at the end of this post.
With feet firmly on the accelerator pedal, we're speeding faster and faster down an increasingly treacherous road. The brakes ineffective, so far, to slow us down. One last chance to exit this road before it becomes unnavigable at our speeds. Cruising by the 1.7°C exit ramp, we are told there is a plan to develop, install, and then apply new, better brakes before we reach the 2°C exit ramp. These untested wonder brakes can not only stop our speeding car before we reach the 2°C exit ramp, we're told, but they can do so without spilling any drinks!
Some even talk about stopping so fast that we exit at the 1.5°C ramp.
Really!?
I'm skeptical!
If this was a simple car with a simple engine and a simple reverse gear and driven by a single person who just had to apply the simple brakes ... maybe. But this is a car not being propelled by a single, controllable engine, but by 8 billion people all pushing this car. The car is accelerating because each year 80,000,000 additional people get behind the car to push it to higher speeds.

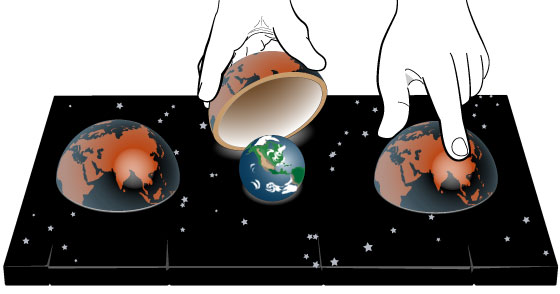
A shell game is played, knowingly or unknowingly, that showcases spotty successes, and hides the true scope of the climate crisis and requisite solutions. In this post I offer a couple of views on how the shell game is played and, more importantly, a simple method for determining if you're being snookered. We need to support efforts to stabilize climate. That is not the question. But to effectively plan for the future, you must learn how to assess our actual progress towards climate stabilization.
John Mason discusses the disconnect of people from the world around them (read here). The environment is not something we live in, it is something we see when we go into the “country”, to the “beach”, or somewhere associated with a “nature” place. Apples don’t come from trees, they come from the supermarket. Gas does not come from oil wells, but from the local gas station. People are fed a version of reality that is intertwined with fictional dramas. We become scripted actors on an artificial stage. The goal of those running the "show" that we call "life" is to maintain compliant consumers who ask few questions and loyally consume what they are fed while asking a minimum of questions.
The trained consumer is served optional realities selected from myriads of media feeds. To attract viewers, stations create palatable, marketable versions of reality. Into this world of viewer-selected alternate realities we will try to channel information about the real-world climate emergency, what we plan to do about it, and how scripted actors are expected to participate. That is, provided disconnected consumers don’t change the channel to a station where the weather is always nice and predictable and where tragic events are OK, because they’ve happened before and they always happen somewhere else. The "News" has become little more than another "Daytime Drama."
This disconnect is dangerous, because the climate emergency may only ever be nightly news entertainment. If one channel offers a version of reality more pleasant and less guilt-ridden, --click--. This continues until like an Amazon-Prime package, reality is finally delivered one day, by the environment, to your front door in the form of one of a smorgasbord of natural disasters. At that point we may have reconnected one person to reality. One down, many more to go.
Examples abound of scientific miracles that have transformed our lives: smart phones, medical devices, apps that do just about anything imaginable. More recently, the rapid and successful development and deployment of Covid vaccines. The abundance of examples of successful transitions from conception to consumers creates a blind faith that anything scientists develop will be rapidly and successfully deployed to consumers. But to succeed, new ideas must navigate the following deployment chain
Which illustrated looks like
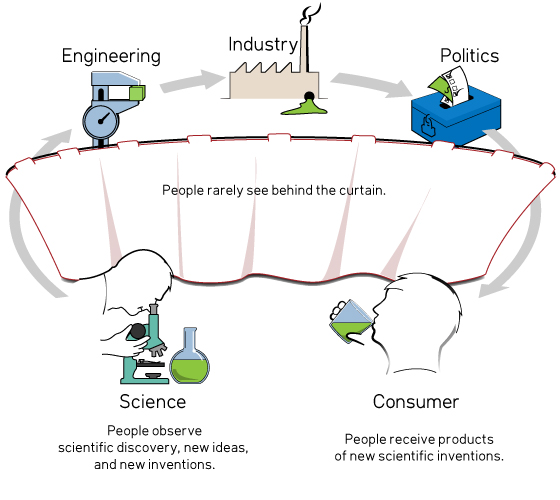
Be skeptical of how quickly and easily we'll implement the scientific miracles developed to save us from the climate crisis. Not everyone participating in the deployment chain is as enthusiastic as the authors (think vested interests). Or there may be pesky problems such as budget limitations, material shortages, technical issues, or consumer rejection (think Covid vaccines).
The job of scientists is to feed ideas into the start of the deployment chain. The job of consumers is to remove devices from the end of the deployment chain. Consumers and scientists are, for the most part, disconnected from the difficulties and realities of getting scientific ideas through the deployment chain.
This leaves scientists disconnected from the real-world path their ideas must traverse from concept to consumers. Their ideas may be oversold, in part, because the difficulty of navigating the deployment chain is minimized.
The shell game works because marketeers hype their products, hide impediments, with the effect of maximizing hope while minimizing hurt. Disconnected Science sells well to Disconnected Consumers who hold in their hands the miracles of science, sold to them for a modest price. Disconnected Consumers are easily led to believe that science can produce any kind of life-saving miracle. The shell game feeds into this narrative by compressing the difficult science-migration path from its full form illustrated above, to the much simpler form
Those pesky intermediate steps that slow down the deployment chain are conveniently omitted, or hidden in charts that often highlight only the positive trends. The idea that emerges is more like, because we have wind turbines and solar panels, with the wave of a hand we can easily switch from fossil fuels to renewables. Cars? Now that all the car companies have announced aggressive plans to electrify their fleets, we simply start buying EV's and we will easily eliminate vehicular GHG emissions.
Despite all of the progress and hopeful news, here are two examples of the kind of shell games played, knowingly or unknowingly, that make me skeptical of how "easily" and "quickly" we'll stabilize the climate. The point of this analysis is not to discourage you nor to criticize particular entities. The goal is to help you gauge the effort needed to stabilize the climate so that we can enact effective mitigation and adaptation strategies. The job will be much more difficult than we're being told, and we need to prepare for a more difficult struggle to tame the climate than the Disconnected Science projects.
Here are two examples of how the shell game is played. The first example shows how the presentation of population data can hide what is really happening and show an opposite trend. The second example shows how focusing your attention on one set of data, and ignoring another, gives a false sense of progress.
Misleading statistics
Global population is one of the main drivers of the climate crisis, because each person is a carbon emitter. Until I got involved studying climate issues, I routinely heard here and there that global population growth was slowing, heading down at the good clip shown in Fig. 1. The implications were that we would not have to worry about the effects of overpopulation because birth rates were "stabilizing".
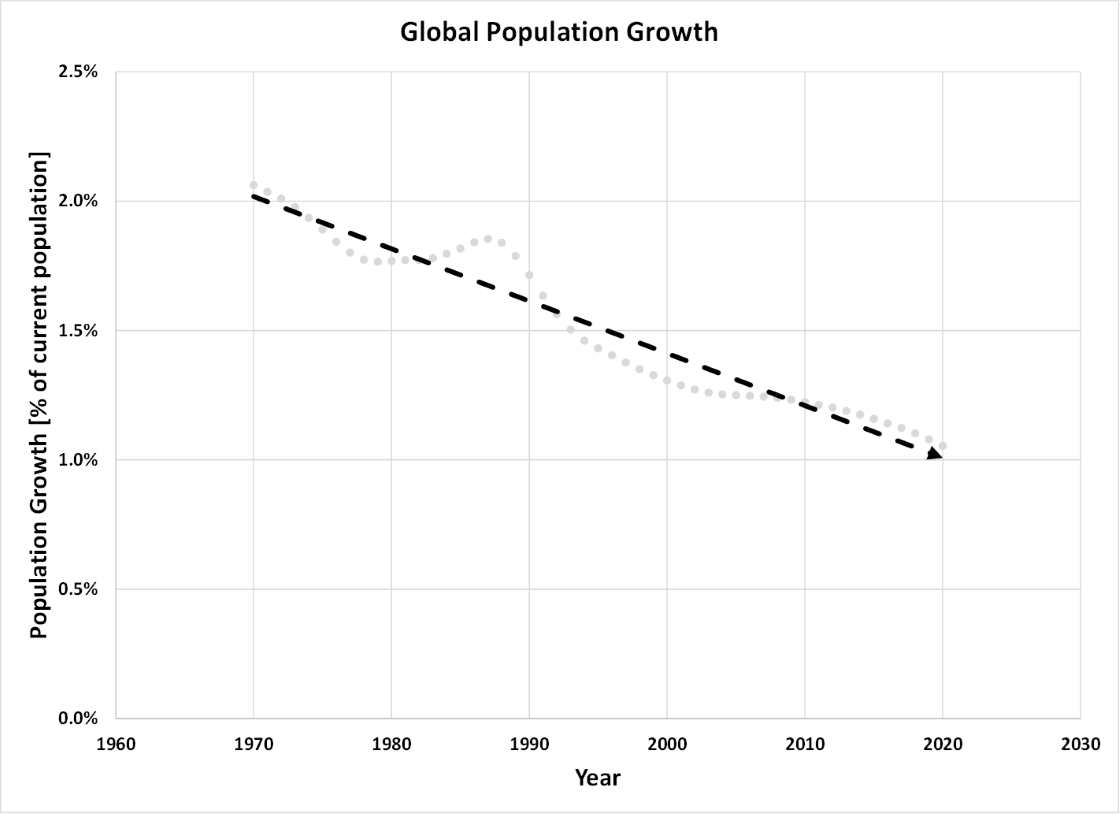
Figure 1. Annual, global population growth as a percentage of current population (data is here).
Great, we have that problem under control and there is no need to worry. Population should be leveling off just as soon as that straight line hits zero. There is a problem with Fig. 1, however. It does not show population growth, it shows population growth as a percentage of the current population. Figure 2 shows a plot of actual population growth.
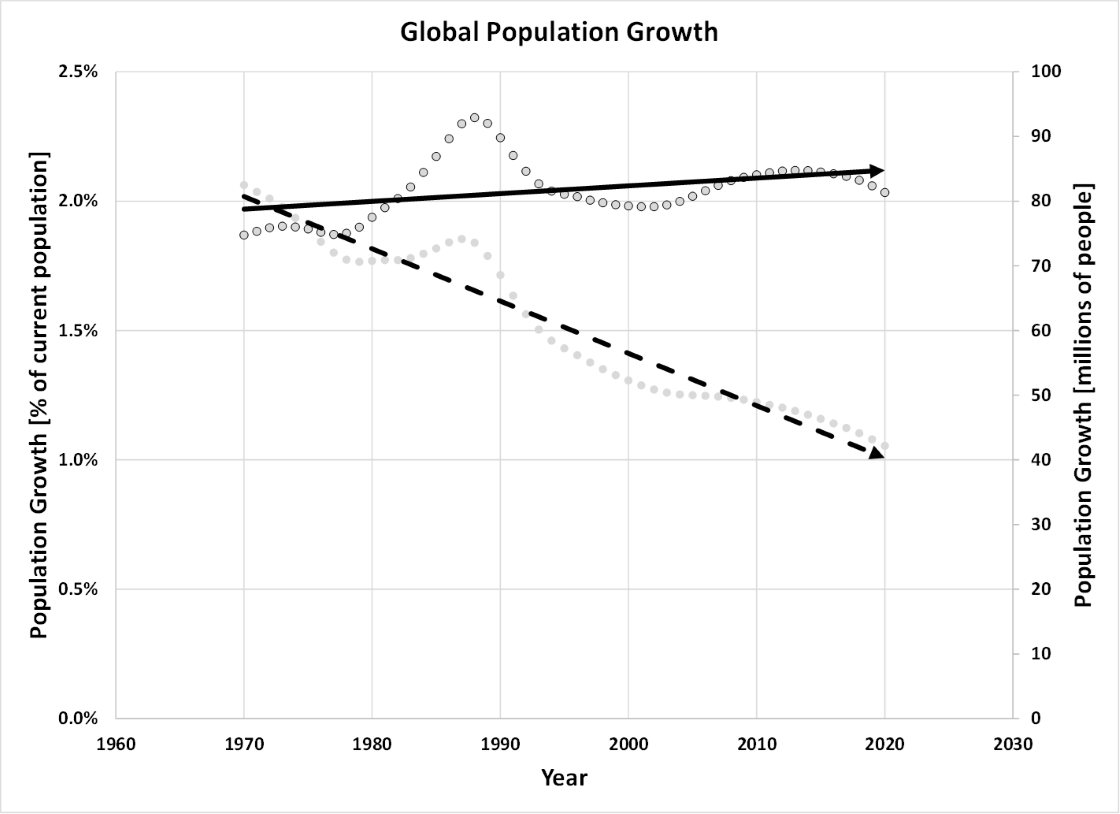
Figure 2. Annual, global population growth as a percentage of current population (dashed line) and as actual growth (solid line). Data is here.
So, all these years the population growth rate had actually been increasing, not decreasing. Or, because we don’t want to split hairs, the population growth rate has been nearly constant for the last 50 years at about 80,000,000 people/year. Growth in a finite world with limited resources ends only one way. Just ask a bunch of breeding rabbits with limited food supply.
After many years of being misled by statistics, I now know the truth. But before you cheer at the downward trend since 2015, the governments of many countries around the world have noticed that drop as well, and now are actively encouraging their populations to have more children. Even when the natural progression of human civilization is taking population where we know it needs to go if we are going to “solve” the climate crisis, governments are stepping up their efforts to prop up global population. Drat!
The shell game presents population data in such a way as to hide the 50-year trend of steady, consistent, unchanging population growth. Will government intervention maintain that steady growth?
Showing the good parts, hiding the bad parts
Then there is the issue of the deployment of renewable-energy systems: wind and solar and others. Theoretically that is going great guns with exponential growth starting in 2000, and a rosy future for continued, exponential growth to come. The growth shown in Fig. 3 makes us feel very good and hopeful. To build extra hope, it's good to show the arrow busting up through the top of the graph.
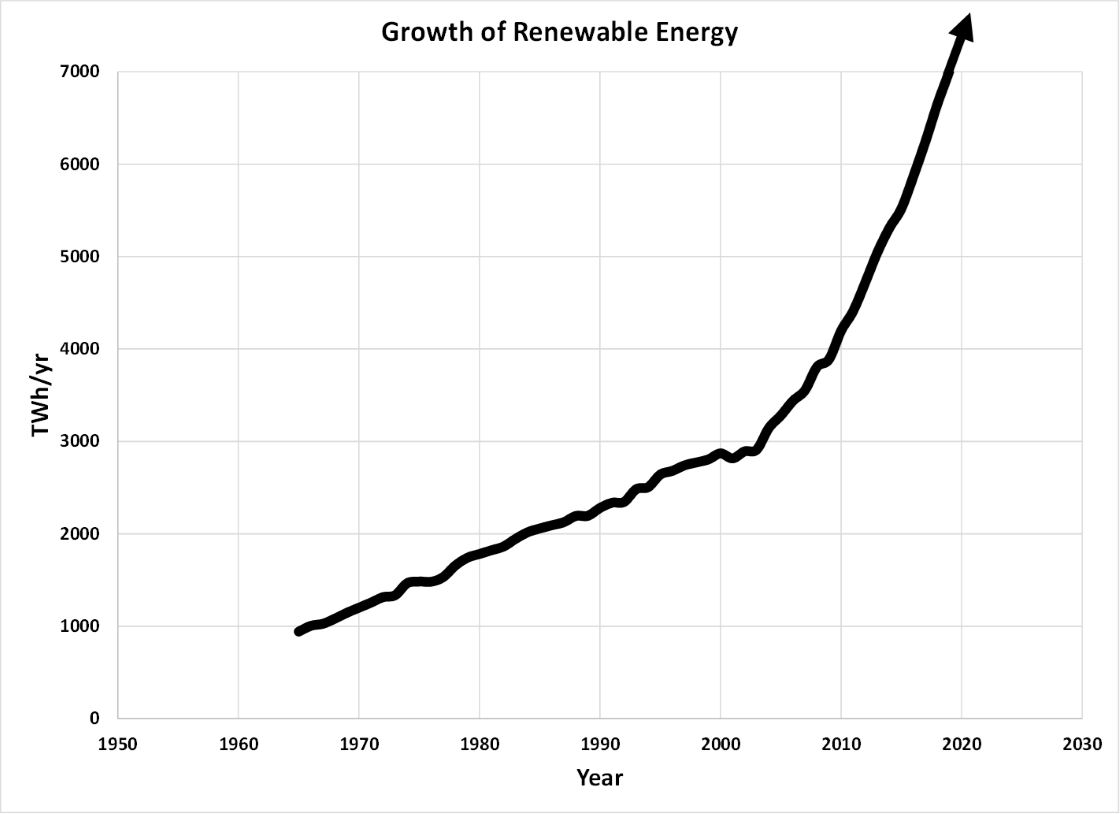
Figure 3. Global renewable electricity generation by year (data is here).
Just look at that steep climb. It’s like a rocket headed for the Moon. Or is it Mars? Graphs like this are great for lifting the spirits of people who know a thing or two about the climate crisis. Thing is, over this same time period the Keeling Curve has not deviated from its upward acceleration one bit. Not at all. Why? Because
The Keeling Curve does not care about the rise of renewable energy!
Any scientist or educated science communicator knows this, and yet we're shown graphs such as Fig. 3 which show this rapid growth of renewables. The Keeling Curve cares about what’s happening to fossil-fuel consumption. The Keeling Curve will only take note if the rise of renewable energy substitutes for fossil-fuel use and does not supplement it. How about we plot the two together to see how the rise of renewables has affected fossil-fuel use.
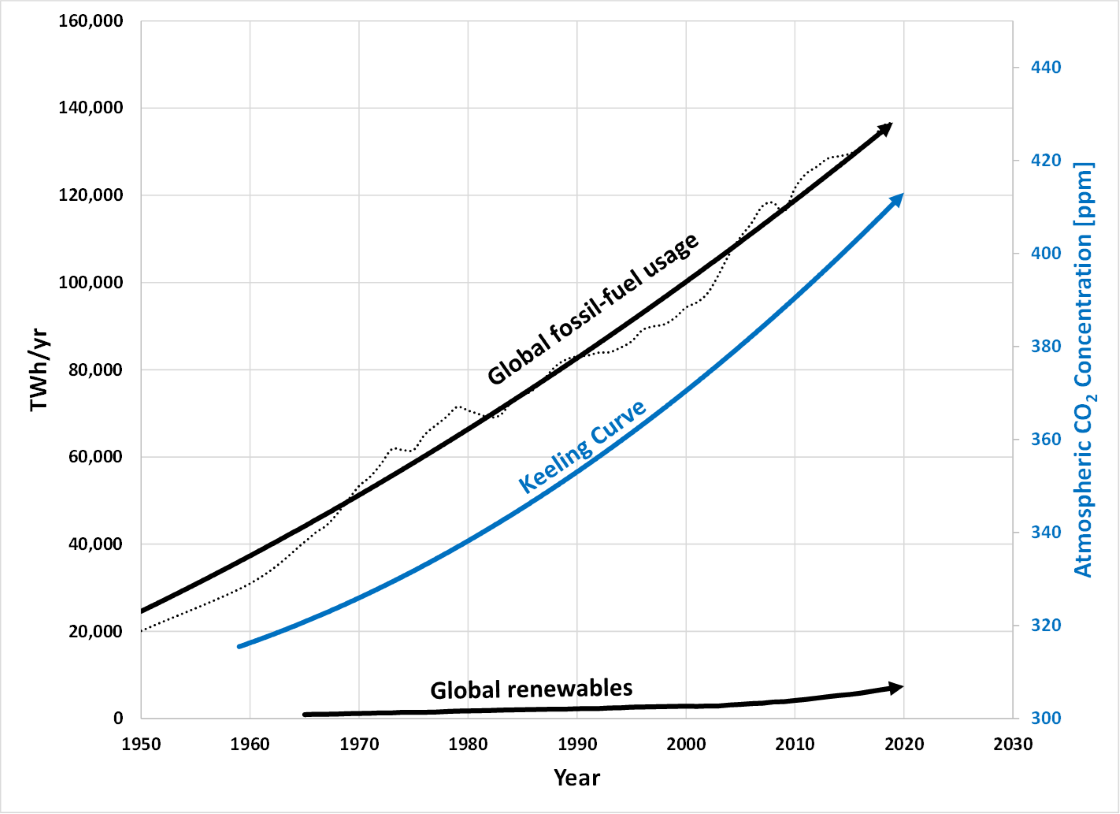
Figure 4. Global renewable electricity generation, global fossil-fuel usage, and Keeling Curve. Renewable energy data is here, fossil-fuel usage data is here.
How impressive does that "Global renewables" line look when compared to the fossil-fuel usage line? What impact has it had on the "Global fossil-fuel usage?" For all our progress with renewable energy, it remains little more than a hope for the future and currently is coexisting with, rather than replacing fossil-fuel use. Apparently the vested interests powering our world with fossil fuels are happy to let renewable energy mop up the energy crumbs while fossil fuels command the lion's share of energy supply. How easy will it be to switch the position of the renewable-energy and fossil-fuel curves? Might the vested interests resist this swap?
Up to 2020, there is no indication of any slowdown in fossil-fuel use. There is lots of talk about slowdowns in isolated segments here and there, but the total usage keeps going up. The Keeling Curve responds to the fossil-fuel usage curve, and not to the renewable-energy curve.
The shell game focuses our attention on the meteoric rise of renewables, and distracts us from the comparable rise of fossil-fuel usage and the upward acceleration of the Keeling Curve. Don't just ask "What will it take to scale up renewable energy systems?" Ask also, "What will it take to scale down entrenched fossil-fuel systems?"
Science communicators advertize solutions for stabilizing the climate at 1.5°C, even though in 2022 there is enough carbon in the atmosphere to take us to 1.7°C and by 2050 we will easily have enough carbon in the atmosphere to take us to 2.0°C or more ... if we don't succeed in getting the Keeling Curve to descend.
How can you assess whether you're being snookered by climate-stabilization projections? How is the climate shell game being played?
Global policy makers raise hopes by citing all of the agreements that have been reached. Promises for what climate negotiators around the world say their governments will commit to in the future. One company after another announcing they are carbon-neutral. Questionable, opaque methods likely used to determine carbon neutrality. Now the grand plan is to make the entire world carbon neutral by sucking CO2 out of the atmosphere.
I'm not here to throw cold water on the negotiations and efforts under way. I support them. I am here to help you assess how well we're converting talk into action. Future plans you and your family make depend on the sum total of our effort, not on the bits and pieces, and certainly not on bold talk.
There are two things to monitor: global population and the Keeling Curve. Global population is one of the prime drivers of the Keeling Curve. Although there are bold plans to reduce the per-capita carbon footprint, adding 80,000,000 new carbon emitters each year simply means that however more efficient we make each carbon emitter, year after year after year we keep adding more and more of them. As long as global population growth continues anywhere near 80,000,000 new carbon emitters/year, it represents a very strong headwind. Figure 5 shows a near linear relationship, over 100 years, between global population and annual atmospheric CO2 accumulation.
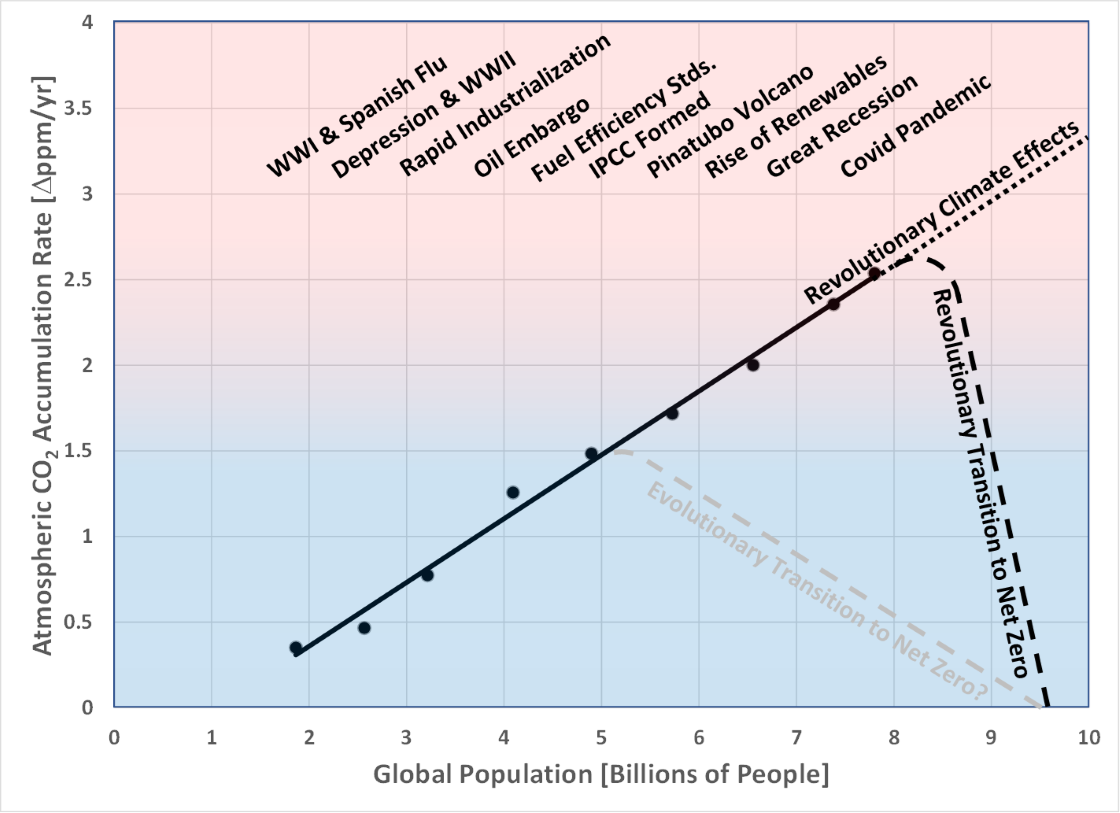
Figure 5. Annual atmospheric CO2 accumulation rates vs global population. Various notable events are shown. The dashed lines show the trend towards Net-Zero we might have followed had we started immediately after the IPCC was formed, and the trend currently proposed. This figure implicitly assumes that we will reach a global population of 9.5 billion by 2050, the target year for achieving Net-Zero.
Or to put it into an easier form to monitor, Table 1 shows the pace at which we need to ramp down the annual rate of CO2 accumulation to reach Net Zero by 2050. Table 1 also shows the resulting CO2 concentration. Keep track of how well we're doing. The numbers bounce around from year to year, so don't expect them to exactly follow this trend every year.
Table 1. Path to achieving Net-Zero by 2050.
| Year | ΔCO2 [Δppm/yr] | CO2 Conc [ppm] |
| 2021 | 2.5 | 415 |
| 2022 | 2.5 | 417.5 |
| 2023 | 2.4 | 420 |
| 2024 | 2.3 | 422.4 |
| 2025 | 2.2 | 424.7 |
| 2026 | 2.1 | 426.9 |
| 2027 | 2.0 | 429 |
| 2028 | 1.9 | 431 |
| 2029 | 1.8 | 432.9 |
| 2030 | 1.7 | 434.7 |
| 2031 | 1.6 | 436.4 |
| 2032 | 1.5 | 438 |
| 2033 | 1.4 | 439.5 |
| 2034 | 1.3 | 440.9 |
| 2035 | 1.2 | 442.2 |
| 2036 | 1.1 | 443.4 |
| 2037 | 1.0 | 444.5 |
| 2038 | 0.9 | 445.5 |
| 2039 | 0.8 | 446.4 |
| 2040 | 0.7 | 447.2 |
| 2041 | 0.6 | 447.9 |
| 2042 | 0.5 | 448.5 |
| 2043 | 0.4 | 449 |
| 2044 | 0.3 | 449.4 |
| 2045 | 0.2 | 449.7 |
| 2046 | 0.1 | 449.9 |
| 2047 | Net-Zero | 450 |
This path shown in Table 1 leaves us with 450 ppm CO2 in 2050, sufficient to take us to 2°C warming, if we don't get CO2 to start decreasing at that point.
It would be a huge success to stabilize the climate at any temperature.
It would be an even larger success to stabilize the climate at 2°C.
What would it take to stabilize the climate at 1.5°C?
To stabilize the climate at any temperature will hurt. There will be sacrifice and people forgoing things they want. But that is not the message that is being broadcast. The messaging needed is alluded to by a quote from Kevin Anderson and Alice Bows in a paper they wrote (read here):
“… this is not a message of futility, but a wake-up call of where our rose-tinted spectacles have brought us. Real hope, if it is to arise at all, will do so from a bare assessment of the scale of the challenge we now face.”
It is time that we stop playing a climate shell game, deceiving people about what it will take to get out of our climate mess. Telling people the truth is not a guarantee of success, but deceiving them about what it will take to solve the climate crisis will commit us to ineffective action. Will we inform them of the truth or wait until climate disasters wake them one-by-one from their stupor?
If climate skeptics/deniers are being dishonest about how bad the problem is, a vocal part of the scientific community, or scientific messengers, are not being honest about what is needed to effectively deal with the climate crisis.
Playing the climate shell game will not magically solve the problem. At best, it keeps consumers happy until they are woken from their slumber by an unwelcomed, but expected climate demon.
These are my thoughts on the subject. What do you think? How do you feel about the information you're getting? Tell us below in the "Comments" section.
Posted by Evan on Monday, 21 March, 2022
 |
The Skeptical Science website by Skeptical Science is licensed under a Creative Commons Attribution 3.0 Unported License. |