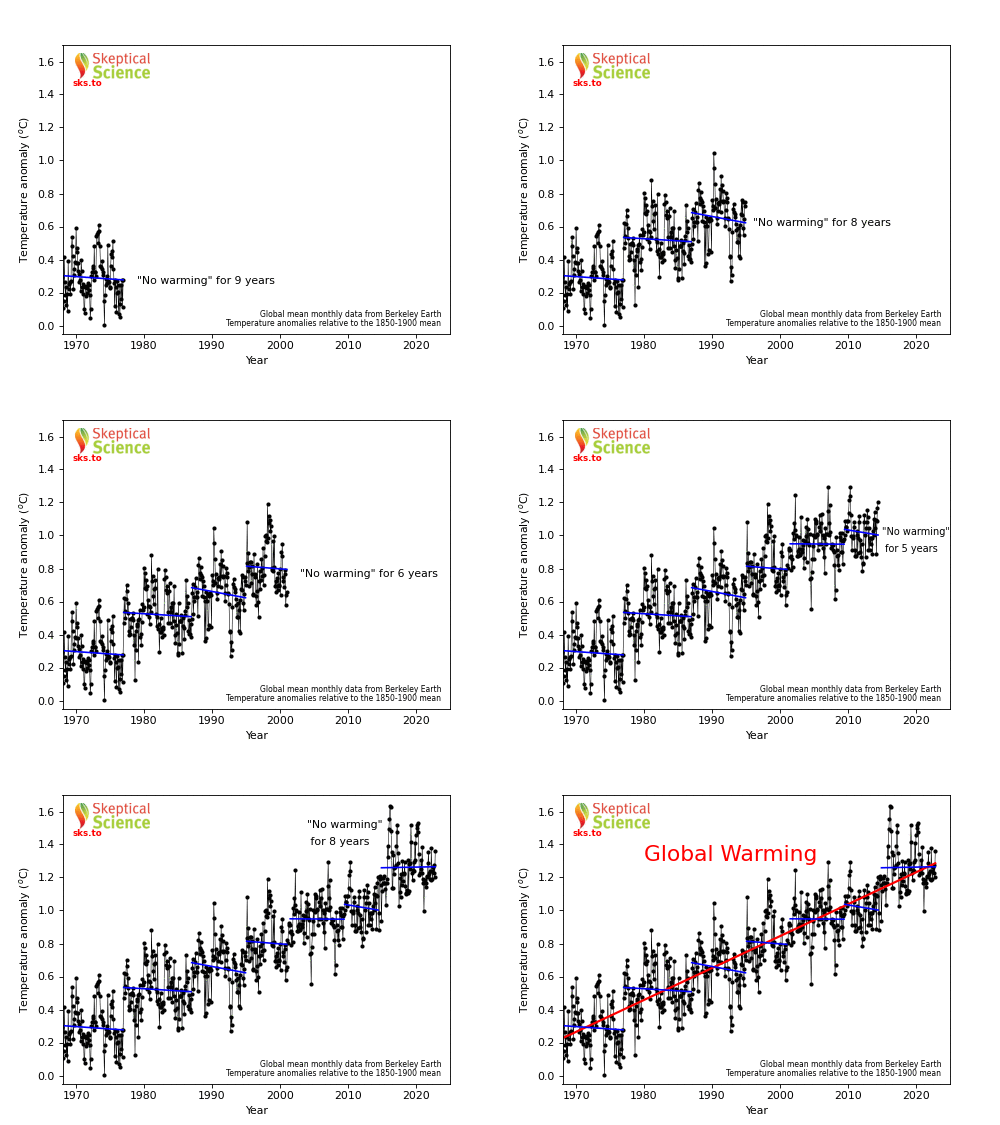
One of the most effective, and successful, graphics developed by Skeptical Science is the escalator. The escalator shows how global surface temperature anomalies vary with time, and illustrates how "contrarians" tend to cherry-pick short time intervals so as to argue that there has been no recent warming, while "realists" recognise that even though there can be short-term variability, the long-term trend clearly indicates the reality of global warming.
A prominent example of the former was the one-time repetitious claim that it hadn't warmed since 1998, a year when there was a very strong El Nino. This claim persisted for quite some time, before - unsurprisingly - being dropped when it became clear that warming hadn't paused. However, this hasn't stopped others from making similar claims about more recent time periods, including, in 2019, a claim that we had just entered a cooling period. The escalator is a really nice way to illustrate the problem with such nonsense.
However, our escalator is now slightly dated. The original version went up until 2011, while the current version ends in 2015. We also noticed that Robert Rohde had updated the escalator and produced a staircase of denial. This motivated us to update our escalator, which we present below.
Source for data used in the graphic: Global mean monthly temperature anomalies, relative to the 1850-1900 mean, from Berkeley Earth.
Posted by Ken Rice on Wednesday, 1 February, 2023
 |
The Skeptical Science website by Skeptical Science is licensed under a Creative Commons Attribution 3.0 Unported License. |