What causes short term changes in ocean heat?
Over the past 40 years, global ocean heat content has shown a long term warming trend. However, the warming hasn't been monotonic. There are periods where ocean heat drops for several years before the warming trend resumes. On several occasions, this is due to large volcanic eruptions which cause a drop in global temperatures. On other occasions, upper ocean heat drops with no volcanic activity. What causes these breaks in warming?
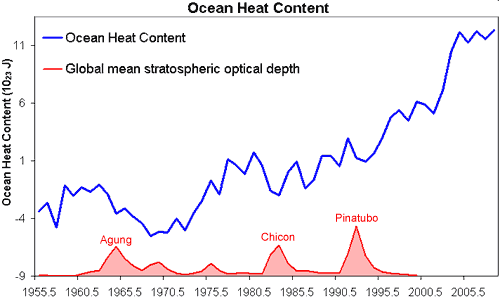
Figure 1: global upper ocean heat content from 1955 to 2008. Blue line is yearly ocean heat content for the 0–700 m layer (Levitus 2008). Red line is the global mean stratospheric optical depth, indicating the timing of major volcanic eruptions (NASA GISS, data ends in 1999).
This question is examined in Interannual variability in upper ocean heat content, temperature, and thermosteric expansion on global scales (Willis 2004). Willis finds that short term, interannual variability in global upper ocean heat is strongly influenced by variability in the tropics, particularly in the Pacific and Indian Oceans. And much of the variation is related to the El Niño Southern Oscillation (ENSO).
ENSO refers to a cycle between El Niño and La Niña conditions across the tropical eastern and central Pacific. In normal conditions, trade winds blow towards the west across the tropical Pacific. These winds pile up warm surface water in the west Pacific. This thickened layer of warm water depresses a layer of subsurface water called the thermocline, which lies between the warm surface waters and the much colder deep ocean. On the east Pacific, the warm surface waters are blown off shore and must be replaced. The replacement waters are the cooler waters from the lower parts of the ocean.
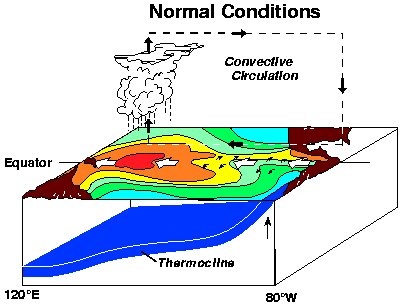
Figure 2: conditions in equatorial Pacific during normal conditions (no El Niño or La Niña). Image courtesy of NOAA.
During the La Niña phase, these conditions intensify. This leads to more cold water upwelling in the East Pacific. The thermocline rises as more cold water penetrates into the upper ocean. Sea-surface temperatures are colder than usual in the central and western Pacific.
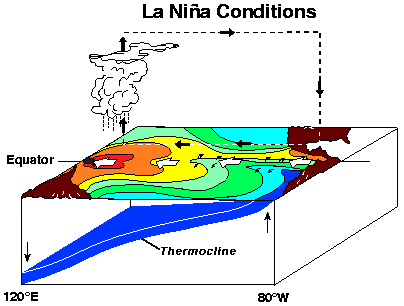
Figure 3: conditions in equatorial Pacific during La Niña conditions. Image courtesy of NOAA.
How much does this cycle contribute to global upper ocean heat? Figure 4 shows heat content both globally (dashed line) and over the tropics (solid line, 20°N to 20°S). As La Niña intensified, heat content in the tropics decreased rapidly through the end of 1998 and the first half of 1999. Global heat also fell during this time, but somewhat less so, suggesting that some of the tropical heat may have been exported to higher latitudes. The cooling, both globally and in the tropics, gave way to rapid warming in mid-1999 with the subsiding of La Niña.
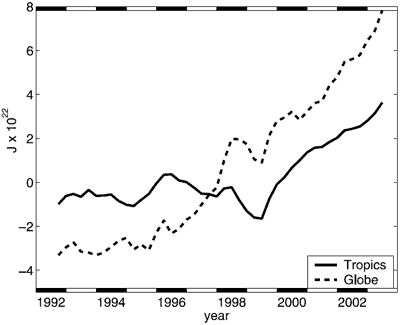
Figure 4: Interannual variability in heat content integrated over the tropics 20°N to 20°S (solid line) and over the entire globe (dashed line). Graph from Willis 2004.
This puts recent trends in upper ocean heat content in context. Leuliette 2009 discusses how weak El Niño conditions in 2006-2007 were followed by a moderate La Niña in mid-2007. Similarly, Cazenave 2009 suggests that the drop in upper ocean heat in mid-2007 could be related to the particularly strong recent La Niña cold phase.
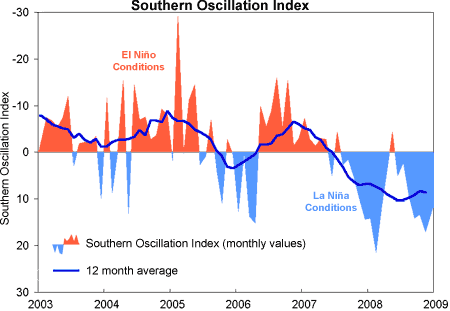
Figure 5: Southern Oscillation Index (monthly values and 12 month average), courtesy of Australian Bureau of Meteorology.
Globally, upper ocean heat has dropped since mid-2007. However, if one focuses on one piece of the puzzle without understanding the broader picture of the physical mechanisms involved, it can lead to the erroneous conclusion that the long term warming has ended. By recognising that La Niña causes short term cooling in upper ocean waters and that we've been in La Niña conditions since mid-2007, we see that current ocean cooling is a case of internal variability imposed upon the long term trend.
Acknowledgements: thanks to John Cross for his feedback and research for this post.
Posted by John Cook on Tuesday, 2 June, 2009


