Over the last few weeks, three different papers have been published that all examine ice loss from the Greenland ice sheet. What's interesting is all three papers use entirely different methods to measure the rate of ice loss. Even more interesting is that these three different methods paint a consistent picture of what's happening to Greenland.
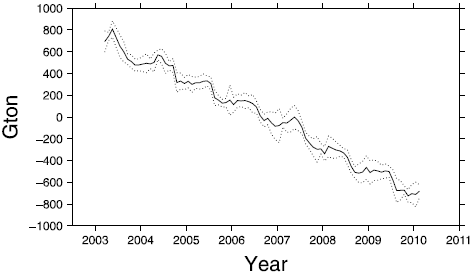
Schrama et al 2011 uses gravity measurements from the GRACE satellites to determine any change in mass of the Greenland ice sheet (there's a great article The Riddle of the ice about Ernst Schrama's work). They find from March 2003 to February 2010, Greenland lost ice mass at a rate of 252 gigatonnes per year. A key result from their paper was to confirm that ice loss had spread to the north west of Greenland.

Figure 1: Ice mass anomaly of the Greenland ice sheet as measured by GRACE gravity satellites (Schrama et al 2011).
Another paper Zwally et al 2011 uses satellite altimetry to determine the thickness of the Greenland ice sheet. They calculate that over 2003 to 2007, the ice sheet was losing ice at a rate of 171 gigatonnes per year. They then compare this to radar and airborne altimetry data from the 1990s. From 1992 to 2002, Greenland was only losing 7 gigatonnes per year.
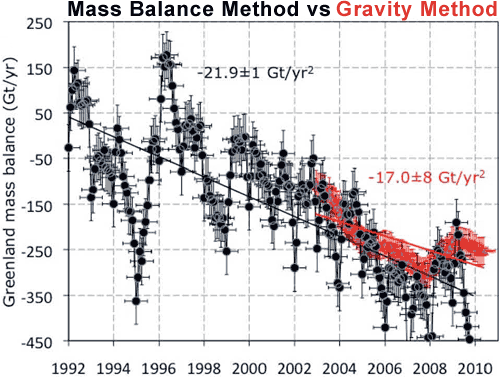
Lastly, Rignot 2011 uses the Mass Balance Method to construct a 19 year record of ice loss from Greenland. This involves calculating the amount of snowfall on the surface, the amount of ice mass lost to wind and melt and the amount of ice lost calculated from glacier velocity and ice thickness. Putting all these pieces together gives the total amount of ice lost or gained over the ice sheet.
Over this nearly two decade period, Rignot finds a clear signal of accelerating ice loss. He then compares his results from the Mass Balance Method to results from GRACE data. Both show consistent rates of mass loss. Just as significantly, both are accelerating at similar rates.

Figure 2: Total ice sheet mass balance in Greenland from the Mass Balance Method (black) and GRACE gravity measurements (red). The acceleration is given in gigatonnes per year squared (Rignot 2011).
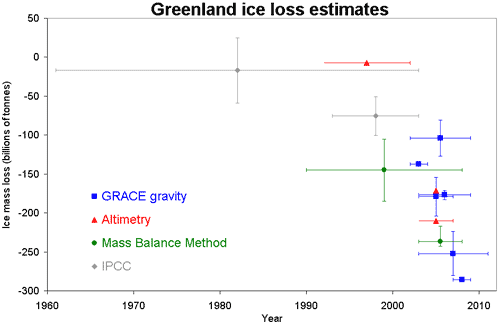
Out of curiosity, I thought I'd plot the results from all three papers on a single graph to see how the results compared. Each paper covers different time periods so I've indicated the time period (horizontal uncertainty bars) as well as the ice loss uncertainty (when provided). I also included a number of other estimates from recent papers (many thanks to Ernst Schrama for providing a handy summary - saved me some legwork) and Robert Way who pointed me to the IPCC estimates. It was especially interesting to see how the recent Wu et al 2010 estimate compares to the other estimates (it's the blue GRACE data point sitting like an outlier above all the other estimates). Thanks also to Bert Wouters and Ernst Schrama for their advice and feedback.

Figure 3: Various estimates of Greenland ice loss.
While there are a range of estimates on Greenland ice loss, independent lines of evidence all paint a similar picture - Greenland is losing hundreds of billions of tonnes of ice per year and the rate is increasing.
Posted by John Cook on Monday, 28 February, 2011
 |
The Skeptical Science website by Skeptical Science is licensed under a Creative Commons Attribution 3.0 Unported License. |