What The Science Says:
The BEST results confirm that the long-term global warming trend over land is approximately 0.3°C per decade, consistent with the other surface temperature datasets. Those who claim that BEST shows global warming has stopped are relying on a cherrypicking of short-term data, confusing noise with signal, and lying with statistics.
Climate Myth: BEST hides the decline in global temperature
"There is no scientific basis for saying that warming hasn’t stopped...This is “hide the decline” stuff. Our data show the pause, just as the other sets of data do. Muller is hiding the decline" (Judith Curry)
The Berkeley Earth Surface Temperature (BEST) results were entirely expected, consistent with the existing body of peer-reviewed science. We expected that the BEST results would be a minor footnote in climate science history - one more study affirming the accuracy of the surface temperature record, and that the "skeptics" would finally stop denying its accuracy, as they promised they would. After all, the study was privately funded, including by the anti-climate science Koch Brothers, and involved Richard Muller and Judith Curry, two scientists quite skeptical of the global warming theory.
Unfortunately, so many "skeptics" have devoted so much time and effort into disputing the accuracy of the surface temperature record that the BEST results seem to have short-circuited their collective brains. The schizophrenic "skeptic" reaction has been quite the spectacle to behold. First they attacked the BEST team for purely superficial reasons, including some rather appalling insults. But then they seemed to briefly accept the results, attempting to diminish their impact by claiming they had expected BEST to confirm global warming all along, and then doubling-down on other climate myths. Most recently, these same "skeptics" have attempted to argue that the BEST results show that global warming has stopped, and that their results are still biased high due to the urban heat island (UHI) effect.
Since the so-called "skeptics" decided to toss true skepticism aside and instead throw as many climate myths at the BEST results as they could think of to see what would stick, we had to devote many posts to debunking this myth mish mash. Below we summarize what we have learned from the BEST results.
The main (and entirely expected) conclusion we can draw from the BEST results is that although certain parties tried to hide the incline in global temperatures, global warming continues. Some "skeptics" have cherrypicked small portions of the BEST data in an attempt to argue that global warming has stopped. Dr. Richard Muller described these efforts quite accurately:
"what they have done is an old trick. It’s how to lie with statistics"
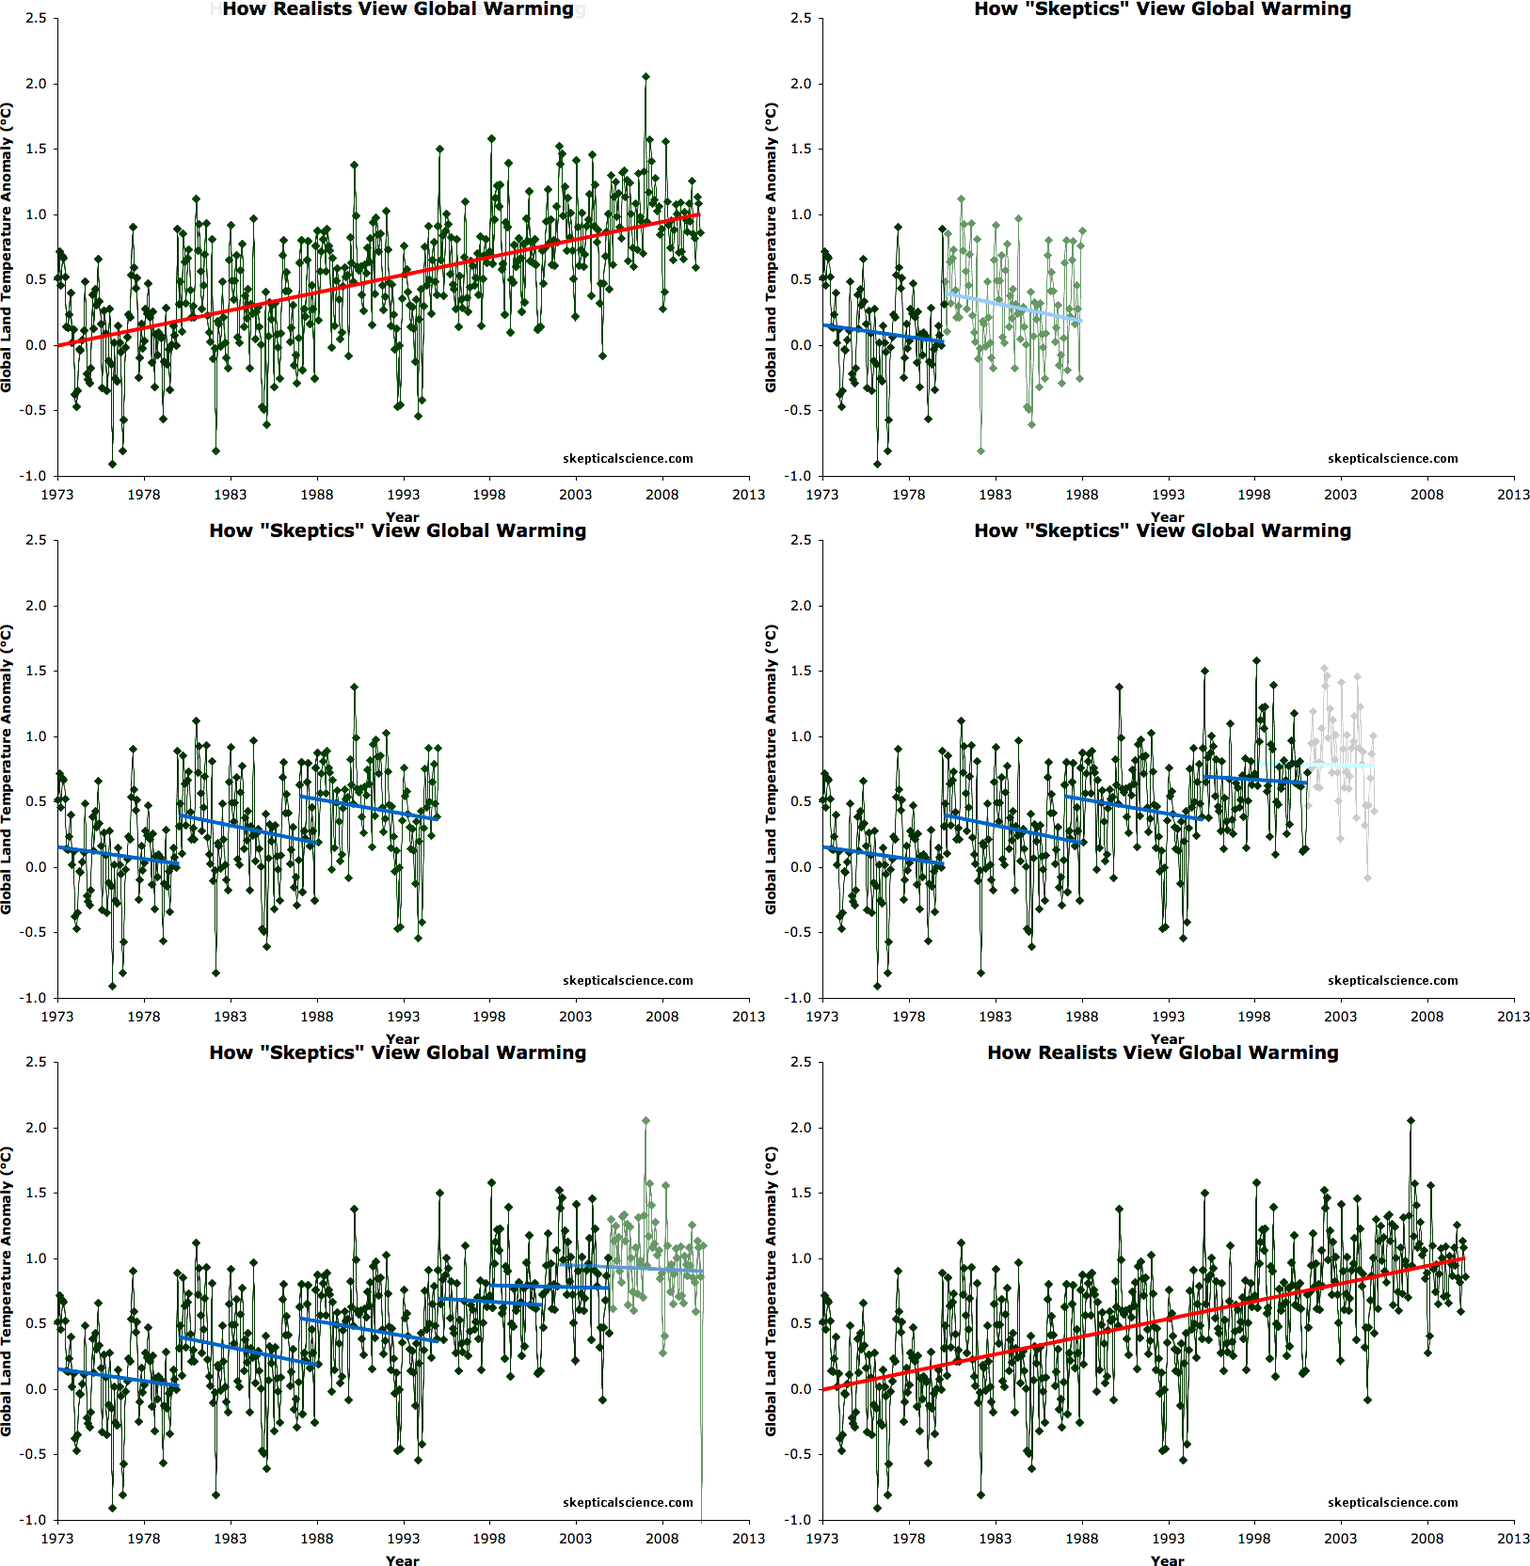
This statistical lie is illustrated in Figures 1 and 2.
Figure 1: BEST land-only surface temperature data (green) with linear trends applied to the timeframes 1973 to 1980, 1980 to 1988, 1988 to 1995, 1995 to 2001, 1998 to 2005, 2002 to 2010 (blue), and 1973 to 2010 (red). Hat-tip to Skeptical Science contributor Sphaerica for identifying all of these "cooling trends."
Figure 2: Entire BEST record vs. the recent cherrypicked portion used by "skeptics" to wrongly claim that global warming has stopped
The BEST results also confirmed the accuracy of the surface temperature record, with a warming rate (approximately 0.3°C per decade over recent decades) consistent with that estimated by NOAA and NASA GISS (Figure 3). The BEST results also confirmed that HadCRUT is biased low.
Figure 3: Comparison of land-only surface station and satellite temperature measurements (1981-2010 baseline). Annual data is plotted for BEST, NOAA, and HadCRU, while a 12-month running average is plotted for the GISS, UAH, and RSS.
The BEST results are also approximately consistent with the amount of land-only surface warming estimated by satellite data as analyzed by Fu et al., Vinnikov & Grody (V&G), and Zou et al. (2006) The UAH and RSS surface warming estimates are lower than these other groups, which suggests they may be biased low, and reveals that the satellite datasets are not the 'gold standard' the "skeptics" would have us believe they are. Figure 4 compares the various datasets, with the satellites 'upscaled' to reflect the fact that models project the lower troposphere warming rate above land should be approximately 5% lower than the surface land warming rate. The Fu and Zou trends are SkS estimates.
Figure 4: Comparison of various measurements of the land-only global surface temperature. The Fu, V&G, and Zou values are estimated by SkS, and the 0.95 amplification "upscaling" factor has been incorporated into the satellite trends to estimate the surface trend.
And much to the dismay of the "skeptics," BEST has confirmed once again that the UHI effect is not biasing the surface temperature measurements (Wickham et al. 2011):
"urban warming does not unduly bias estimates of recent global temperature change."
While the BEST results were entirely expected, we probably should not have been surprised by the inability of those who claim to be "skeptics," but who clearly are not, to accept their findings. Reactions to the BEST results (including logical fallacies, contradictions, cherrypicks, ad hominem attacks, and outright distortions) have certainly given us an insight into who the true skeptics are.
 |
The Skeptical Science website by Skeptical Science is licensed under a Creative Commons Attribution 3.0 Unported License. |