What The Science Says:
The 2007 IPCC report summary for policymakers explicitly discusses natural contributions to climate change in many different locations, but concludes that the natural contribution to recent climate change is small.
Climate Myth: IPCC edited out natural causes of climate change
"The long version of the IPCC report does mention natural causes of climate change, like the sun and oscillating ocean currents. But they no longer appear in the summary for politicians. They were simply edited out." (Fritz Vahrenholt)
The following quote are taken directly from the 2007 IPCC Fourth Assessment Report Summary for Policymakers (SPM). The first quote is the first sentence in the SPM.
* "The Working Group I contribution to the IPCC Fourth Assessment Report describes progress in understanding of the human and natural drivers of climate change, observed climate change, climate processes and attribution, and estimates of projected future climate change."
* "Human and Natural Drivers of Climate Change
Changes in the atmospheric abundance of greenhouse gases and aerosols, in solar radiation and in land surface properties alter the energy balance of the climate system. These changes are expressed in terms of radiative forcing, which is used to compare how a range of human and natural factors drive warming or cooling influences on global climate."
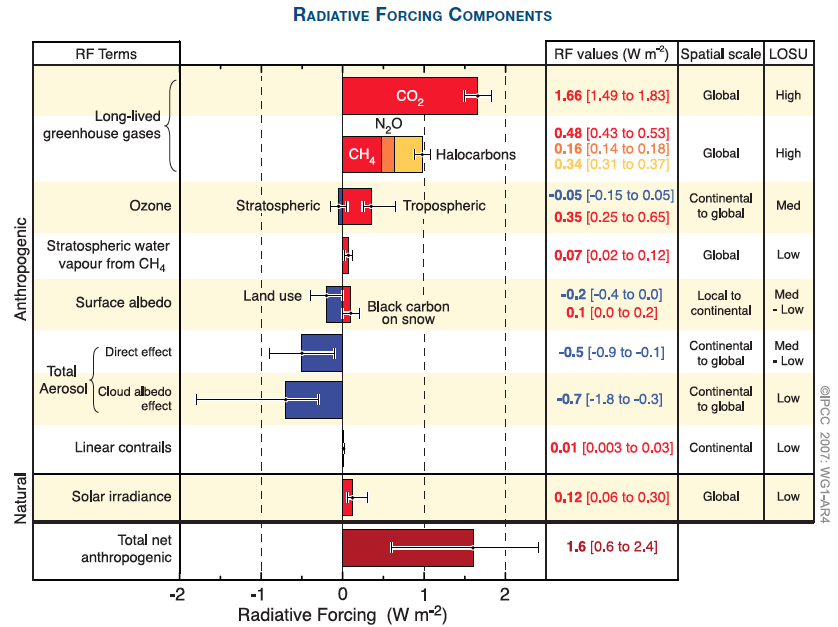
* "Changes in solar irradiance since 1750 are estimated to cause a radiative forcing of +0.12 [+0.06 to +0.30] W m–2, which is less than half the estimate given in the TAR."
* "It is very unlikely that climate changes of at least the seven centuries prior to 1950 were due to variability generated within the climate system alone. A significant fraction of the reconstructed Northern Hemisphere inter-decadal temperature variability over those centuries is very likely attributable to volcanic eruptions and changes in solar irradiance, and it is likely that anthropogenic forcing contributed to the early 20th century warming evident in these records."
* "The observed widespread warming of the atmosphere and ocean, together with ice mass loss, support the conclusion that it is extremely unlikely that global climate change of the past 50 years can be explained without external forcing, and very likely that it is not due to known natural causes alone."
There are more such examples. Then there's Figures SPM.2 and SPM.4:

Figure SPM.2: Global average radiative forcing (RF) estimates and ranges in 2005 for anthropogenic carbon dioxide (CO2 ), methane (CH4 ), nitrous oxide (N2O) and other important agents and mechanisms, together with the typical geographical extent (spatial scale) of the forcing and the assessed level of scientific understanding (LOSU). The net anthropogenic radiative forcing and its range are also shown. These require summing asymmetric uncertainty estimates from the component terms, and cannot be obtained by simple addition. Additional forcing factors not included here are considered to have a very low LOSU. Volcanic aerosols contribute an additional natural forcing but are not included in this figure due to their episodic nature. The range for linear contrails does not include other possible effects of aviation on cloudiness.
Figure SPM.4 - Comparison of observed continental- and global-scale changes in surface temperature with results simulated by climate models using natural and anthropogenic forcings. Decadal averages of observations are shown for the period 1906 to 2005 (black line) plotted against the centre of the decade and relative to the corresponding average for 1901–1950. Lines are dashed where spatial coverage is less than 50%. Blue shaded bands show the 5–95% range for 19 simulations from fi ve climate models using only the natural forcings due to solar activity and volcanoes. Red shaded bands show the 5–95% range for 58 simulations from 14 climate models using both natural and anthropogenic forcings.
Clearly the SPM explicitly discusses natural contributions to global warming, and explains that according to the body of scientific evidence, their contribution to the observed warming is small:
Net human and natural percent contributions to the observed global surface warming over the past 50-65 years according to Tett et al. 2000 (T00, dark blue), Meehl et al. 2004 (M04, red), Stone et al. 2007 (S07, green), Lean and Rind 2008 (LR08, purple), Huber and Knutti 2011 (HK11, light blue), and Gillett et al. 2012 (G12, orange). This has been added to the SkS Climate Graphics Page.
 |
The Skeptical Science website by Skeptical Science is licensed under a Creative Commons Attribution 3.0 Unported License. |