What ended the Little Ice Age?
What The Science Says:
The main driver of the warming from the Little Ice Age to 1940 was the warming sun with a small contribution from volcanic activity. However, solar activity leveled off after 1940 and the net influence from sun and volcano since 1940 has been slight cooling. Greenhouse gases have been the main contributor of warming since 1970.
Climate Myth: We're coming out of the Little Ice Age
"The global temperature has been rising at a steady trend rate of 0.5°C per century since the end of the little ice age in the 1700s (when the Thames River would freeze over every winter; the last time it froze over was 1804). On top of the trend are oscillations that last about thirty years in each direction. In 2009 we are where the green arrow points [on graph showing said oscillations- SkS], with temperature leveling off. The pattern suggests that the world has entered a period of slight cooling until about 2030." (David Evans)
The Little Ice Age was a cooler period spanning the 16th to the 19th century. The river Thames often froze over. The Norse colonies in Greenland were unable to survive the harsh winters. After 1850, temperatures began to rise. But man-made CO2 emissions in the late 19th century were a fraction of current levels. Did human activity take us out of the Little Ice Age? Were there other factors? And what does it mean for current warming? This question is addressed in an analysis which examines the various factors that drove climate since the 19th Century (Meehl 2004).
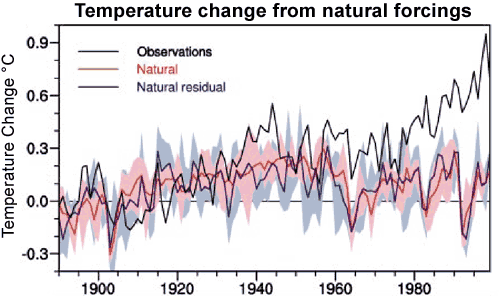
Climate simulations were run using two natural factors that drive climate - volcanoes and the sun. Volcanic eruptions cool global temperature for a few years after eruption. A drop in volcanic activity after 1915 contributed slight warming in the early 20th Century. However, the greater contributor to warming from 1880 came from the sun which steadily warmed up to the 1940s. When the two factors are combined, they account well for the warming from 1880 to 1940. However, the contribution from sun and volcanoes to global temperature since the 1940s has been a slight cooling effect.

Figure 1: Climate model results from natural forcings compared to observations (black line). The red line is the average of the four-member ensemble. The pink shading is the model range. The blue line is the ensemble mean and the light blue shading is the ensemble range.
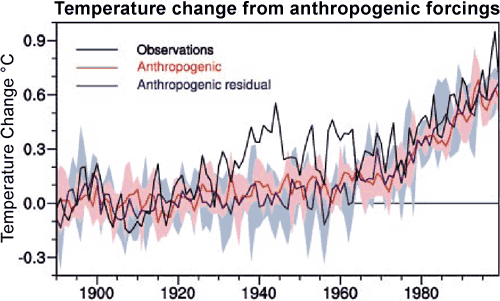
To calculate the human influence on climate, three forcings were considered: ozone, sulfate aerosols and man-made greenhouse gases. Sulfate aerosols have a cooling effect, growing stronger after around 1950. Changes in ozone produced a slight warming response. The strongest effect is from greenhouse gases which produced slow warming in the early 20th Century, then accelerated in the 1970s. When all anthropogenic forcings are combined, they show little temperature response from 1880 to to the 1960s. They do a poor job of explaining the warming from 1880 but a very good job of capturing late 20th Century warming.

Figure 2: Climate model results from anthropogenic forcings compared to observations (black line).
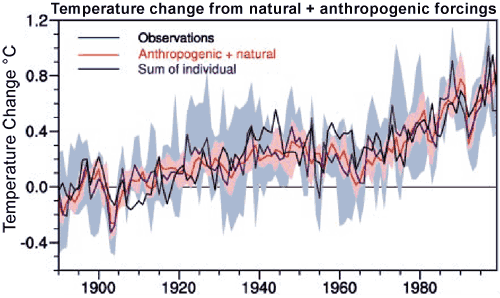
When natural and anthropogenic forcings are combined, they show close correspondance with global temperature. From this analysis, Meehl concludes that the warming from 1880 to the mid-20th Century was largely natural with the sun being the main contributor. Late 20th Century warming after 1970 is mainly due to man-made influence primarily from greenhouse gases.

Figure 3: Climate model results from natural + anthropogenic forcings compared to observations (black line).
This analysis is a useful reminder that CO2 is not the only driver of climate. To end the Little Ice Age, the sun did most of the early heavy lifting. When the solar contribution flattened out in the mid-20th century, humanity took the baton and we've been running with it ever since. Meehl 2004 is also confirmation that past climate change tells us how sensitive climate is to radiative forcing. The climate that responded to the forcing from the warming sun in the early 20th century is the same climate that is now responding to the forcing from rising greenhouse gases.
Intermediate rebuttal written by John Cook


