 Arguments
 Software
 Resources
Comments
 The Consensus Project
 Translations
 About
Support


Latest Posts
- Skeptical Science New Research for Week #47 2024
- Durability of carbon dioxide removal is critical for stabilizing temperatures
- Sabin 33 #3 - Solar panels generate too much waste and will overwhelm landfills
- Here’s how governments could fix their Paris climate commitment failures
- 2024 SkS Weekly Climate Change & Global Warming News Roundup #46
- Skeptical Science New Research for Week #46 2024
- 20 fact briefs published in collaboration with Gigafact!
- Sabin 33 #2 - Are toxic heavy metals from solar panels posing a threat to human health?
- 2024 will be the first year above 1.5°C
- 2024 SkS Weekly Climate Change & Global Warming News Roundup #45
- Fact brief - Is there an expert consensus on human-caused global warming?
- Skeptical Science New Research for Week #45 2024
- The planet is ‘on the brink of an irreversible climate disaster,’ scientists warn
- Sabin 33 #1 - Are electromagnetic fields from solar farms harmful to human health?
- Volunteer activity: Evaluate automated climate misinformation debunkings
- 2024 SkS Weekly Climate Change & Global Warming News Roundup #44
- Fact brief - Are most glaciers growing?
- Rebutting 33 False Claims About Solar, Wind, and Electric Vehicles thanks to the Sabin Center for Climate Change Law
- Skeptical Science New Research for Week #44 2024
- The hidden health toll of hurricanes
- Climate Adam: Is climate change fuelling mega hurricanes?
- Jobs in wind, solar, and energy storage are booming. Is your state keeping up?
- 2024 SkS Weekly Climate Change & Global Warming News Roundup #43
- Fact brief - Do volcanoes emit more CO2 than humans?
- Skeptical Science New Research for Week #43 2024
- Why widening highways doesn’t reduce traffic congestion
- Climate Risk
- Welcome to the world of personal air conditioning
- 2024 SkS Weekly Climate Change & Global Warming News Roundup #42
- Skeptical Science New Research for Week #42 2024
Archived Rebuttal
This is the archived Basic rebuttal to the climate myth "Mauna Loa is a volcano". Click here to view the latest rebuttal.
What the science says...
|
The measurements of the amount of CO2 made at the Mauna Loa Observatory are accurate and uncontaminated by any emissions from the volcano. The measurements show a steadily increasing tend of CO2 concentrations in the air, a trend that is confirmed |
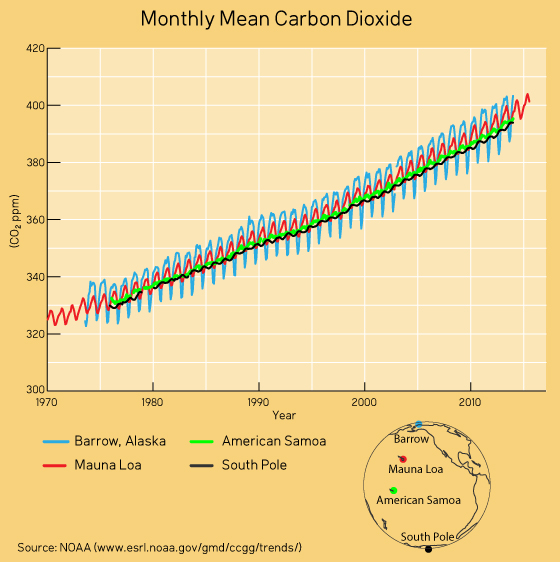
The observatory near the summit of the Mauna Loa volcano in Hawaii has been recording the amount of carbon dioxide in the air since 1958. This is the longest continuous record of direct measurements of CO2 and it shows a steadily increasing trend from year to year; combined with a saw-tooth effect that is caused by changes in the rate of plant growth through the seasons. This curve is commonly known as the Keeling Curve, named after Charles Keeling, the American scientist who started the project.
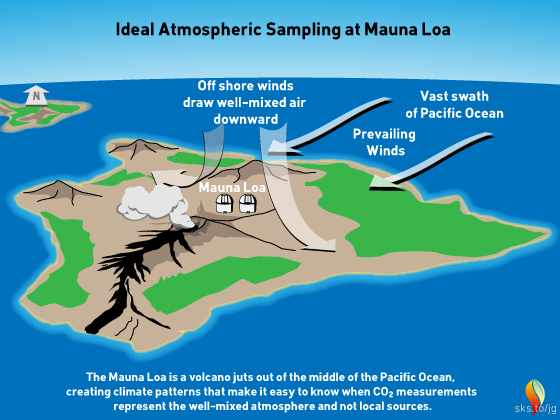
Why Mauna Loa? Early attempts to measure CO2 in the USA and Scandinavia found that the readings varied a lot due to the influence of growing plants and the exhaust from motors. Mauna Loa is ideal because it is so remote from big population centres. Also, on tropical islands at night, the prevailing winds blow from the land out to sea, which effect brings clean, well-mixed Central Pacific air from high in the atmosphere to the observatory. This removes any interference coming from the vegetation lower down on the island.
But how about gas from the volcano? It is true that volcanoes blow out CO2 from time to time and that this can interfere with the readings. Most of the time, though, the prevailing winds blow the volcanic gasses away from the observatory. But when the winds do sometimes blow from active vents towards the observatory, the influence from the volcano is obvious on the normally consistent records and any dubious readings can be easily spotted and edited out (Ryan, 1995).
(Illustration updated on 9/5/2015)
Importantly, Mauna Loa is not the only atmospheric measuring station in the world. As the graph from NOAA shows, other stations show the same year-after-year increasing trend. The seasonal saw-tooth varies from place to place, of course, but the background trend remains steadily upwards. The Keeling Curve is one of the best-defined results in climatology and there really are no valid scientific reasons for doubting it.
Further reading: Spencer Weart's The Discovery of Global Warming describes Charles Keeling's research efforts in more detail. Weart also has a separate article on Keeling's struggle to fund his research.
Updated on 2015-09-06 by Andy Skuce.
THE ESCALATOR

(free to republish)


