A peer-reviewed response to McLean's El Nino paper
Posted on 18 March 2010 by John Cook
A paper published mid-2009 claimed a link between global warming and the El Nino Southern Oscillation (ENSO) (McLean et al 2009). According to one of its authors, Bob Carter, the paper found that the "close relationship between ENSO and global temperature, as described in the paper, leaves little room for any warming driven by human carbon dioxide emissions". This result is in strong contrast with two decades of peer-reviewed research which find ENSO has little influence on long-term trends. Why the discrepancy? A response has now been accepted for publication in the Journal of Geophysical Research (Foster et al 2010) explaining why McLean 2009 differs from the body of peer-reviewed research.
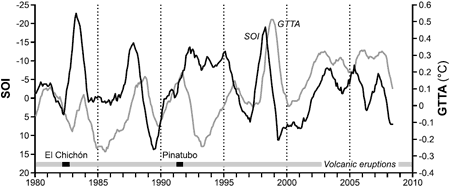
First, let's examine how McLean et al arrived at their conclusion. They compared both weather balloon (RATPAC) and satellite (UAH) measurements of tropospheric temperature to El Niño activity (SOI). To remove short-term noise, they plotted a 12 month running average of Global Tropospheric Temperature Anomaly (GTTA, the light grey line) and the Southern Oscillation Index (SOI, the black line).

Figure 1: Twelve-month running means of SOI (dark line) and MSU GTTA (light line) for the period 1980 to 2006 with major periods of volcanic activity indicated (McLean 2009).
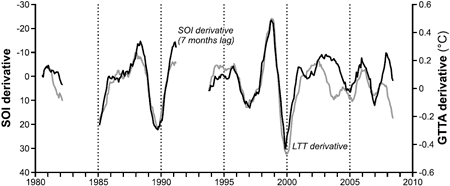
The Southern Oscillation Index shows no long term trend while the temperature record shows a long-term warming trend. Consequently, McLean et al found only a weak correlation between temperature and SOI. Next, they applied another filter to the data by subtracting the 12 month running average from the same average 1 year later. The comparison between the filtered data for El Nino and Temperature are as follows:

Figure 2: Derivatives of SOI (dark line) and MSU GTTA (light line) for the period 1981–2007 after removing periods of volcanic influence (McLean 2009).
From this close correlation, McLean et al argued that more than two thirds of interseasonal and long-term variability in temperature changes can be explained by the Southern Oscillation Index. This result contradicts virtually every other study into the connection between ENSO and temperature variability, particularly with regard to long-term warming trends. Past analyses have found ENSO was responsible for 15 to 30% of interseasonal variability but little of the global warming trend over the past half century (Jones 1989, Wigley 2000, Santer 2001, Trenberth 2002, Thompson 2008). Why does McLean come to a different result? This question is examined in Comment on "Influence of the Southern Oscillation on tropospheric temperature" by J. D. McLean, C. R. de Freitas, and R. M. Carter (Foster et al 2010).
Foster et al examine the filtering process that McLean et al applied to the temperature and ENSO data. This filtering has two steps - they take 12-month moving averages then take the differences between those values which are 12 months apart. The first step filters the high-frequency variation from the time series while the second step filters low-frequency variation. The problem with the latter step is it removes any long-term trends from the original temperature data. The long-term warming trend in the temperature record is where the disagreement between temperature and ENSO is greatest.
Why do McLean et al remove the long-term trend? They justify it by noting a lack of correlation between SOI and GTTA, speculating that the derivative filter might remove noise caused by volcanoes or wind. However, taking the derivative of a time series does not remove, or even reduce, short-term noise. It has the opposite effect, amplifying the noise while removing longer-term changes.
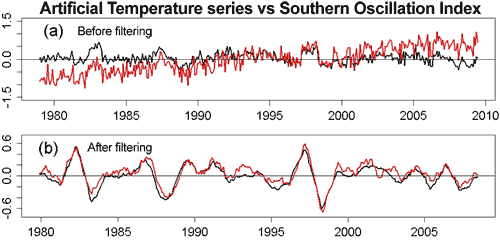
To further illustrate how the filtering process increases the correlation between SOI and temperature, the authors construct an artificial "temperature" time series as -0.02 times the SOI time series. They then add white noise and a linear trend. This has the effect of creating a temperature time series with a long term warming trend. The correlation between the raw artificial temperature series and the SOI series is very low (R2 = 0.0161). However, when the McLean et al filters are applied to both time series, the correlation is now very high (R2 = 0.8295). This is because the filtering removes low frequency elements such as the long term warming trend.

Figure 3: (a) Southern Oscillation Index (SOI) data (black) versus artificial data proportional to the SOI, and with normally-distributed white noise and a sinusoidal signal added (red). (b): Filtered versions (using the McLean et al procedure) of the series in (a).
Despite the extreme distorting effect of their filter, McLean et al consistently refer to the correlations as between SOI and tropospheric temperature. They draw no attention to the fact that the correlations are between heavily filtered time series. This failure causes what is essentially a mistaken result to be misinterpreted as a direct relationship between important climate variables.
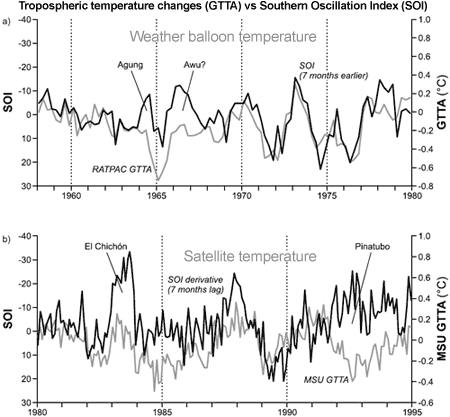
Another interesting feature of McLean et al 2009 is a plot of unfiltered temperature data (GTTA) against the Southern Oscillation Index (SOI) to illustrate the quality of the match between them. However the temperature signal is a splice of weather balloon data (RATPAC-A) to the end of 1979 followed by satellite data (UAH TLT) since 1980. RATPAC-A data show a pronounced warming trend from 1960 to 2008 with the temperature line rising away from the SOI line. This warming trend is obscured by substituting the weather balloon data with satellite data after 1980. It is especially misleading because the mean values of RATPAC-A and UAH TLT data during their period of overlap differ by nearly 0.2 K. Splicing them together introduces an artificial 0.2-degree temperature drop at the boundary between the two. Unfortunately, the splicing is obscured by the fact that the graph is split into different panels precisely at the splicing boundary. This splicing + graph splitting technique is an effective way to "hide the incline" of the warming trend.

Figure 4: Seven-month shifted SOI with (a) weather balloon RATPAC-A temperature data 1958–1979 and satellite UAH temperature data (b) 1980–1995. Dark line indicates SOI and light line indicates lower tropospheric temperature. Periods of volcanic activity are indicated.
It has been well known for many years that ENSO is associated with significant variability in global temperatures on short timescales of several years. However, this relationship cannot explain temperature trends on decadal and longer time scales. McLean et al 2009 grossly overstates the influence of ENSO, primarily by filtering out any long-term trends.


 Arguments


If you look carefully, you'll find that the top box uses RATPAC weather balloon data while the bottom box uses satellite MSU data. Eg - it's not one continuous datasets but two data sets spliced together. Most importantly, the mean values of RATPAC-A and UAH TLT data during their period of overlap differ by nearly 0.2 K. Splicing them together introduces an artificial 0.2-degree temperature drop at the boundary between the two.
The most curious feature of this graph is that the graph is split into different panels precisely at the splicing boundary. This obscures the difference between the weather balloon dataset and the satellite dataset. It's a misleading way to display a graph and yet is obviously effective in persuading people into thinking that the long term trend in ENSO correlates closely with the long term warming trend.
For the record, I don't hide my name nor does Stephen Lewandowsky. However, the people who really matter are the authors of Foster et al 2010 who are all named.