Climate Science Glossary

Term Lookup

Enter a term in the search box to find its definition.

Settings

Use the controls in the far right panel to increase or decrease the number of terms automatically displayed (or to completely turn that feature off).

Term Lookup

Settings


All IPCC definitions taken from Climate Change 2007: The Physical Science Basis. Working Group I Contribution to the Fourth Assessment Report of the Intergovernmental Panel on Climate Change, Annex I, Glossary, pp. 941-954. Cambridge University Press.

Home Arguments Software Resources Comments The Consensus Project Translations About Support

Bluesky Facebook LinkedIn Mastodon MeWe

Twitter YouTube RSS Posts RSS Comments Email Subscribe


Climate's changed before
It's the sun
It's not bad
There is no consensus
It's cooling
Models are unreliable
Temp record is unreliable
Animals and plants can adapt
It hasn't warmed since 1998
Antarctica is gaining ice
View All Arguments...


Username
Password
New? Register here
Forgot your password?

Latest Posts

Archives

Watts Up With That concludes Greenland is not melting without looking at any actual ice mass data

Posted on 13 July 2010 by John Cook

To properly understand what's happening with our climate, it's imperative we consider the full body of evidence. Unfortunately, much confusion is sowed by those who cherrypick select pieces of data while neglecting the full picture. A good example is a blog post at Watts Up With That by Steve Goddard, titled Greenland Hype Meltdown. Goddard characterises the reports that Greenland is losing ice as a "continuous stream of gross misinformation". Curiously, he provides no actual data on Greenland's ice mass to expose this gross misinformation. Instead, he cites temperature from a single weather station and some photos he took while flying over the ice sheet.

Let's look at actual measurements of what's happening to the Greenland ice sheet. The change in ice mass has been measured using a variety of methods. Satellites use radar interferometry to measure the speed of the glaciers as they slide into the ocean. What they find is the glaciers have been sliding faster downhill and dumping more ice into the ocean. Satellite radar altimetry and airborne laser altimetry have also been used to measure the thickness of the ice sheets - they both find the ice sheet is thinning.

GPS receivers have been placed at selected locations around Greenland to measure how much the bedrock is lifting in response to thinning ice sheets. These find the land is now rising up at an accelerating rate. An overall picture is obtained by satellites measuring the change in gravity around the ice sheet. As the ice sheet loses mass, the gravity around Greenland changes, as measured by the GRACE satellites. These measurements find accelerating ice loss.

Net accumulation and loss of ice mass from Greenland are calculated using measurements of precipitation, snow accumulation and the discharge of glaciers into the ocean. The net accumulation/loss measurements find the same rate of ice loss as the GRACE gravity data. When all these independent lines of evidence are compared, we find a consistent picture of accelerating ice loss over the last decade and a half.
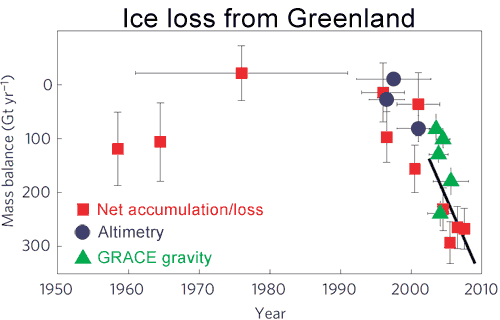
Greenland ice loss  measured by net accumulation/loss, altimetry and  GRACE gravity  observations
Figure 1:  Rate of ice loss from Greenland. Vertical lines indicate uncertainty, horizontal lines indicate averaging time. Blue circles are from altimetry, red squares are from net accumulation/loss and green triangles are from GRACE. The black line is a straight-line (constant acceleration) fit through the mass balance data for the period 1996–2008 with a slope of 21 gigatonnes/yr2 (Jiang 2010).

Is there any evidence that this ice loss has stopped recently? The latest gravity data, released just over a month ago, shows continued accelerating ice loss from the Greenland ice sheet. This is because ice loss has spread from southern Greenland to the northwest, confirmed by gravity measurements and GPS data. Currently, Greenland is losing ice mass at a rate of around 286 billion tonnes per year.
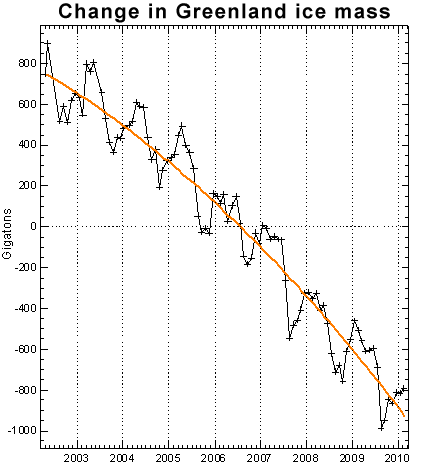
Change in Greenland ice mass, 2002 to 2010
Figure 2: Greenland ice mass anomaly (black). Orange line is quadratic fit (John Wahr).

The full body of evidence gives us a variety of direct measurements, using independent techniques, all arriving at the same answer. When Naomi Oreskes refered to "multiple, independent lines of evidence converging on a single coherent account", she may as well have been talking about Greenland ice loss.

Steve Goddard is correct when he says there's a "continuous stream of gross misinformation" about Greenland ice loss but it's not coming from the peer-reviewed research which paints a remarkably consistent picture. Instead, the misinformation comes from those who ignore the full body of evidence and cherrypick bits and pieces to paint a misleading picture.

0 0

Printable Version  |  Link to this page

Comments

Prev  1  2  

Comments 51 to 65 out of 65:

  1. Chris #40 BP#47 Er....not really Chris. Just describe the mechanism for getting heat from the surface to the deep oceans in a couple or three yearly timeframe. As I have suggested elsewhere, measurement of OHC changes needs a baseline viz. a snapshot of the 'tiled' oceans. The 'ideal' system would be a global array of tethered buoys measuring the same 'tile' at the same time. A tile might be 500m deep by 1 degree square to have enough resolution. The gold standard would be a snapshot of temperatures of each tile at time T1 and another snapshot at T2. A summation of each would give accurate changes in OHC. The Argo buoys are at present about 3500 in number covering on average a square of ocean 330km x 330km (about 3.3 degrees square) down to 2000m. The average ocean depth is 3700m. Not all the Argo buoys are measuring down to 2000m. How close the drifting Argo come to the 'ideal' is hard to determine. For sure, strong currents will tend to coagulate drifting buoys so that the same 'tile' of ocean might might not be measured at time T2 as was measured at T1. Two or more buoys might enter a tile of ocean and leave none where a prior measurement was taken. Now this might even itself out with some sort of statistical correction, but currents moving at 3-4 knots would move buoys and water out of a tile in a matter of hours, so it would seem a difficult problem to correct back to the 'ideal' measurement system of tethered buoys. Those more expert that I might explain how this is done. I suspect that the noisy and inconsistent nature of OHC reconstructions is due to this problem.
    0 0
  2. MS #49 & Chris Michael, BP can probably defend himself, but I think you are right on this point, along with Chris. The temperature drop from surface to bottom of roughly 20 degC is not taken account in BP's argument. And Chris, just remember that each of BP's arguments stands on its merits. We all get it wrong on occasion, don't we Chris? That does not mean BP's Von Schukmann analysis is wrong.
    0 0
  3. #49 michael sweet at 09:43 AM on 15 July, 2010 Since deep water is colder then surface water, the graph you copied with constant temperature is not relevant to the discussion. It is not quite so. Volumetric thermal expansion coefficient as a function of depth with an approximate global average temperature profile looks like this: This is the temperature profile used (it is 3°C below 2000 m): The curve above has a minimum around 1000 m. You can only decrease sea level by a simple redistribution of heat if it does not go too deep. On the other hand we know (e.g. from 14C) almost all the water at intermediate levels is several thousand years old (the time since it has seen surface). It is also the case the deeper you go the less water is in a specific layer. On top of that specific heat of water decreases slightly with increasing pressure. It is not easy to find a realistic heat redistribution pattern that does not increase sea level while sucking in more heat from above. But global ocean is not a very good thermometer, that much is true.
    0 0
  4. #6: there's one other source of extra water in the oceans worth mentioning: emptying of underground reservoirs. As I, somewhat unreliably, remember it it's a measurable contribution but not huge." There is another source of extra water in the oceans,which is the origin of most of the world's oceans- when magmas in the earths crust cool, they expel water. The Mid Ocean Rifts are several times the length of the earth's circumferance, and cooling, rising magmas expel water all along these locations. Water is also extracted from oceans in subduction zones by descending crust. The overall balance is thought to be neutral, but it may not always be, especially during violent volcanic periods.
    0 0
  5. On the other hand, the average ocean depth is only about 3700 m. According to: Kohl A, Stammer D: Decadal sea level changes in the 50-Year GECCO ocean synthesis. J Clim 2008, 21:1876-1890. the energy in the deep ocean has only penetrated to the 3000 meter level so far. When I eyeball your graph it seems to me that the average of 0-700m compared to the average of 700-3000 is not that far from what Trenberth stated in Chris's reference in #33. It is difficult to decide the best way to average the values. Why don't we just use Trenberth's numbers, since he has probably spent a lot of effort checking it? Personally, I value a number from a peer reviewed paper more than one that I see in an on-line blog. The authors put in a lot of time writing and reviewing the published calculation and it is not possible for bloggers to match that effort. If an error can be clearly shown that is one thing, but just offering a calculation or a graph and saying the paper is wrong is not convincing to me. If Trenberth is wrong, cite a paper that points out the correct answer.
    0 0
  6. "here is another source of extra water in the oceans,which is the origin of most of the world's oceans-" Actually this is controversial. Getting our oceans (or even most of our oceans) by outgassing alone is a very tough proposition. "The overall balance is thought to be neutral, but it may not always be, especially during violent volcanic periods. " So Mt St Helens - 0.0032Gt. Himalayan glaciers 47Gt per year. I'm guessing you could make a case for around 3Gt/yr of volcanic outgassing but very difficult to make an estimate for water lost in sedimentary basins and subduction zones. I dont think this water source is material to the debate.
    0 0
  7. Berényi Péter at 06:32 AM on 16 July, 2010 This really belongs on an Ocean thread, but there is some very recent work in this area from Kawano 2010. A basic conclusion is that there is an extra 5% of the total Pacific Ocean heat content below 3000m. Decadal heat content change in each 100m layer of Pacific from measurements from repeat hydrographic surveys. On the idea that overturning rates and hypothesised lack of vertical mixing to deep layers means it take centuries to change bottom water temperatures, there is a significant amount of measured evidence that suggests otherwise. This is worth a post at some point. It is fair to say vertical mixing processes are not fully understood, but numerous plausible mechanisms and some corroborating evidence have been put forward, and simulations are only now getting to the point of replicating some of the observations. Another very recent contribution is Masuda 2010, which shows it is possible to simulate a fast (40 years lag) mechanism that links surface air heat flux off Antarctica with bottom warming in the North Pacific.
    0 0
  8. Peter Hogarth #56 So are we now seeing bottom warming in the Pacific from heat flux off Antarctica which happened in 1970? 1970 is the era when we were going to have the next ice age and CO2GHG warming had not been pressing. What are we to conclude from that Peter? For sure it does not explain the roughly 0.4 W/sq.m (average 65E20 Joules/year) of unaccounted heat from Dr Trenberth's budget shortfall over the 2004-08 period. Any experts on Argo analyses able to comment on my speculator in Post #49 ?
    0 0
  9. KL #57 = OOps Post#50.
    0 0
  10. Ken, Unless you have new information (i.e. new peer reviewed studies which support your position), your argument (putting all of your eggs in one basket more like) is still not valid. This is because the one thing we can be sure of about the heat balance measurements are that significant components are insufficiently precise over short durations to measure small changes with sufficient accuracy to draw strong conclusions.
    0 0
  11. Ken Lambert wrote : 1970 is the era when we were going to have the next ice age and CO2GHG warming had not been pressing. Not true, and you've been on this site long enough to know. Selective memory ? "1970s ice age predictions were predominantly media based. The majority of peer reviewed research at the time predicted warming due to increasing CO2." Or were you trying to refer to a specific event in the year 1970 ?
    0 0
  12. Peter, Your posts always raise the level of discussion. Thank you for informing the rest of us. Is the decrease in heat in the first 100 meters from a La Nina? (I cannot penetrate the paywall). I would have thought surface heat content would have risen since ocean surface temperatures are currently so high. It is amazing how rapidly the science is advancing. The paper I cited as saying heat had not passed 3000 meters is only two years old. OHC is a difficult problem. Hopefully the scientists working on it will continue to rapidly advance the state of knowledge. Are you the Peter Hogarth who studies sea grass?
    0 0
  13. michael sweet at 08:06 AM on 17 July, 2010 The upper 200m or so are strongly affected by seasonal changes, (the upper 100m particularly so), and remember this is a study based on repeat hydrographic sections rather than continuous monitoring that would allow averaging over annual periods. As we go deeper the Ocean effectively does this averaging for us.
    0 0
  14. #56 Peter Hogarth at 18:59 PM on 16 July, 2010 On the idea that overturning rates and hypothesised lack of vertical mixing to deep layers means it take centuries to change bottom water temperatures, there is a significant amount of measured evidence that suggests otherwise. That's good news. At least we don't have to worry over ocean acidification. However, even if heat (and dissolved carbon dioxide) have an easy way to the abyss, it does not solve the problem at hand. If the bulk of Trenberth's missing heat went that deep, it would have produced more steric sea level rise than observed, as 1. for layers of equal thickness the deeper you go the less mass you have due to bathymetric constraints 2. volumetric thermal expansion coefficient of seawater increases with pressure The most likely solution is the missing heat simply went to the coldest and largest heat reservoir around, to outer space at a temperature of -270.425°C (-454.765ºF). That is, it was not trapped at all.
    0 0
  15. Berényi Péter at 20:43 PM on 26 July, 2010 Please read the papers rather than jumping in. They cover both your points. Your solution is not most likely. The "missing" heat is not really missing as such but less than the current estimates of uncertainty in factors like TOA radiation. The deep ocean estimates reduce that uncertainty, but as the estimates vary between 5 and up to 20% on recent work we have a way to go before uncertainty is reduced to the point of unambiguous budget balance. In terms of the 0.4W/m2 "missing" I have seen quoted on this thread I note from Palmer 2010 that the interannual variability in net radiation has been estimated as ± 0.7 W m-2 from Wong 2006 whilst Lyman and Johnson 2008 estimated the 2006 Argo coverage in situ sampling uncertainty for the 0-700m layer is approximately ± 0.4 Wm-2 over multi-year time scales at the 95% level, whilst Lyman 2010 slightly increases the estimate of Ocean heating to 0.64 ± 0.11 Wm-2 over the 16 year record at 90% confidence level, and Kawano 2010 may add 5 to 7 % to this. As uncertainties are reduced and estimates revised, we would expect any gaps in error budgets to close. I will be looking at a post on Deep Ocean Heat Content (it will take some time to review the papers). I will also look at any more recent work on net radiation and uncertainties here (I am aware of a few very recent papers).
    0 0

Prev  1  2  

You need to be logged in to post a comment. Login via the left margin or if you're new, register here.


The Consensus Project Website

THE ESCALATOR

(free to republish)


© Copyright 2024 John Cook
Home | Translations | About Us | Privacy | Contact Us