Climate Science Glossary

Term Lookup

Enter a term in the search box to find its definition.

Settings

Use the controls in the far right panel to increase or decrease the number of terms automatically displayed (or to completely turn that feature off).

Term Lookup

Settings


All IPCC definitions taken from Climate Change 2007: The Physical Science Basis. Working Group I Contribution to the Fourth Assessment Report of the Intergovernmental Panel on Climate Change, Annex I, Glossary, pp. 941-954. Cambridge University Press.

Home Arguments Software Resources Comments The Consensus Project Translations About Support

Bluesky Facebook LinkedIn Mastodon MeWe

Twitter YouTube RSS Posts RSS Comments Email Subscribe


Climate's changed before
It's the sun
It's not bad
There is no consensus
It's cooling
Models are unreliable
Temp record is unreliable
Animals and plants can adapt
It hasn't warmed since 1998
Antarctica is gaining ice
View All Arguments...


Username
Password
New? Register here
Forgot your password?

Latest Posts

Archives

NASA scientists expect more rapid global warming in the very near future (part 2)

Posted on 5 February 2012 by Rob Painting

In part 1 we saw that NASA scientists James Hansen, Reto Ruedy, Makiko Sato and Kwok-Wai Ken Lo from the Goddard Institute for Space Studies (GISS) have released an analysis of global temperature in 2011, and looked at future prospects. Reviewing the evidence, the authors concluded that rapid global warming is likely in the next few years. This is not a new phenomenon, but simply a reflection of natural variability, cool (La Niña) and warm (El Niño) phases which still exert a temporary cooling/warming influence on global surface temperatures even in the presence of a persistent global warming trend. 

In part 2 we'll see that seasonal extreme warm anomalies in 2009-2011 are well above the 1951-1980 base period typically used in GISTEMP analyses - indicative of global warming's role in heatwaves. That measuring of manmade aerosols (pollution particles that reflect sunlight) is still highly problematic, and significantly, that the current warming phase of the 11-year solar cycle is likely to have a noticable warming effect on the climate over the next 3-5 years. 
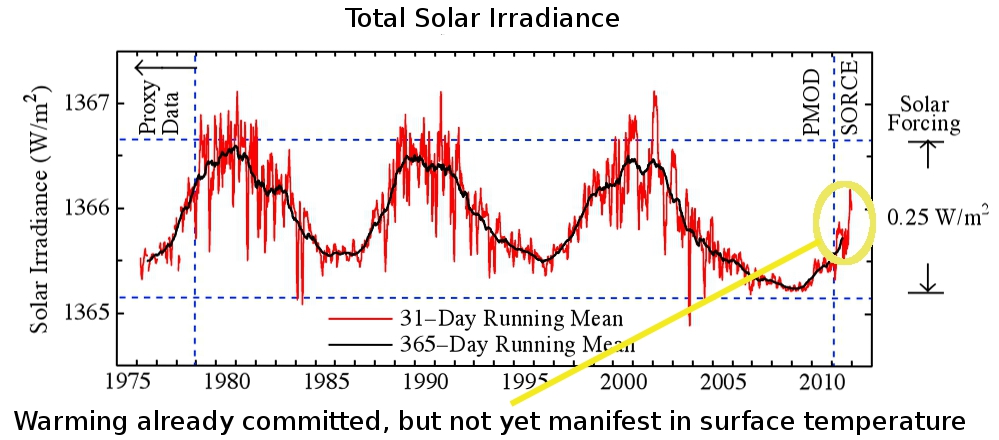
Figure 1 -Solar irradiance from composite satellite-based time series. Data sources: For 1976/01/05 to 2011/02/02 Physikalisch Meteorologisches Observatorium Davos, World Radiation Center and for 2011/02/03 to 2012/01/11 University of Colorado Solar Radiation & Climate Experiment. The circled area is (roughly) the solar energy already absorbed by the ocean and yet to manifest itself in global temperatures i.e - warming already committed. 

Damn statistics

As detailed in the SkS post on the freak 2010 Moscow heatwave, global temperatures follow what is called a Gaussian or normal distribution. That is, if you plot temperature along two axes their frequency or density (vertical axis) and how far these temperature measurements deviate from the mean or average (horizontal axis), will tend to be clustered around the mean. These observations or values resemble a bell-shaped curve. See figure 2.  
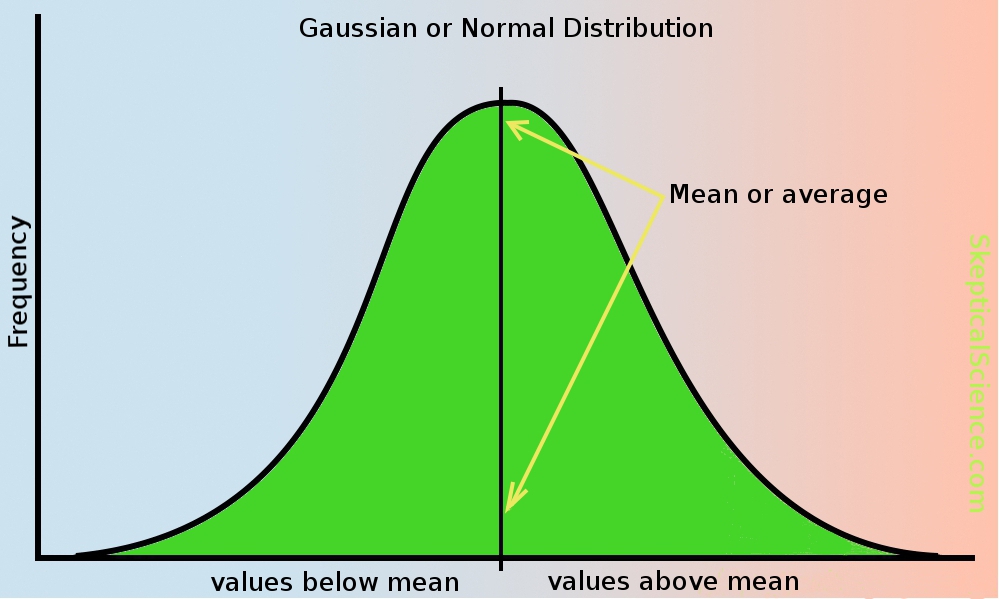
Figure 2 - illustration of a Normal/Gaussian distribution

Not all climate-related phenomena follow this Gaussian distribution, but a number of studies show that surface temperatures do. Intuitively this makes sense, because although surface temperatures can exhibit large swings from time to time they generally don't deviate much from the average throughout the year.

Because of the shape of this distribution, one can mathematically determine the spread of the values. This is known as the 68-95-99.7, three-sigma, or empirical rule, where the percentage of a particluar value declines as one moves further away from the mean. 68.2% of all values are within one standard deviation of the mean, 95.4% within two standard deviations, and 99.7% within 3 standard deviations. See figure 3, and note the greek symbol is sigma representing a standard deviation.
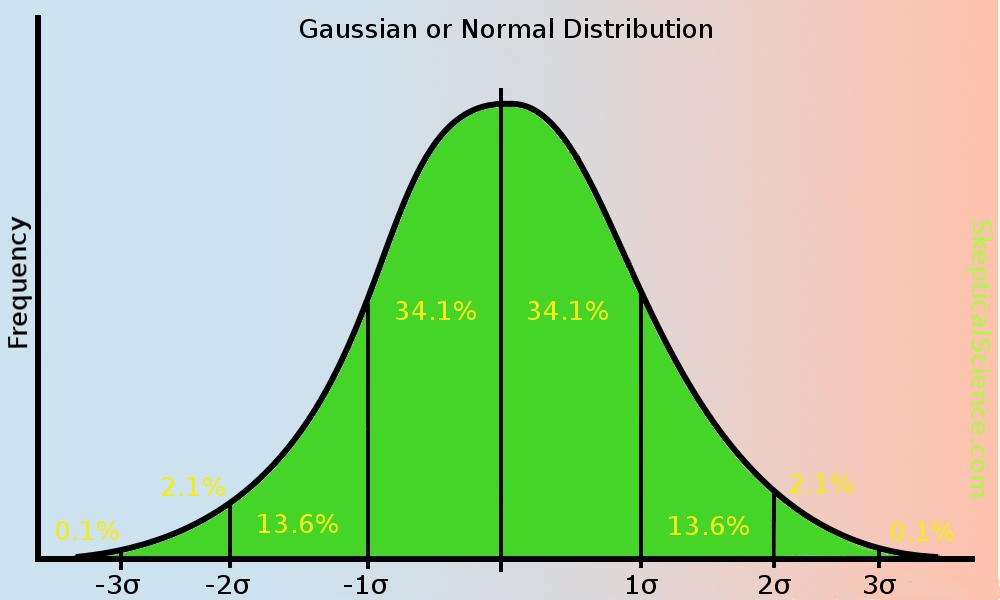
Figure 3 - Gaussian distribution with standard deviations.

With a warming climate the mean temperature begins to slowly climb too, so the bell-shaped curve creeps to the right in the warming direction (figure 4). As it does so, you can see how it affects the measurements at the extremes - warm extreme temperatures become more common place, and cold extremes less common. A shifting mean (as in warming global temperatures) leads to large changes at the extremes.  

Fig 4 - illustration of gaussian distribution with a shifting mean.

Seasonal mean temperature anomalies

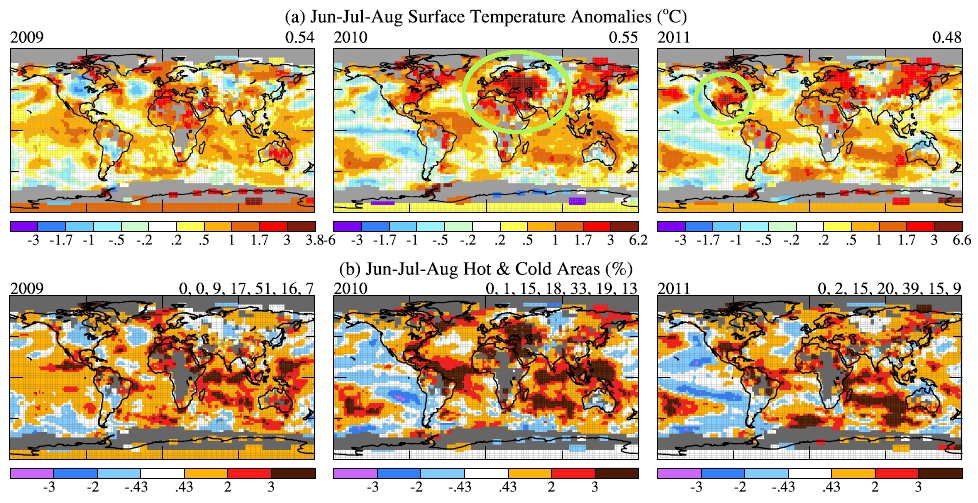
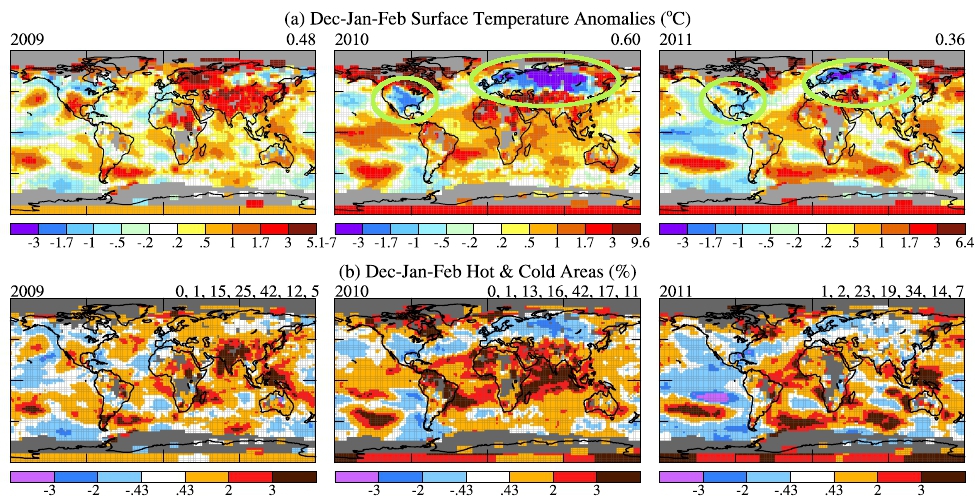
The authors look at the seasonal anomalies for both June-August (figure 5), the Northern Hemisphere summer, and December-February (figure 6), the Northern Hemisphere winter, for not only 2011, but 2009 and 2010 also. These anomalies (changes from a baseline temperature) are compared to the base period of 1951-1980 in the GISTEMP temperature series - which is the typical base period for GISS.

They compare the surface temperature anomalies in two ways, firstly by plotting the anomalies in °C (figures 5a and 6a), and secondly by plotting them in units of the standard deviation (5b and 6b).

Figure 5 - June-August surface temperature anomalies in 2009-2011 in units of °C (a), and in units of the local standard deviation of local seasonal-mean temperature (b). 

In 2010 the monster summer Moscow heatwave is readily visible (circled), as is the summer heatwave covering Texas, Oklahoma and Northern Mexico in 2011 (also circled). Looking at the global temperature in the form of standard deviations is very revealing. Those dark brown areas in 5(b) are 3 standard deviations (3 sigma) or larger (refer figure 3) - very rare extremely warm episodes. These June-to-August extreme warm events in the base period (1951-1980) were a few tenths of one percent, however by 2009 they rose to 7%, 13% in 2010 and 9% in 2011.

This greater-than-tenfold increase in the warm extremes led the authors to state:

"Increased occurrence of such extreme anomalies as a result of global warming, by more than a factor of 10, implies that we can attribute such recent extreme anomalies, including that in Texas and Oklahoma, to global warming"  

To appreciate this one only has to look at figure 4, where the slowly shifting mean (global warming) causes a dramatic increase in extreme warm events (heatwaves).  

Figure 6. December-February surface temperature anomalies 2009-2011 in units of °C (a), and in units of the local standard deviation of local seasonal-mean temperature(b).

For December-February, the cold winters in the USA and Europe in 2010 and 2011 are very evident in figure 6a (°C anomalies), however once again looking at them in the form of standard deviations gives a better indication of the overall picture. The great majority of these cold events were only minus 1 standard deviation (-1 sigma) away from the mean (light blue). 2010 & 2011 were cold in these regions even by 1951-1980 standards (the baseline), but because they mostly fall within minus one standard deviation (see figure 3), it was a level of cold that occurred reasonably often back then.

Temperature extremes over these years is basically in line with what is expected under global warming - an increase in extremely warm episodes and a decline in extremely cold ones. Indeed looking at the 3 years (2009-2011) only one small region of the tropical ocean in 2011 exceeds minus three standard deviations (-3 sigma), whereas warm extremes (+3 standard deviations) occur with regularity in each year.

The Arctic Oscillation

The Arctic Oscillation (AO) Index is a record summarizing the state of the Arctic weather. Winds that circle the Arctic keep the cold bottled up there, rather like a closed fridge door. When these winds weaken the potential exists for cold Arctic air to escape and get pushed further south. This is simlar to leaving the fridge door open - the cold air escapes.

The AO has no predictive power, as stated earlier it is just a record of the weather there. But looking at the AO index is revealing in that it demonstrates both the long-term trend and just how extreme the 2009-2010 and 2010-2011 Arctic weather was. The long-term trend (Figure 7) has been one of a more positive AO (stronger zonal winds around the Arctic), which indicates less likelihood of cold outbreaks, but the two winters in question were extreme departures from this trend. 2009-2010 was the strongest negative anomaly (weak zonal winds) in over a century of recordkeeping.
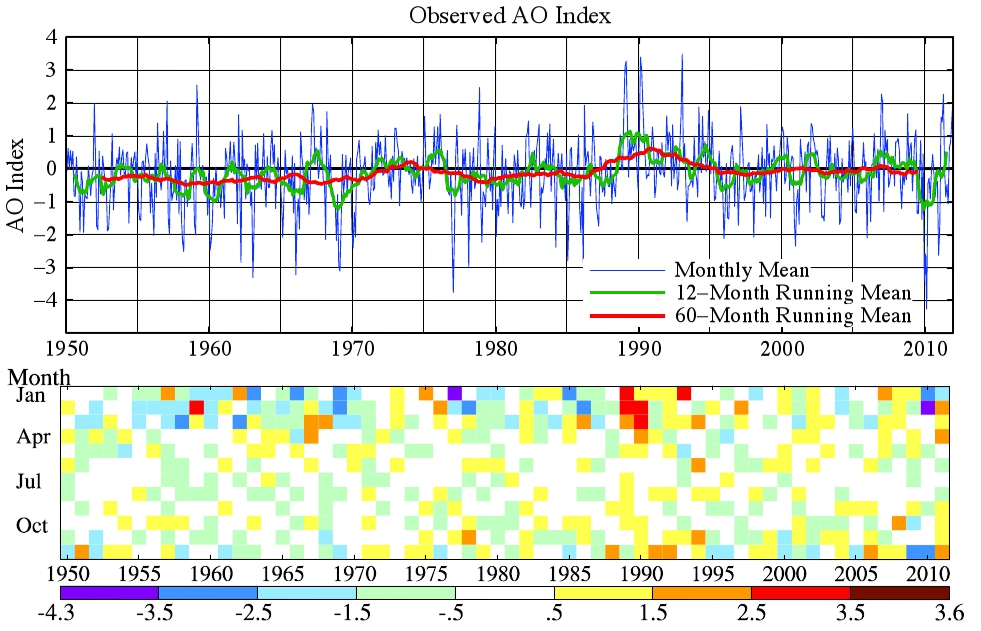
Fig 7. Arctic Oscillation (AO) index. Negative values indicates high pressure in the polar region and thus a tendency for weak zonal winds that facilitate cold air outbreaks to middle latitudes. Blue line is the monthly mean and red line is the 60-month (5-year) running mean.

The authors state:

"Although there has been speculation about possible effects of reduced Arctic sea ice on outbreaks of Arctic air, Fig.(7) provides little support for that hypothesis. Several years had low sea ice cover in the past decade, yet most of those years were warm at middle latitude winters by 1951-1980 standards. Given the fact that winters are much "noisier" (greater natural variability) than summers, the past two unusually cool winters in the United States and Europe do not alter the expectation that middle latitude winters will tend to become warmer as global warming continues."

The Solar Cycle 

Small fluctuations in the sun's output occur over a roughly 11-year cycle (peak-to-peak) and vary by as much as 0.25 watts per square metre(W/m2). This may sound sound small, but it's rather substantial when compared to Earth's energy imbalance - that is: the difference between energy (heat) entering and leaving Earth's atmosphere - the global warming-caused imbalance. 

The NASA analysis has this imbalance at 0.58±0.15 W/m2 (Hansen 2011), whereas Loeb (2012) has it at 0.50±0.43W/m2. Either way the solar cycle-induced change in energy received from the sun (0.25 W/m2) is large compared to Earth's energy imbalance.

Because of the ocean's thermal inertia (it takes a long time to warm up), global temperature change caused by the sun's variabilty lags solar irradiance by about 18 months. The 'trough' in the solar cycle (figure 1) was therefore still exerting a cooling influence on surface temperatures in 2011. However this is expected to quickly change to a warming effect over the next 3-5 years because the sun is on its ascent to the peak of the next cycle. As circled in figure 1 - extra sunlight has gone into the oceans in the last 18 months. This warming is a 'train that has already left the station' so-to-speak, and will soon manifest itself in global temperature.

Aerosols

These are tiny airborne manmade particles of pollution which reflect sunlight back out to space before it can warm the Earth's surface. The cooling effect from this aerosol forcing is thought to be about half that of greenhouse gases, but in the opposing (cooling) direction. 

SkS has looked at another study (Kaufmann [2011]) which suggested an increase in aerosol forcing (greater cooling) due to the rapid industrialization in China in the last decade, however we don't have any direct and accurate global observations yet to support this. A satellite that was launched in 2011 was to be the first to make accurate measurements of this global aerosol effect, but it crashed into the ocean shortly after lift off.

This leads the authors to lament that aerosols are practically unmeasured on a global scale, and the authors regard them as a 'wild card'. 

A warm near-term future

To sum up:

  • Global warming is a small but persistent trend that has significant impacts upon the Earth's climate.
  • 2011 was the 9th warmest year in the GISTEMP global temperature series. 9 out of the 10 warmest years ocurred in the 21st century. The exception being 1998 - warmed by the largest El Niño in a century.
  • A more than tenfold increase in extreme warm events, has the authors state that we can attribute the monster 2010 Moscow summer heatwave, and the 2011 Oklahoma/Texas heatwave, to global warming.
  • The cold winters of 2009-2010 and 2010-2011 in the USA and Europe took place while the rest of the Northern Hemisphere (and planet) was anomalously warm. See also Guirguis (2011).
  • This NASA analysis highlights that the recent lull in surface temperatures is simply the result of natural variability superimposed upon the global warming trend - the cool phase of a cool/warm oscillation.
  • This natural variability is large enough to disguise the global warming trend when viewed over short intervals. See SkS post: Going down the up escalator.
  • Due to a combination of the warm phase of the solar cycle and an overdue switch to El Niño - when the ocean gives up a lot of heat to the atmosphere, near-future warming is expected.
  • The authors finish off their analysis by stating:

"We conclude that the slowdown of warming is likely to prove illusory, with more rapid warming appearing over the next few years."

0 0

Printable Version  |  Link to this page

Comments

1  2  Next

Comments 1 to 50 out of 57:

  1. Hm, I thought it wasn't appropriate to assume that global temperature anomalies were distributed in a Gaussian fashion? Or, am I thinking of their residual distribution about a linear regression model?
    0 0
  2. Nice. Hansen et al have the knack of finding great ways of looking at the data. The "skeptics", for their part, are not sure what to make of two cold winters. They can't talk them up too much, for fear of falling foul of their own "its only weather" catchcry, but they don't want to let them pass unremarked.
    0 0
  3. "The circled area is (roughly) the solar energy already absorbed by the ocean and yet to manifest itself in global temperatures i.e - warming already committed." The only place the bulk of the deep-absorbed heat will return to manifest itself soon, and not violate the 2nd law of TD, is in the Arctics. Observations suggest it releases in the autumn. According to recent papers, the heat-flow is going the other way (missing heat into the deep). If the transfer of heat into the deep layers (below 750 metres) is quick and efficient, then one of the great uncertainties of 'how long' turns out to be decades or centuries. A foundation of AGW atmospheric heat-increase projection is that the heat does not quickly transfer into the ocean 'sponge'. Another piece of contention in the NASA report is on the conclusion about solar influence. They just handed the pro-pollutionists a rock.
    0 0
  4. Owl905 - "The only place the bulk of the deep-absorbed heat will return to manifest itself soon, and not violate the 2nd law of TD, is in the Arctics" The NASA scientists aren't talking about the deep ocean, rather the heat that has gone in the upper ocean over this period. See this image from Roemmich & Gilson (2011). Figure 3 in part 1: As outlined in part 1, during La Nina periods the upwelling of deeper cooler water along the Pacific coast of North & South America, the burial of heat into deeper layers in the western tropical Pacific, combined with the reduced evaporation and lower cloud cover over the oceans, causes more sunlight to be beamed into the oceans. We have been in a La Nina-dominant period in the last 3-4 years, therefore the upper ocean will have accumulated much more heat. That heat will find it's way into the atmosphere during El Nino. That's just the way we have observed the Earth to operate. "According to recent papers, the heat-flow........" This is just more confusion on your part. Note the above. Two separate processes are being discussed here. This 'train that has already left the station' has nothing to do with deep ocean warming. A foundation of AGW atmospheric heat-increase projection is that the heat does not quickly transfer into the ocean 'sponge' Really? Many of the climate models appear to mix heat too efficiently into the deep ocean when compared to observations - according to Hansen (2011). Some much more than others. Can you point me to these other papers you allude to? It's relevant to another article I'm writing. "Another piece of contention in the NASA report is on the conclusion about solar influence. They just handed the pro-pollutionists a rock" This is just a repeat of your comments in the thread of part 1. The sun has a cycle which alters the amount of energy the Earth receives. That is simply a fact. It is also a fact the the fluctuations in this cycle are substantial when compared to Earth's energy imbalance - therefore they can exert a noticeable influence on Earth's climate. This is a completely separate issue to the decline in solar output over the last 30 odd years.
    0 0
  5. Alex C @1 - see SkS post: Extreme Events Increase With Global Warming. Rahmstorf & Coumou (2011) cite a number of earlier papers on this topic too. The distribution is Gaussian.
    0 0
  6. On the subject of statisitcal distributions, Roy Spencer is writing about anomalies going "negative", as if this is impossible in a consensus physics world. Why does he not comment when the anomaly goes positive, and why does he not comment on the frequency over time of positive versus negative anomalies? And once again he trots out his 3rd order polynomial fit with his traditional disavowment:
    The 3rd order polynomial fit to the data (courtesy of Excel) is for entertainment purposes only, and should not be construed as having any predictive value whatsoever.
    which begs the question of why he includes it in the first place. After all, the mathematical function has no relevance to the data, and so has nothing to say about future points: in fact, anyone who knows how the curve's trajectory evolves will know that it rapidly departs from physical possibility in an accelerating and permanent way. Excel (gag) will courteously demonstrate this for anyone who is even mildly curious... The only use of the third-order polynomial fit is to serve as a denialist dog-whistle for the mathematically ignorant and/or gullible, who are taken by the negative slope on the right hand side of the curve. Anyone who has explored the data will know that this is the only form of curve from quite a variety of its that obliges in this way - and to reiterate Spencer's own confession, the mathematics is completely irrelevant to the data. And just quietly, the same third-order fit was included on the WWWT banner a month or two ago. It seems that deception is so great a tool for the Denialati that they are happy to advertise the fact even before they open their mouths.
    0 0
  7. In figure one, I was noticing on the right side .25W/M*2, following the blue hashed lines across it appears to have about a 1.5 W/M*2 peak to peak difference. For my basic understanding, it would clear things up for me why it appears to be two different values.
    0 0
  8. I'm really glad you have written this part two for Hansen's paper. Admittedly I didn't completely understand the statistics part very well. What was the number between the -1 and +1 sigma. I didn't know what to do with it. This article cleared up that part of the question for me. I have worked at understanding this so I can present it in conversattion to other people at the different sites. So far I have gotten very little reaction, because most people don't know what to do with it. I find it a very powerful presentation of the total picture of temperature on the land masses of earth. The -2 and -3 sigma events are shrinking and the +2 and +3 sigma events are expanding. The only way out for them is they don't like Hansen and its a fraud or scam. Thanks for your work in presenting this. I look forward to reading more of your work:)
    0 0
  9. Rob Painting, You did a nice job of presenting the information from the GISS site. Pursuant to our last dialogue I would like to once again point out the importance of using proper terminology. From the NASA website (emphasis mine): "Increased occurrence of such extreme anomalies as a result of global warming, by more than a factor of 10, implies that we can attribute such recent extreme anomalies, including that in Texas and Oklahoma, to global warming." From your summary: "A more than tenfold increase in extreme warm events, has the authors state that we can attribute the monster 2010 Moscow summer heatwave, and the 2011 Oklahoma/Texas heatwave, to global warming." The sentence is subtly different with the omission of the word "implied". However, the information being conveyed in the sentence is changed to a much greater degree. I don't know if this was intentional or unintentional on your part during your rewording of the report. Or, it could simply represent your own bias based on your interpretation due to a lack of understanding of scientific vocabulary. Regardless, for the sake of accuracy, this needs to be pointed out. When used in scientific (logic) writing the word implies means “to be of sufficient circumstance”. Or, that causation is not certain. In casual use the word implies loosely means “suggests”. Your omission of the word “implies” changes their statement from suggesting there is a causal relationship between the anomalies and global warming to a statement of fact. That was not the author’s intent.
    0 0
  10. apiratelooksat50 @9, your word splitting is entirely specious. Implication is a relationship such that: A implies B allows us to infer from A that B. In this case, A is the tenfold increase in extreme warm events; B is the attribution of the 2010 Moscow heatwave, and the 2011 Texas and Oklahoma heatwave to global warming. In this case, you are maintaining that the authors assert A, and further assert A implies B, but insist that they do not conclude that B. The only way they can have not concluded that B is if, for some unknown reason, they have decided to contradict themselves. That not being the normal custom of NASA scientists, your interpretation is a clear misinterpretation of their claims.
    0 0
  11. #7 renewable guy The Solar Flux given the value above the atmosphere. However some of that is reflected by the Earth due to the albedo effect and the remainder (about 7/10ths) is spread over the surface of the Earth so we must divide by 4 to obtain an average flux for the whole planet. So multiply 1.5 x 0.7 x 0.25 and you are close to the 0.25 W/m2 variablity in the forcing quoted. There is some discussion of this in other SkS articles. e.g. How we know the sun isn't causing global warming. Other sites like Real Climate discuss this too.
    0 0
  12. For #7 renewable guy mdenison beat me to the answer but here’s different words that say the same thing in case it helps. The left hand axis of figure 1 is showing the TOA solar irradiance at the subsolar point. It appears to vary from 1365.2 to 1366.7 W/m² over most solar cycles (from eyeballing the figure). The difference is your 1.5 W/m². These two numbers work out to 341.3 to 341.7 W/m² of solar energy entering the climate system when averaged over the surface of the entire planet. Around 30% of what enters is reflected back out to space, leaving a net from 238.9 to 239.2 W/m² inside the climate system. The difference between these last two numbers is very close to 0.25 W/m², which is the figure shown on the right hand axis.
    0 0
  13. Owl905 - "The only place the bulk of the deep-absorbed heat will return to manifest itself soon, and not violate the 2nd law of TD, is in the Arctics" This effect in the fall may be more easily understood in a very simple fashion. An ever more ice free Arctic Ocean absorbs more energy during the summer. In the fall, the land cools off quickly while the ocean remains "warm". You have the typical off-shore wind scenario that occurs in warm climates each evening. Only this effect will persist, probably, until the ocean freezes over. Result,with Coriolis, winds flowing toward the North East and a counter clockwise flow over the Arctic ocean. ie the reversal of the Polar Hadley cell http://mtkass.blogspot.co.nz/2008/07/arctic-melting-no-problem.html
    0 0
  14. For #7 renewable guy: Like you, this huge difference between ~1366 W/m2 from the sun and the ~239 W/m2 across the earth (after albedo) confused me. The main source of the confusion for me was: "Where does the factor '4' come from?" After carefully reading Hansen's book, "Storms of My Grandchildren" (pg.104, 1st paragraph), the light bulb finally came on. 1) If you take the light from the sun that is aimed at the earth and you put an imaginary flat-plane thru that beam, you will essentially make a circle of light with the same diameter as earth's diameter (~8000 miles). The area of this circle is = (pi)x(diam^2)/4 (or (pi)xrad^2). The 1366 W/m2 is the flux of energy thru this imaginary circle. 2) Now the AREA of the whole earth's surface, or of a sphere, is = (pi)x(diam^)2 (or 4x(pi)xrad^2). So, the area of a sphere is 4x the cross-sectional area of the circle having the same diameter of the sphere. So, when you take the 1366 W/m2 and spread it over the rotating earth, the AVERAGE W/m2 across the whole globe is then 1/4 the 1366 W/m2. Multiply that result by 70% for the albedo effect (30% immediate reflection), and you are left with the 239 W/m2 value. This essentially follows mdenison's math above. Obviously, due to the curvature of the earth, this W/m2 value varies: higher at the equator, lower at the poles, but the AVERAGE is this ~239 value.
    0 0
  15. William @ 13 - Again, the extra energy absorbed by the oceans over the recent period has little to do with the Arctic. Owl905 is simply confused - despite this being clearly explained. For some reason several readers have not grasped the fact that the oceans accumulate energy during La Nina, and we have been in a La Nina-dominant period over the last 3-4 years. That would have gained a bit more spice on top because of the strengthening solar cycle in the last 18 months. It has already happened. That heat stored in the subsurface layers of the upper ocean is going to re-surface - as it always does during El Nino - see the figure from Roemmich and Gilson (2011) in comment @4. You can clearly see the heat building up in the subsurface ocean up to the beginning of 2011.
    0 0
  16. "The NASA analysis has this imbalance at 0.58±0.15 W/m2 (Hansen 2011), whereas Loeb (2012) has it at 0.50±0.43W/m2. Either way the solar cycle-induced change in energy received from the sun (0.25 W/m2) is large compared to Earth's energy imbalance." I have looked at both papers to try to find an answer to a question that has been nagging at me, but frankly they are both beyond the limits of my understanding, and I can't puzzle out why Loeb suggests so much more variability than Hansen does. Is he using a longer time scale or something?
    0 0
  17. Renewable Guy - " I find it a very powerful presentation of the total picture of temperature on the land masses of earth. The -2 and -3 sigma events are shrinking and the +2 and +3 sigma events are expanding." I agree, it's powerful evidence that global warming is keeping on keeping on. And thanks for the nice words.
    0 0
  18. @14, thanks for the clarification - I too wondered where the '4' came from. (Also need to factor in the contribution that the half-degree diameter of the sun adds. It illuminates a little bit more than 50% of the planet, and the rays extend beyond the surface into the atmosphere at dawn/dusk).
    0 0
  19. Old Mole @ 16 - Almost finished a blog post on Loeb (2012), a large part of the uncertainty is the XBT (expendable bathythermograph) data, which was sparsely sampled in both time and space. That comprises the bulk of the ocean heat content data between 2001-2003 in the 2001-2010 period that Loeb (2012) looks at. Also there is substantial variation in the 3 ocean heat content records. These are things that Kevin Trenberth was complaining about in the first place, so progress has been limited. Not sure about Hansen (2011) have had a read through, but will have to look at that again. It's an interesting paper, if you can see beyond the disturbing implications of such a strong aerosol cooling effect. Will write something up about that too in the future. Need to digest it a bit more though.
    0 0
  20. This is an excellent post, and really puts a nice perspective on short-term natural fluctuations, either from solar or ENSO versus the longer term forcing from anthropogenic greenhouse emissions. The only thing left out of course is the effect of volcanic activity, which can of course cause short-term, and medium-term climate effects. I certainly think there is strong possibility that we'll see at least one record warm year (by instrumental record) in 2012, 2013, 2014, or 2015, as even a moderate El Nino aligns near Solar Max 24 (no matter how weak). No doubt, AGW skeptics will attribute such record warmth to either: 1) Falsified or corrupted or cherry picked data 2) Natural (though non-specified) variability 3) Continued warming from the Little Ice Age recovery 4) Residual heat left over from the 1998 Super El Nino 5) Only the El Nino and Solar Max 24 combination but not any long-term warming from increased greenhouse gases 6) Reduced Cosmic rays and reduced clouds from Solar Max 24 7) Some other creative excuse that reduces their own cognitive dissonance related to the reality of AGW. It will be interesting over the next few years to see if the linear upward trend in temperatures (when natural variability is factored out) as identified in the Foster & Rahmstorf 2011 study continues. Even more interesting is to see if this linear trend is indeed truly that, of if it does begin to inflect upward slightly over the next few decades.
    0 0
  21. R. Gates The denier response will be its the sun. And or well of course it is warmer - it is an El Nino. And the thunderous silence about the warming going on right now (as opposed to the precipitous drop in temperatures we would expect from a La Nina/solar minimum) will continue.
    0 0
  22. The topology of the denialist space is almost exactly what is needed to avoid the reality of the evidence. This is no accident. Extraordinary expertise is used to avoid evidence that does not fit with their preconceived ideas or agendas. The resulting convoluted logic is self perpetuating as it is totally circular and easily digestible to the uninformed. The inconsistency of their wacky arguments that quite often are contradictory is a blight to behold. Bert
    0 0
  23. Pirate @ 9 & Tom Curtis @10: Most inferences in science (apart from mathematics) relate to probability. In analysing data with public policy and especially legal implications , the language goes as follows: A caused B beyond reasonable doubt (the criminal test). On the balance of probabilities A caused B, ie, it is more probable than not that A caused B (the civil test). On the balance of probabilities A substantially contributed to B, ie, A need not have been the entire, largest, or even majority contributor to B. A needs only to have made a contribution which was large, more than trivial, not small, etc (a subtle refinement of the civil test). I'm curious how you would fit the issue of the anomalies into this framework. At any rate, thanks to RP for a very clear explanation of the Gaussian curve underpinning temperature. Do we have enough data to say that the current shift to the right is unprecedented?
    0 0
  24. chirhphoros @23 your categories are non-exclusive, and significantly overlapping. Specifically, if a person stood at the edge of the Grand Canyon, and somebody deliberately pushed her to her death, proof "beyond reasonable doubt" that they pushed her, and did so with the intention of causing her harm would be proof beyond reasonable doubt that that person was guilty of murder. However, the push was neither a necessary nor a sufficient condition for the death of the victim. Necessarily it is just a small part of the causal chain leading to the victims death. Other parts include the force of gravity, the height of the drop, the lack of a safety rail, the lack of a safety net, and so on. Therefore the push was not sufficient for the death of the victim. Neither was it necessary for the victim could have stumbled, been accidentally bumped, or just had an embolism, and died even in the absence of the push. So, despite the classical development of the notion of causation as a necessary and sufficient condition for an event to occur, in actuality "causes" are only necessary if we exclude alternative non-realized scenarious, and if we include rigorous assumptions about what is reasonably expected (ceterus paribus clauses). Likewise they are only sufficient with similar assumptions about reasonable expectations. Further, the legal distinction of "beyond all doubt" is bizarrely (at least in Australian Jurisdictions) undefined and hence meaningless. Judges, under common law, are not permitted to direct the jury as to what level of probability constitutes beyond reasonable doubt, or in any other way define the phrase beyond its own words. Hence, by law it is an undefined and undefinable. And as a matter of logic, any term which is undefined and undefinable is strictly meaningless. In the end, it reduces to an emotional appeal to be as certain as you can be before recording a conviction, ie, to take your job seriously and to not convict lightly. Such a standard has no place in science. For myself I parse "beyond reasonable doubt" to mean that the evidence shows the conclusion with greater than 99% probability (necessarily subjectively estimated) and no reasonable hypothesis which, if true would mean the defendant is not guilty has been proposed as true and not refuted. Note that this is my personal definition, and by force of law not the actual definition, because by force of law it has no actual definition. However, it is obviously an absurd standard for science. In science it would mean that no hypothesis could be accepted even provisionally if there existed any alternative hypothesis that had not been refuted. In science, however, showing that Hypothesis A has a probability given the evidence, at least 20 times greater than the probability of Hypothesis B given the evidence is sufficient to provisionally reject B in favour of A. Provisionally, because all theories or laws in science are only ever provisionally accepted. (The 20 times is not a hard and fast rule. Nobody has ever sat down an legislated it. But it is a good rule of thumb.) Returning to the anomalies, look at the following very important graph: The Hot events are greater than 0.43 sigma, Very Hot greater than 2 sigma, and extremely hot, greater than 3 sigma. If you look at the graph, you can see that we now have events with a probability (assuming stationary climate) of 2.1% occurring around 20% of the time (area covered); and events with a probability (assuming stationary climate) of 0.1% occuring between 5 and 10% of the time, ie, between 50 and 100 times as frequently as they previously occurred. I haven't done the maths but that global warming is the cause of those events (all else being equal) seems well established. The all else being equal, of course, just assumes a continuing pattern of El Ninos and blocking events, which are of course contributory causes to any particular heat wave.
    0 0
  25. andylee@18 I'm not sure dawn and dusk really have any relevance since they are purely human perceived timing events at specific points on the globe. I get the point you make about the atmosphere, part of the suns rays are going to hit the surface and those rays on the periphery of the imaginary circular slice through the rays, will pass through the atmosphere. It is a continuous process as the earth revolves. There is no need to perceive any special case or moment in time.
    0 0
  26. #20: Excellent summary of denier excuses. One important thing to remember is that the deniers have painted themselves into a corner by predicting rapid cooling in the coming years/decades. There will no doubt be an effort to delete webpages with such statements, etc, so it would be wise to save as much of this info as possible. I have adviced local journalists (who can't print enough denier drivel, it seems) to take note of these cooling claims and then follow up on them around 2014. When the next El Nino comes around and the new global record is set, being able to point to the science predicting that, and then pointing out that the deniers forecasted the opposite will cause at least reasonable folks to open their eyes a little. Note that immediate cooling was the hot denier topic back in 2008 as well, and they could not wait until 09 and 10 rolled around with their predicted continuing cooling, proudly claiming the "La Nina excuse" could not be used anymore. It was the negative PDO that was the denier favorite back then. We all know what happened in 09 and 10, but the deniers got away with it despite their prediction being dead wrong. This is the sort of stuff that even an illiterate public will understand when pointed out to them, so when the next record is being set sometime from 2013 to 2016 we can't put enough emphasize on the (once again) failed denier cooling predictions.
    0 0
  27. Mods, Am I allowed to post an email from another person? If so what are the guidelines? Thanks
    0 0
    Response:

    [DB] You would need:

    1. Consent from them, either written or via email, that they agree to allow you to post the email on SkS
    2. To repost the message from them in it's entirety so context is preserved
    3. The email must not contain personal information of a sensitive nature
    4. The email must be on-topic to the post on which it is placed
    5. The email must be written to comply with the SkS Comments Policy
    6. The email must add to the discussion; i.e., it must provide information/context to the discussion on that thread not already covered prior to this, nor itself also not available via link to peer-reviewed, published literature (no anecdotal reposting of the science)
  28. Dear Rob, Dear SkS team, I am now four months studying climate change. Next to attending David Archers lectures on climate science I could achieve the best learning curve at SkS. The year end summaries came just in time to get an overview. From now on this posting and the Hansen 2011 article will be the basis for next months study. Thanks,
    0 0
  29. Rob #Original Post "Small fluctuations in the sun's output occur over a roughly 11-year cycle (peak-to-peak) and vary by as much as 0.25 watts per square metre(W/m2). This may sound sound small, but it's rather substantial when compared to Earth's energy imbalance - that is: the difference between energy (heat) entering and leaving Earth's atmosphere - the global warming-caused imbalance." Well Rob, when I started commenting on SKS, Solar was a lot smaller. When the warming imbalance was 0.9W/sq.m - Solar was only 0.13 +/-0.13 W/sq.m. Now its rather substantial. How can it be a contributor to global warming if it is a predictable cyclical variation which has always been there? Further this 'warming already committed but not yet manifest in surface temperatures' is somewhat misleading. The energy is already stored somewhere - expressed as increased ocean temperatures or phase change right now. All the temperature expression we have now is a reflection of cumulative past global energy gain or loss. Future warming can come only from future energy gain.
    0 0
  30. Is anyone aware of any published studies that explain the impact the projected cooling that the sun is expected to undergo within the coming decades will have on the 11 year solar cycle? Thus far I have only come across seperate articles mentioning them, and I'd be really interested to see how the one may impact the other
    0 0
  31. Paul D@25, Exactly - I didn't want to patronize with long explanations! dawn and dusk was just a short way of describing the ring around the Earth where the sun is below the horizon, but the atmosphere is still illuminated, and indirectly heating the surface. Thus the fraction of the Earth receiving energy from the Sun would be slightly more than 50%. (I'm pretty sure we can discount earthshine from the moon from having any statistical relevance)
    0 0
  32. Miscellaneous notes: The Hansen 2011 "Earth's Energy Imbalance and Implications" paper lists von Schuckmann as a co-author which indicates how much Hansen is relying on her estimate of ocean heat storage. She and Le Traon analysed ARGO 2005-2010 data that Hansen says he emphasizes "because of its potential for accurate analysis" compared to the pre-ARGO data which he says in his talks is "very noisy". Loeb used various datasets from 2001 to 2010. Hansen states that although the "measured energy imbalance" found by his paper was 0.58 W/m2, because that period was "a deep solar minimum", "we estimate the energy imbalance averaged over a solar cycle as 0.75 W/m2". I found that a Youtube video of Hansen discussing the ideas presented in his 2011 paper was a valuable aid as I studied the paper. Regarding the apparently warm year of 1998: It wasn't just an El Nino of the century but that El Nino had perfect timing. The Hansen 2012 paper says this: "Hansen et al. (2010) showed that the correlation of 12-month running-mean global temperature and Niño 3.4 index is maximum with global temperature lagging the Niño index by 4 months. Thus the 1997-1998 "El Niño of the century" had a timing that maximized 1998 global temperature" Hansen's New Climate Dice paper, which is referenced by Hansen 2012, discusses the issue of increased likelihood of extreme events using an analogy Hansen has used for decades. Its an easily understood point of view. Any casino that detected that the dice in use were loaded in favor of the players would act immediately to end the threat. No one running the casino would say that loaded dice couldn't be said to be responsible for any individual win - they wouldn't waste their time thinking that way. They would immediately understand that loaded dice would quickly lead to the bankruptcy of the casino.
    0 0
  33. The Hansen 2011 paper also repeats the "smoking gun" analogy Hansen used starting around 2005. "The strong positive energy imbalance during the solar minimum, and the consistency of the planet’s energy imbalance with expectations based on estimated human-made climate forcing, together constitute a smoking gun, a fundamental verification that human-made climate forcing is the dominant forcing driving global climate change. Positive net forcing even during solar minimum assures that global warming will be continuing on decadal time scales."
    0 0
  34. Ken Lambert @ 29 - "Well Rob, when I started commenting on SKS, Solar was a lot smaller. When the warming imbalance was 0.9W/sq.m - Solar was only 0.13 +/-0.13 W/sq.m." Is that right Ken? Sounds like 0.13 might be referring to the anomaly from a baseline which would yield about 0.26 W/m2. But then I don't know which SkS blog post you are referencing. "How can it be a contributor to global warming if it is a predictable cyclical variation which has always been there?" This is in the introduction to this blog post: "This is not a new phenomenon, but simply a reflection of natural variability, cool (La Niña) and warm (El Niño) phases which still exert a temporary cooling/warming influence on global surface temperatures even in the presence of a persistent global warming trend" I don't know why you are confused on this point, I've made it very explicit. The same deal applies to the solar cycle - at times it reinforces the global warming signal, and at other times it acts as a brake. "Further this 'warming already committed but not yet manifest in surface temperatures' is somewhat misleading. The energy is already stored somewhere - expressed as increased ocean temperatures or phase change right now. All the temperature expression we have now is a reflection of cumulative past global energy gain or loss." Some is being misleading here Ken, and it's not me. The suns energy has already been absorbed by the oceans and takes about 18 months for them to warm up and exchange all this heat with the atmosphere, thereby affecting surface temperatures. If you wish to contradict these NASA scientists, some supporting literature would be handy. Otherwise it's just an uninformed opinion.
    0 0
  35. Tom Curtis @24: I agree - the categories I mention do overlap as do so many matters in which judgement (arbitration) is required. I agree that 1951 -1980 and 1981 to present are statistically quite different periods. However, is the statistical difference between the two periods unprecedented? Do we have have data (albeit somewhat truncated because less data may have been recorded) from earlier periods to suggest that 1981 to present is vastly different (eg, early 20 century data or 19 or 18 century data)? If available, it ought to be highlighted because it would be compelling. CC
    0 0
  36. Rob #34 "Some is being misleading here Ken, and it's not me. The suns energy has already been absorbed by the oceans and takes about 18 months for them to warm up and exchange all this heat with the atmosphere, thereby affecting surface temperatures." If the sun's energy has already been absorbed by the oceans how is it expressed? It must be in temperature increase or phase change (evaporation or ice melt) right now. It might take 18 months (or much longer if going deep) for increased temperatures to be distributed elsewhere, however if it warms somewhere else by convection or conduction, then the temperature cools at the initial entry area unless this is a globally steady state system with a steady temperature gradient. It is not - ENSO and other circulations move heat about so that a warming gradient might raise surface temperatures in one part of the system and cool it other parts.
    0 0
  37. apiratelooksat50: Dimly recalling logic classes in both math/comp sci and philosophy, a logical implication is an argument (and vice versa of course: an argument is a form of implication). As Tom Curtis indicated upthread, as a logical construct, A→B is "A, therefore B", which is much stronger than mere suggestion. As such, if I see 'implies' in a casual setting (newspaper, opinion piece, blog post) I am likely to interpret it in the suggestive sense. Seeing it in a more scientific context (such as the article by Hansen et al, I am likely to interpret it as an inference, and the context in which it appears:
    In the 1951-1980 period of climatology the area with temperature anomaly exceeding +3σ was only a few tenths of one percent. However, the area covered by such extreme anomalies has increased with global warming. +3σ anomalies covered 7% of the area with observations in Jun-Jul-Aug 2009, 13% in 2010, and 9% in 2011 (Hansen et al., 2012). Increased occurrence of such extreme anomalies as a result of global warming, by more than a factor of 10, implies that we can attribute such recent extreme anomalies, including that in Texas and Oklahoma, to global warming.
    very strongly indicates to me that inference is what is meant, not the suggestion.
    0 0
  38. In addition to my immediate preceding comment, I should like to highlight another part of the phrase: "Increased occurence of such extreme anomalies, as a result of global warming, by more than a factor of 10, implies that we can attribute [Emphasis mine] such extreme anomalies, including that in Texas and Oklahoma, to global warming." That is a much stronger statement of attribution than I am used to seeing, which, occuring as it does in the same sentence as the implies under discussion, IMO reinforces the implication-as-logical inference point (while the inference also reinforces the positive claim of attribution).
    0 0
  39. Ken: You cited Rob as stating:
    The [S]un[']s energy has already been absorbed by the oceans and takes about 18 months for them to warm up and exchange all this heat with the atmosphere [Emphasis mine], thereby affecting surface temperatures
    You then ask:
    If the sun's energy has already been absorbed by the oceans how is it expressed? It must be in temperature increase or phase change (evaporation or ice melt) right now
    Yet Rob's previous statement answers your question already: ocean warming is a temperature change right now (as you suggest is required).
    0 0
  40. re: andylee @31 dawn and dusk was just a short way of describing the ring around the Earth where the sun is below the horizon, but the atmosphere is still illuminated, and indirectly heating the surface. Thus the fraction of the Earth receiving energy from the Sun would be slightly more than 50%. Given the extreme thinness of the atmosphere compared to the radius or diameter of the earth, this does not really affect the total sunlight intercepted by the earth. It does have a slight effect on where the energy falls, but this effect of atmospheric refraction is a standard part of the geometry of solar radiation calculations and modeling. Nothing new here.
    0 0
  41. Rob, I'm coming to this a bit late in the day, but I hope my comments will make sense! I found your summary effective, but must in part agree with apiratelooksat50 that you have been a bit unfair where that one passage is concerned. So . . . I'm glad to see that the original passage referenced by apiratelooksat50@9 is present in this post, since it shows that your summary of it is simply a bit jazzed up for our reading pleasure. On the other hand, while I am not a scientist, I do have a doctorate in English, and I can tell you that the distortion imparted to the original by you in the summary section would raise flags if a similar passage, without the original, surfaced in a student essay in disciplines where being faithful or fair to the source matters. Since many of us, on the subject of global warming, are students, I think we need to be very careful where sources are concerned. Because you provide the original, if I saw a similar paraphrase in a paper submitted to me, I think I would point out that you should be more temperate in your conclusion. To put it bluntly, I think you have unfairly implied that what you write as a summary is what the authors have stated. The word "state" is a very strong signal word, and should really only precede a quotation. The proper way to handle this would have been to reproduce the original passage (as you do with that last summary point): it is a pithy one, so quoting it once again makes good rhetorical sense. You could also revise the passage. Here is the way you wrote it: "A more than tenfold increase in extreme warm events, has the authors state that we can attribute the monster 2010 Moscow summer heatwave, and the 2011 Oklahoma/Texas heatwave, to global warming." I think something like this would be fairer to the source (though less pithy--most pithy passages are hard to succinctly paraphrase): Global warming is implicated in the recent more than tenfold increase in extreme warm events, including specific events like the summer 2010 Moscow heatwave and last summer's heatwave in Oklahoma and Texas. Hope this is clear! I enjoyed (if I can say that about more bad news regarding AGW) reading the article and learned a few things along the way. Don Blume
    0 0
  42. Don9000 @41, with respect, your background may be in English, but mine is in logic and philosophy (including the philosophy of language, science and epistemology, for what it is worth). The imprecise language found acceptable in English continually makes my skin crawl as a logician. The worst offense is the standard usage of saying "all are not" when what is meant is that "not all are". The difference between asserting that no member of a group has a particular property (all are not) and asserting that there are some members who do not have it (not all are) is apparently to subtle for the average English speaker. The same problem occurs in imprecision of terminology. "Implies" means that a relationship stands between the two propositions which supports modus ponens as explained @10 above. That is all that it means, in either English or in logical usage. It is used in common speach to soften assertions, but that usage is as inconsistent as asserting that "all are not" when you mean that "not all are". The question is, then, are the writers of a scientific paper more likely to be using the precise logical meaning of the word, or the common street misuse of the term. Choosing to believe the latter while ignoring the context of utterance is hardly credible. From context, the "implies" is not a strict justification of "modus ponens" because the implication is probabilistic, but neither is it a mere weakening of the assertion. The qualification on the assertion is merely the qualification on all empirical assertion. That is, to the best of the authors knowledge the two heatwaves would not have occurred without global warming; but the best of their knowledge is not claimed to be perfect.
    0 0
  43. Don9000 - Much ado about nothing. It was a simple inadvertent omission that I don't consider materially changes the intent of that part of the analysis - it's clearly explained in the body of the article that extreme warm events will increase markedly with global warming. Anyway, I've emailed Dr Hansen. If he replies and feels it should be changed, I will do so.
    0 0
  44. Rob Painting @34 "The suns energy has already been absorbed by the oceans and takes about 18 months for them to warm up and exchange all this heat with the atmosphere, thereby affecting surface temperatures. If you wish to contradict these NASA scientists, some supporting literature would be handy. Otherwise it's just an uninformed opinion." Once again I am having a hard time puzzling this out, and would be grateful for a link to which paper by NASA scientists you rely on. You say with confidence "18 months" and Judith Curry (in a post made in the last week that I can't find at present) suggested that it was more like 1 month. I am not sure there is really much of a contradiction, though. When you say "all this heat" you are no doubt correct ... but how much of "all" remains after 17 months? It was seem, based on no more than intuition, that there would be a least an order of magnitude difference between the heat released through evaporation in month 1 than the amount released in month 17. Please correct me if my grasp of fluid thermodynamics is at fault, and give me some idea of what the curve for energy release from the ocean would look like for a solar event, largely in the form of light energy in the visible spectrum and therefore confined largely to a relatively shallow surface layer, at least initially.
    0 0
  45. Old Mole - "Once again I am having a hard time puzzling this out, and would be grateful for a link to which paper by NASA scientists you rely on" Yeah, well some of the comments on this thread puzzle the heck out of me. I think this relatively easy to follow, but perhaps not. The NASA scientists are those mentioned at the top of this post, and the analysis linked to in the blog post. They state: "Because of the ocean's thermal inertia, global temperature change caused by solar variability lags solar irradiance by about 18 months." I've seen mention in other literature that the lag is closer to two years. But I wouldn't be able to link to one at the moment. See what I can track down as others seem to be having problems with the notion of ocean thermal lag too. and Judith Curry..... That was organic spambot Mace, JDey, or whatever he calls himself, impersonating Judith Curry.
    0 0
  46. Rob @45 Sorry about that ... I think most of my confusion was not figuring out that 0.25 W/m2, when distributed through 10+ cubic meters of sea water, is a very tiny signal indeed ... so inertial effects really could predominate. Thanks.
    0 0
  47. Rob#45 "Because of the ocean's thermal inertia, global temperature change caused by solar variability lags solar irradiance by about 18 months." The NASA statement refers to global temperature change. This should include all of ocean, land + air temperatures. We know that the absorbed energy in the oceans must show up as raised temperatures or phase change so what the statement should say is that because of the ocean's thermal inertia, temperature rise in some parts of the system (presumably air and surface) is delayed by heat transport through the oceans.
    0 0
  48. "global temperature change caused by solar variability lags solar irradiance by about 18 months." The spamboy did raise a valid point: FR2011 determined a lag between TSI change and temperatures (they used both satellite and surface records) of 1 month. This was in agreement with results of Lean and Rind 2008. Putting an 18 month lag into FR's data (available at you-know-who's blog) destroys all semblance of fit.
    0 0
  49. Tom Curtis at 10 Looks like we were both right in a way. Kind of like kissing your sister. I contacted Mr. Hansen and asked him for clarification on his intent of using "implies" in the paragraph. In an excerpt from his e-mail: "That's a good point -- not a very precise word -- what I meant was that we could conclude -- of course that is a pretty strong statement -- we will see if referees agree with my assertion, when I submit the paper for publication in ~ a week or so." It will be interesting to see the language used in the final version if the paper is published after peer review.
    0 0
  50. Muon @ 48 - the peer-reviewed literature doesn't make it clear, but these are two separate issues. Firstly, the lag in surface air temperature response to a change in solar irradiance is about a month, but the ocean response is on the order of 18-24 months. Still trying to track down a paper that deals with this issue specifically. It's mentioned in a few papers, but only in passing.
    0 0

1  2  Next

You need to be logged in to post a comment. Login via the left margin or if you're new, register here.


The Consensus Project Website

THE ESCALATOR

(free to republish)


© Copyright 2024 John Cook
Home | Translations | About Us | Privacy | Contact Us