 Arguments
 Software
 Resources
Comments
 The Consensus Project
 Translations
 About
Support


Latest Posts
- Fact brief - Is Mars warming?
- Skeptical Science New Research for Week #14 2025
- Two-part webinar about the scientific consensus on human-caused global warming
- Sabin 33 #22 - How does waste from wind turbines compare to waste from fossil fuel use?
- Clean energy generates major economic benefits, especially in red states
- 2025 SkS Weekly Climate Change & Global Warming News Roundup #13
- Skeptical Science New Research for Week #13 2025
- Climate skeptics have new favorite graph; it shows the opposite of what they claim
- Sabin 33 #21 - How does production of wind turbine components compare with burning fossil fuels?
- China will need 10,000GW of wind and solar by 2060
- 2025 SkS Weekly Climate Change & Global Warming News Roundup #12
- Skeptical Science New Research for Week #12 2025
- Climate Fresk - a neat way to make the complexity of climate change less puzzling
- Sabin 33 #20 - Is offshore wind development harmful to whales and other marine life?
- Do Americans really want urban sprawl?
- 2025 SkS Weekly Climate Change & Global Warming News Roundup #11
- Fact brief - Is waste heat from industrial activity the reason the planet is warming?
- Skeptical Science New Research for Week #11 2025
- Visualizing daily global temperatures
- Sabin 33 #19 - Are wind turbines a major threat to wildlife?
- The National Hurricane Center set an all-time record for forecast accuracy in 2024
- 2025 SkS Weekly Climate Change & Global Warming News Roundup #10
- Fact brief - Is Greenland losing land ice?
- The Cranky Uncle game can now be played in 16 languages!
- Skeptical Science New Research for Week #10 2025
- Climate Adam: Protecting our Planet from President Trump
- Sabin 33 #18 - Can shadow flicker from wind turbines trigger seizures in people with epilepsy?
- Cuts to U.S. weather and climate research could put public safety at risk
- 2025 SkS Weekly Climate Change & Global Warming News Roundup #09
- Fact brief - Are high CO2 levels harmless because they also occurred in the past?
Archived Rebuttal
This is the archived Intermediate rebuttal to the climate myth "Underground temperatures control climate". Click here to view the latest rebuttal.
What the science says...
|
The flow of energy outwards from the interior of the Earth is 1/10,000th of the size of the energy flow from the Sun. Furthermore, over the past few million years, the heat flow from deep in the Earth has also remained very steady |
Consider:
- The center of the Earth is at a temperature of over 6000°C, hotter than the surface of the Sun.
- We have all seen pictures of rivers of red-hot magma pouring out of volcanoes.
- Many of us have bathed in natural hot springs.
- There are plans to exploit geothermal energy as a renewable resource.
Common sense might suggest that all that heat must have a big effect on climate. But the science says no: the amount of heat energy coming out of the Earth is actually very small and the rate of flow of that heat is very steady over long time periods. The effect on the climate is in fact too small to be worth considering.
The Earth’s heat flow
Where does the heat come from?
- There are radioactive elements in the Earth, mainly potassium, uranium, and thorium, that have long half-lives. When their nuclei decay, they give off heat, as in a nuclear reactor. Some researchers say that "the vast majority of the heat in Earth's interior—up to 90 percent—is fueled by the decaying of radioactive isotopes", while other scientists claim that "heat from radioactive decay contributes about half of Earth’s total heat flux". More here.
- The Earth is still hot from the time the planet formed from the agglomeration of smaller bits and pieces. Even more heat was gained as the high-density materials, such as iron and nickel, subsequently separated out and formed the core of the Earth.
The mostly solid, rocky outer layers of the Earth, the crust and mantle, have low thermal conductivity, acting as a thermal blanket slowing down the passage of heat to the surface. In the very early stages of the Earth’s history, internal temperatures and heat flows were probably much higher than they are today, partly because the planet had only just started to cool, and partly because the energy flow from radioactive decay was much larger then.
How does the heat get to the surface?
According to Stein and Stein (10MByte download) most of the heat energy (about 70%) that makes its way to the surface is transported by the convection of the mantle. This is the process that drives plate tectonics. Most of the rest of the heat flow, 25%, is by conduction. The small remainder is transported by mantle plumes, hot spots associated with certain volcanoes.
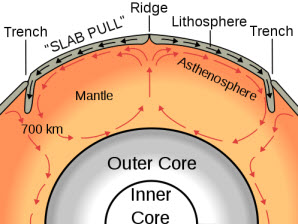
Figure 1: Showing mantle convection cells, which are responsible for transporting most of the Earth’s heat from the interior to the surface. Wikipedia
Mantle convection cells are the super tankers of global tectonics, transporting vast quantities of hot rock but changing speed and direction only gradually. Conduction of heat through the rocks of the Earth’s continental crust is also an unhurried and stable process; with the supply of heat metered by atomic clockwork. There are a few well-known hot spots around the world, where magma and hot water quickly bring heat to the surface but the energy released at these places does not add up to much in the global scheme of things. The rate of heat escape from the Earth is slow and very steady.
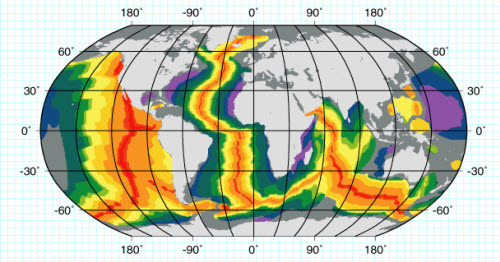
Figure 2: Red indicates the oceanic ridges where mantle convection comes to the surface and where new ocean crust is formed. The colors indicate the age of the oceanic crust, with the purple being the oldest. Source.
How do we measure heat flow?
The temperature gradient in the upper part of the crust is determined by directly measuring temperatures at different elevations in boreholes. On land, temperature measurements are usually made at depths greater than 100 metres to avoid any effect of variable surface temperatures. In the oceans, water temperatures at the sea bed are generally steady; measurements are made in the uppermost layer of sediments and yield reliable results. Once the thermal conductivity is known (it can be measured in a laboratory) the heat flow can be calculated using Fourier’s equation:
q = -ku
Where q is the heat flow, k is the thermal conductivity, and u is the temperature gradient.
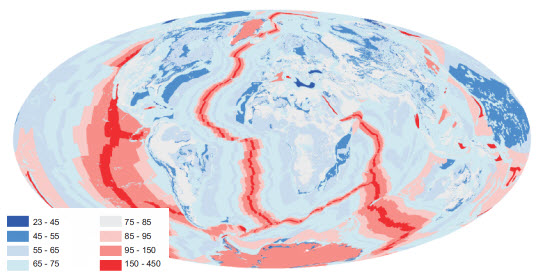
Figure 3: Heat flow at the surface of the earth, from Davies and Davies (2010). Heat flow units are in mWm-2. Note how the areas of highest heat flow follow the mid-ocean ridges. The largest areas of measurement uncertainty are along the very crests of the ridges and under the Greenland and Antarctic ice caps. The total heat flow for the planet is 47 TW +/- 2TW, which is equivalent to 0.09Wm-2 (90mWm-2).
Typically, the rate at which temperature increases with depth (the geothermal gradient) is in the range of 25-30°C per kilometer, with higher values at volcanoes, ocean ridges and rifts, and lower values in places that have recently received thick blankets of sediments. The top several hundred metres of boreholes often show changes in the geothermal gradient that are caused by changes in the surface temperature that have modified the temperature of the rocks at these shallow depths. These observations can be inverted to reveal paleoclimate information over the past few hundred years; see Huang et al (2000) and Beltrami et al (2011).
How does heat flow from the interior of the Earth compare with other inputs of energy into the climate system?
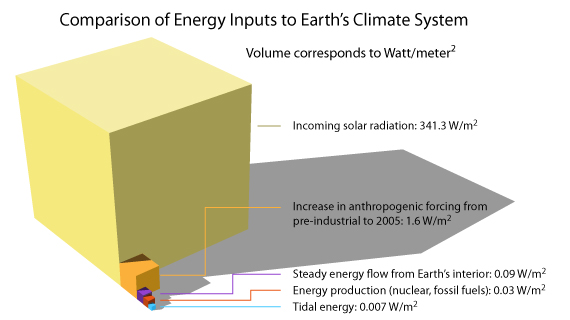
Figure 4: The volumes of the cubes are proportional to the magnitude of the energy flow from various sources. The solar irradiance is the incident energy, averaged over the area of the Earth (divided by four); irradiance varies over 11 year cycles and, at the top of recent cycles, can reach 341.7 Wm-2. The increase in anthropogenic forcing since pre-industrial times comes from the IPCC. The heat flow from the Earth’s interior is the 47 TW figure (see Figure 3 caption) averaged over the surface area. The energy flow from the human energy production is based on Flanner (2009). Tidal energy is the total energy input from the gravitational interaction between the Earth, Moon and Sun; a small part of this energy is included in the energy flow from the Earth’s interior (see below for further discussion).
The net increase in the amount of planetary energy flow arising from human activities (mainly the emision of carbon dioxide) since the industrial revolution is more than twenty times the steady-state heat flow from the Earth’s interior. Any small changes in the Earth’s heat flow over that time period—and there is no evidence for any change at all—would plainly be inconsequential.
Tidal Energy
From the Skeptical Science comments:
"Over the last two weeks I have been doing calculations on borehole data and this very convincingly supports the theory. We see different underground temperatures which are related to latitude, thus confirming that frictional heat (due to the moon) is being generated in the core, more at the equator than at the poles."
The spinning of the Earth, as well as the rotation of the Moon around the Earth and the orbit of both bodies around the Sun, do indeed have an impact on the energy of the Earth, through tidal friction. The ultimate source of this energy is the Earth’s rotation, to which the Moon and the Sun provide a gentle brake, resulting the generation of frictional heat and the slowing down of the Earth’s rotation (days were two hours shorter 600 million years ago). The Moon gains some energy from this interaction, being gradually boosted into a higher orbit above the Earth. The total Earth energy flow from tidal effects is about 3.7 TW (0.007 Wm-2 ), of which 95% goes into the familiar ocean tides and some 5% (0.2 TW or 0.0004 Wm-2) goes into Earth tides, which are small deformations of up to a few centimetres that occur on twice-daily or longer timescales. Earth tides contribute approximately 0.5% to the heat flow of the Earth.
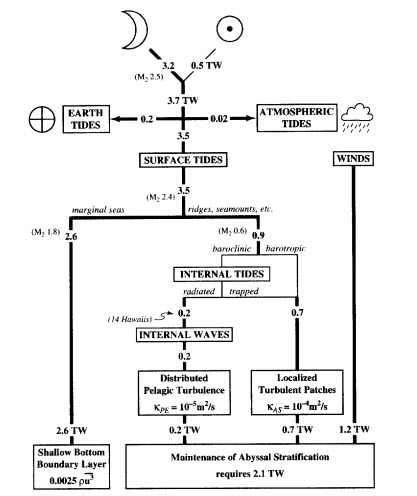
Figure 5: From Munk and Wunsch (1998) showing an “impressionistic” (their word) budget of tidal energy fluxes.
The energy from tides in the oceans is dissipated as heat in marginal areas (shallow waters) and around ocean ridges and seamounts (the “stir sticks” of the oceans). All of this energy is therefore added immediately to the ocean-atmosphere system. As for the Earth tides, the slight flexing of the crust and mantle is dissipated as heat there. This is a very small amount relative to the heat coming from radioactive decay and from the heat associated with the formation and differentiation of the Earth.
The amount of Earth tide energy flow, 200 gigawatts is miniscule by any planetary standard, it hardly varies at all over periods of millions of years and has no significant effect, globally or regionally, on the energy balance of the climate system.
Science isn’t always common sense
Diagrams such as the one below and its accompanying article make no mention of geothermal heat, tidal energy or “waste” heat from human fossil or nuclear energy use. Is this because its author, Kevin Trenberth, is negligent and unaware how big these sources of energy are? No, it’s actually because he knows how inconsequential they are.

Figure 6. The global annual mean Earth’s energy budget for 2000 to 2005 (W m–2). The widths of the columns are proportional to the sizes of the energy flows. From Trenberth et al (2009).
For example, on this figure, a line representing geothermal energy flow would have a thickness of 6 microns, the thickness of a strand of spider-web silk; ocean tidal energy, one-tenth of that; Earth tidal energy less than one-tenth even of that. Our intuitions tell us that earthquakes, volcanoes, geysers and tides are mighty forces of nature and, in relation to a human individual, they are. But compared to the transfers of energy within the climate system, they are too puny to merit consideration.
Updated on 2011-09-19 by Andy Skuce.
THE ESCALATOR

(free to republish)


