Climate Science Glossary

Term Lookup

Enter a term in the search box to find its definition.

Settings

Use the controls in the far right panel to increase or decrease the number of terms automatically displayed (or to completely turn that feature off).

Term Lookup

Settings


All IPCC definitions taken from Climate Change 2007: The Physical Science Basis. Working Group I Contribution to the Fourth Assessment Report of the Intergovernmental Panel on Climate Change, Annex I, Glossary, pp. 941-954. Cambridge University Press.

Home Arguments Software Resources Comments The Consensus Project Translations About Support

Bluesky Facebook LinkedIn Mastodon MeWe

Twitter YouTube RSS Posts RSS Comments Email Subscribe


Climate's changed before
It's the sun
It's not bad
There is no consensus
It's cooling
Models are unreliable
Temp record is unreliable
Animals and plants can adapt
It hasn't warmed since 1998
Antarctica is gaining ice
View All Arguments...


Username
Password
New? Register here
Forgot your password?

Latest Posts

Archives

IPCC graph shows accelerating global warming trend

What the science says...

All of the statements made in the IPCC report regarding the figure in question are correct and supported.

Climate Myth...

IPCC graph showing accelerating trends is misleading

"The IPCC’s Fourth Assessment Report, 2007, carries in three places a graph in which the Hadley Center’s global mean surface temperature anomaly dataset from 1850-2005 is displayed with four arbitrarily-chosen trend-lines overlaid upon it. At each place where the altered graph is displayed, the incorrect conclusion is drawn that because trend-lines starting closer to the present have a steeper slope than those starting farther back, the rate of warming is accelerating and that we are to blame." (Christopher Monckton)

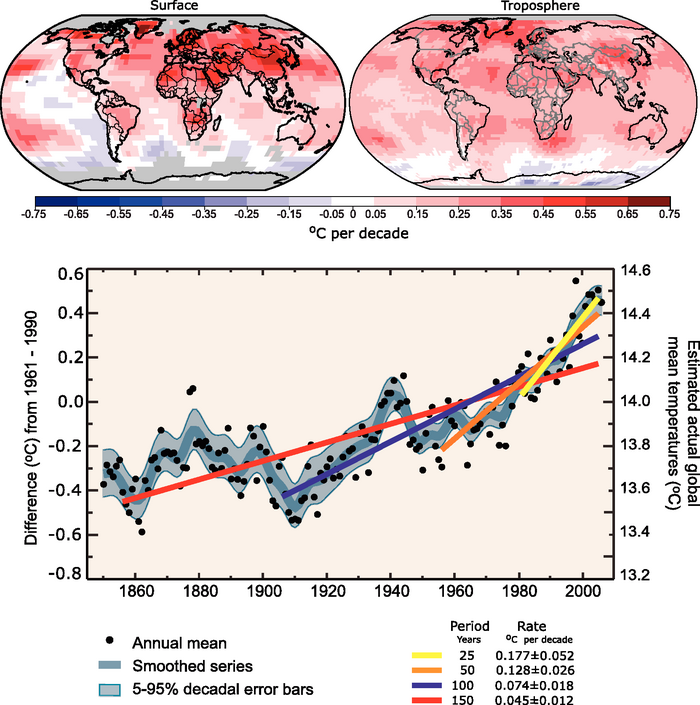
Some 'skeptics', most vocally Christopher Monckton, have taken issue with this figure from the 2007 IPCC report:
IPCC-graphic


Figure 1: Depiction of various long-term global temperature trends in the 2007 IPCC report

The figure is used in FAQ 3.1 and the Technical Summary of Working Group 1Monckton asserts that this graph uses a "fraudulent statistical technique" and

"At each place where the altered graph is displayed, the incorrect conclusion is drawn that because trend-lines starting closer to the present have a steeper slope than those starting farther back, the rate of warming is accelerating and that we are to blame."

This is simply a misrepresentation of the IPCC report.  The IPCC makes the following claims using this figure:

1)  The pace of warming accelerated over the course of the 20th Century. Notice the past tense.  Here is the specific claim (from the caption for Figure 1 of FAQ 3.1, emphasis added):

"Linear trend fits to the last 25 (yellow), 50 (orange), 100 (purple) and 150 years (red) are shown, and correspond to 1981 to 2005, 1956 to 2005, 1906 to 2005, and 1856 to 2005, respectively. Note that for shorter recent periods, the slope is greater, indicating accelerated warming."

2)  That the pace of warming over the last 25 years is greater than that in preceding years on the record.

3)  That the "... global average temperature has increased, especially since 1950."

All of these statements are true.  The IPCC does not state that the rate of warming continues to accelerate, and does not use this figure to claim that humans are to blame for the accelerated warming, although in the FAQ 3.1 figure caption, the IPCC does explain how we know humans are the cause of the acceleration:

"From about 1940 to 1970 the increasing industrialisation following World War II increased pollution in the Northern Hemisphere, contributing to cooling, and increases in carbon dioxide and other greenhouse gases dominate the observed warming after the mid-1970s."

Monckton's claims of a "fraudulent statistical technique" are without merit, and a misrepresentation of the IPCC report's actual content.

Last updated on 9 February 2012 by dana1981. View Archives

Printable Version  |  Offline PDF Version  |  Link to this page

Argument Feedback

Please use this form to let us know about suggested updates to this rebuttal.

Comments

Prev  1  2  3  4  5  Next

Comments 76 to 100 out of 123:

  1. Lest there be any great confusion about the selection of start and end years, as Helena implies, here's a couple of simple graphs that demonstrate the fallacy of her claims: The first image shows the gradient of all trends longer than 25 years that have an end date in 2005. Years the IPCC used for their example are marked with a red star. The pattern of generally increasing trend rate is obvious, and the red stars are obviously not cherry picks. The second image shows a similar thing, but for >25 year trends beginning in 1850, with the 25, 50, 100 and 150 year trends marked with an asterisk. First data point is 1850-1874 trend, last data point is 1850-2005 trend. This is what Helena suggested would be awkward. Y-axes are to the same scale. What is interesting here, is that the trends are once again generally increasing from about 1918 onwards. There are large variations in the 19th Century when coverage was poorer and there was no clear trend in global temperatures. Once you reach the 20th Century, when the rising trend in the actual data kicks in (and the data coverage is more-or-less global), you get the same pattern of increasing warming rate, thus accelerating actual warming. It is only a less pronounced increase because the time periods are longer in this 'wrong-way-round' graph.
  2. I expect this to be my last post on this issue. That is because Helena's misrepresentation of what I said, and her refusal to acknowledge that misrepresentation makes conversation with her, IMO, pointless. At best, she is simply not open to new ideas that do not suite her preconceived opinions. Reviewing Helena's claims, we find that first she claimed that Monckton was correct, even though she has argued her case on entirely different grounds to that used be Monckton. That means that even if she could establish her case, she would not establish that Monckton was "right", and her claim that he was remains false. Second, Helena argued that the claim in the original post that "(2) ... the pace of warming over the last 25 years is greater than that in preceding years on the record". When challenged, however, it was found that in all her supposed counter-examples, the trend in the 25 years to 2005 was in fact greater than that in her supposed counter-examples. Therefore her claim was false, and based simply on inadequate inspection of the data. The more significant claim that the data does not support the categorical assertion of (2), but only the very qualified assertion that "on balance of probabilities" or, in the IPCC's jargon, "it is more likely than not" that the 25 year trend to 2005 is larger than any prior 25 year trend in the instrumental record. Of more concern to me is that it is not even clear that the IPCC ever asserted (2). The closest I can find to their asserting that is the assertion that,
    "An increasing rate of warming has taken place over the last 25 years, and 11 of the 12 warmest years on record have occurred in the past 12 years."
    (IPCC FAR, WG1, FAQ 3.1, My emphasis, note the tense.) This, however, is an assertion of increasing warming, not of a greater rate of warming than any comparable period. In other words, it merely reasserts the claim of accelerating warming in different words. I would be interested to see if anyone can find an actual assertion of (2) by the IPCC. Failing that, the OP should be updated to correct this potential error. I recall (vaguely) having some input into this post, and therefore bear some responsibility for this error, if error it is. For that I apologize. Finally, Helena continues to insist that a pattern of increasing trends with decreasing trend length can never be evidence of an accelerating trend. Her claim is, frankly, is nonsense. To see this, consider a smooth, and accelerating curve, ie, a curve whose slope is steeper at later times than it is at any earlier time. We can express this mathematically by saying the curve satisfies the condition that slope(t) < slope(t+x) for all x greater than 0. The second curve in the figure below gives an example of such a curve. A decelerating curve shows the opposite pattern, ie, the slope at any time t is greater than the slope at time t + x where x is greater than 0, bearing in mind that large negative numbers (and hence negative slopes) are smaller than small negative numbers and positive numbers. (Common language and intuitions are sometimes confused on this point.) The first curve in the figure below is an example of a decelerating curve. However, as the reasoning is parallel in both cases, I will not discuss it further. A linear trend is a type of average of the slopes of a curve. It is not the same as the mean of the slopes of a curve, or the mode, but it is an average never-the-less, and consequently has some of the properties of averages. One of those properties is that if you include more low value terms, ie, if the curve has more low slopes, the linear trend will be lower. In contrast, if you include more high value slopes, the linear trend will be higher. If you have an accelerating curve, with no noise, and take trends of successive periods, each being a whole number multiple of some value (say, 25 years), and each terminating at the same point, an interesting thing occurs. Whatever the value of the first trend you take, the second trend will include all the data points of the first, plus some some additional points. Because the trend is accelerating, these additional points will have a lower value than the original points (by definition of accelerated). Therefore the calculated trend of the larger interval will be lower than than the calculated trend of the smaller interval. This point follows by logical necessity. It is true of any accelerating curve segments with no noise. Therefore for any such curve segments, finding this pattern is sufficient proof that the segment is accelerating. Please note that Helena has repeatedly contradicted the bolded claim above. She has done so with no supporting argument, and he contradiction of that claim represents the bedrock of her case. It also logically indistinguishable from a simple assumption that no curve is accelerating. Of course, the temperature curve is not a curve with no noise. When you introduce noise, an interesting thing happens. Suppose the noise in the signal is so small relative the signal that it cannot be distinguished from the arc of the curve as drawn on a graph. Then clearly the reasoning above will still apply. In contrast, if the noise is very large relative to the curve segment, the reasoning will not apply. That is because most of the data in each successive period will be noise rather than the underlying curve. Therefore this method of detecting acceleration will only work when the signal to noise ration is large, or stated alternatively, when the difference in the trends of successive intervals is a sizable fraction of the 2 sigma confidence interval (and ideally, larger than it). There are a couple of important nuances to this argument. The first is that if your "curve" consists of two straight line segments meeting at a particular point, and if your successive trends all overlap that point, this method will still show the curve as accelerating. This is not a flaw. The "curve" has in fact accelerated. It has just done so at a precise point rather than continuously and smoothly. Therefore this test does not detect accelerating curves per se, but acceleration within a curve. Second, like all statistical tests, this test does not test for what the data will do outside the segment tested. A curve may repeatedly, and at regular intervals, accelerate than decelerate as with a sine curve. If you test the appropriate segment, you will find the acceleration that is actually occurring by this test, but it will not tell you whether the acceleration will continue, stop, or reverse. Of course, the IPCC does not claim, based on this test, that the acceleration will continue. The claim that it does is a key misrepresentation by Monckton, discussed in the OP.
  3. Erratum : "IPCC does neither constraint the slope of the trends (they just have to be increasing) nor the form of the underlying function (as it is what they want to infer)." Please read : "IPCC does neither constraint the slope of the trends (they just have to be *greater than the longer one*) nor the form of the underlying function (as it is what they want to infer)." They do not have to be increasing, just greater than the previous one.
  4. Tom : Moreover, the example you give of decreasing accelerated curve is a very specific one, part of the "punctual counterexemples" i said would exist because you take it all smooth with no noise or bumps. However, the larger subset of all decreasing decelerated curves contains much more curves that *do* have increasing trends with shorter time periods. Any noise, any bump (i.e. anything but the ideal case you present) will tend to ensure that what i say is correct. Do you agree with that ?
  5. "Therefore this test does not detect accelerating curves per se, but acceleration within a curve." Ahah, we're getting there.
  6. Helena, you're really not making much sense. Progressively increasing or decreasing gradients of the lines prove concavity of the curve, as opposed to it being flat or curved the other way. The same applies for 'decelerating' curves, whether you like it or not. They don't say anything about the specific function that best fits the curve - there may be a single breakpoint where the temperature accelerated, or it may smoothly 'accelerate', but it demonstrates that the rate of temperature increase is faster now than it was earlier in the last century. Noise may temporarily disrupt the pattern, but as you'll see from my graphs above, the pattern for HadCRUT3 is one of progressive acceleration. It says nothing about the future evolution of the temperature profile either - that depends on the balance of forcings of course. But the IPCC was quite justified in using this example, and you have provided no coherent reason why it is an illusion, rather than a simple illustration of the obvious.
  7. "Helena" sounds like Girma Orssengo.
  8. Helena#78: "where did we say that we were considering increasing functions ?" Here, where you agreed the curve under discussion is concave up. Here, where you agreed with 'increasing and accelerating', which I re-stated here. And here. This is now straightforward: a. If the temperature function over the period in question was increasing and linear, there would be no change in slope regardless of the interval used. b. If the temperature function was increasing and accelerating (which you agree means concave up), slopes starting in later periods would be greater (more positive) than slopes from periods starting earlier. Here is an illustration of this from first-year calculus: The slope of the line crossing the curve at x=1 is the smallest. Subsequent lines have increasing slope. Subsequent lines cross the curve at x>1. The slope of the last line shown (purple) is calculated from a very small interval around x=2 and is the largest. Work it backwards: the pattern of lines is sufficient to infer the shape of the curve. To insist otherwise at this point suggests you have an interest in prolonging this agonizing (and frankly uninteresting) back-and-forth.
  9. Helena's pretentious "I'll teach you guys what I mean by my genius" attitude, combined with a very thorough lack of clarity and an unwillingness to reason -- only to lecture and malign -- suggests a trollish behavior that does not warrant feeding. You be the judge whether or not you think this is an accurate portrayal, but to me pursuing this conversation simply lets the troll grow larger and larger, until it breaks the very bridge it lives beneath.
  10. skywatcher - Those are very informative graphs; well worth including in the main post on this thread. As multiple posters have noted, a linear trend increasing over time is a clear indicator of acceleration (with, albeit, increasing variations for shorter time periods, as seen in skywatchers graphs). Helena's objections are mathematically unsupportable, and the constant repetition is simply (IMO) trolling. And, returning to the original subject, Monckton's objections to the IPCC graph are in one sense incorrect (acceleration is definitely shown), and in another a strawman argument (the IPCC did not base the conclusion of anthropogenic influence on this graph).
  11. I also do not like that figure from IPCC. I think it is comparing apples to oranges when trend lines over 150 years are compared with 25 year trend lines. Skywatchers graphs do the same, i.e. comparing trends over longer times with trends over shorter times. Consider replacing the trend with the mean. Would it make sense to compare the mean of the temperature over the last 150 years to the mean over the temperature over the last 25 years? What I would do is to calculate ALL 25 years trend over the entire lenght of the series, then plot these vs. end year. In that way, trends of equal lenght are compared I had already the code ready for this, using annual data for HadCru I get this plot, click to enlarge: The 25 year trends are increasing up to 2005 (marked by a vertical line), from there on they are decreasing. However, the trends after 2005 are still positive and significant, so warming is indeed continuing. Error bars shown are not corrected for autocorrelation. In general, I do not like the concept of calculating trends on more or less arbitrary subsets of the data. Another approach using all the data to fit a generalized additive model is outlined by Gavin Simpson in a blog post here. Using the code provided I have updated his graph, and it shows a significant warming until 2003, and continued but not significant warming from 2003 to 2011:
  12. My last message here : you know my stand, it's useless to discuss it further, and (-snip-) Skywatcher : "Progressively increasing or decreasing gradients of the lines prove concavity of the curve" Gradients prove concavity yes, but 4 trends calculated on different time scales no. That's my whole point. Muon : I agreed to those three points (he yes/no questions) with .... you ! Not the IPCC ! There is no yes/no question in the legend of the IPCC graph, right ? You cannot start from saying it's an accelerated warming, then plot the 4 trends and say "well, the 4 trends increase, that surely indicates accelerated warming", that would be circular reasoning. What you must do is start with 4 increasing trends, not knowing anything else. What can you conclude from that ? My stand is : not much. KR: "As multiple posters have noted, a linear trend increasing over time is a clear indicator of acceleration " First, please note that Tom Curtis said : "Therefore this test [linear trend increasing over time] does not detect accelerating curves per se, but acceleration within a curve" You got 4 linear trends calculated. Can you really conclude or infer that the underlying curve depicts an accelerated warming ? SRJ : I support your method and i think your comment should replace or be added to the article on this website. It's sad the IPCC didn't use it and instead used one that can be rightfully criticized...
    Response:

    [DB] "It's sad the IPCC didn't use it and instead used one that can be rightfully criticized..."

    As many have already pointed out, you have not "rightfully" proved this assertion.

    Tone-trolling snipped.

  13. Helena, Just a thought, but trends ending at the current time tell you about the change in gradient (i.e. curvature) around the current time. Trends starting at (say) 1860 give you an indication of the change in gradient (i.e. curvature) around 1860, not the present date (note that the two differet sets of trends have a different common point, one is "today", the other is 1860). Hence it is no big surprise that the analysis gives a different result.
  14. The reservation I have about the IPCC graph is that a linear model is obviously not appropriate for timespans greater than 30 years or so, because of changes in forcings means that the residuals have structure, and so violate the modelling assumption. Not that big a deal as the fact is clearly evident in the plot and nobody is drawing any firm statistical conclusions from it. However the diagram is in a FAQ and is not intended to be part of the IPCC's scientific explanation or evidence of anything. It is obviously intended as an illustration designed to convey a basic point, which is that the rate of warming has been accellerating. There is a difference between the FAQs and the body of the report and Monckton surely knows that.
  15. SRJ wrote "and continued but not significant warming from 2003 to 2011" This is such a short period that one would not expect the observed trend to be statistically significant, even if it continued at the previous rate or even slightly higher. Looking at it the other way, there is no statistically significant evidence that the warming from 2003 to 2011 was less than from (say) 1980 to 2003.
  16. Well, having followed this dialogue; I think it's worth letting the various contributors know that, frustrating as it may be, the general flow has been educational... Just how someone thinks SRJ analysis is a good approach to the acceleration question and yet fail to acknowledge skywatchers contribution is, let's say, baffling.
  17. les : "Just how someone thinks SRJ analysis is a good approach to the acceleration question and yet fail to acknowledge skywatchers contribution is, let's say, baffling. " skywatcher76 graph and method are already much better than the IPCC method, but they still have two flaws : - for science reasons : his method implies comparing different trends, thus having the problem of flattening long trends as you can see in the two graphs. You're then really not comparing the same thing (the slope of different trends) on the same graph as the slope is itself a function of the time period. His graphs seem to be 1D functions slope(t), but in fact they really are 2D functions slope(t,T). You would need to correct his graph for T. - for communication reasons : a decreasing decelerated temperature would look the same as his first graph (you would just be starting in the negatives), which is not very good if you want a clear picture. SRJ method addresses those two problems. (sorry for this last last message, but les was new to the discussion and had kind words on saying it was an interesting one)
  18. ... that's why when you start in 1850 (his graph2) the full 150yrs trend is so low even though you've just "added in" the massive 1970-2000 increase : the increase gets diluted by T. In the same way, when you start in the present (his graph1 and the IPCC), you're not being "fair" to the past as its trend gets mechanically diluted. You "force-flaten" long trends. That's why you can't compare trends that have different T.
  19. Helena/SRJ If you fit a linear model to the trends computed by SRJ, it will slope upwards, which implies that the rate of warming has increased over the period 1850-present, i.e. warming has on average been accellerating. As far as I can see SRJ's method is in agreement with the the IPCC diagram.
  20. # 90 Dikran I agree completely with your last statement. But please note that my statement you quote was not about linear trends but about the significance of the locally fitted generalized additive model. It is not an attempt to use only the 2003-2011 data, I just simply state the fact that the fitted model is not showing an significant increase after 2003. But it is still increasing. If you read Gavins Simpsons blog post he notes that the model is significant until 2005, but with the addition of the slighly cooler year 2011, the significance only extends to 2003. What I tried to emphasize was that the lack of statistical significant warming does not mean that there is no warming, basically I was summarizing Gavin Simpsons comment about the graph: "The derivatives suggest two periods of significant increase in temperature (at the 99% level); during the inter-war years and post ~1975. The second period of significant increase in global annual mean temperature appears to persist until ~2005. After that time, we have insufficient data to distinguish the fitted increasing trend from a zero-trend post 2005. It would be wrong to interpret the lack of significant change during periods where the fitted trend is either increasing or decreasing as gospel truth that the globe did or did not warm/cool. All we can say is that given this sample of data, we are unable to detect any further periods of significant change in temperature other than the two periods indicated in blue. This is because our estimate of the trend is subject to uncertainty." # 91 les I think that Skywatchers contribution suffers from the same problem as the IPCC graph, namely comparing trends over periods of different length.
  21. SRJ, one must be very careful of mentioning statistical significance in the climate debate as it is very widely misunderstood. Over short timescales it is meaningless to say that the trend is statistically insignificant as this will be the case purely because there is insufficient data in the period to reliably asses what the trend actually is. If you do specifically point out that something is not statistically insignificant then it is important to also mention whethe the power of the test is sufficiently high for the lack of statistical significance to be meaningful or even surprising. Unless you do this, then there will be those who misinterpret the significance of insignificance! ;o)
  22. # 94 Dikran I don't think it will be useful or meaningful to fit a a linear model since these trends are extremely autocorrelated as they have so much data in common. I. e. the data point for 2010 is estimated from the period 1986-2010 while the data point for 2011 are estimated over the period 1987-2011, to they have 24 common years. And yes, my graph shows that the 25 year trend has increased since 1850-1874. It also shows that around 1940 the 25 year trend were as high as today. That does not contradict IPCC, my graph are just showing more details about 25 years trend. In fact, doing my analysis with the other timespans IPCC also use shows: 50 yrs trends: Increased since 1850-1899, around 1940 as high as today 75 yrs trends: Increased since 1850-1924, recent trends are highest observed 100 yrs trend: monotone increase since 1850-1950, but in recent years they have stabilised In agreement with IPCC - but I still don't like that graph
  23. # 96 Dikran I think we are talking past each other. The fitted model is statistical significant over the 2 periods mentioned in the quote from Gavin Simpson. The model is estimated from all data so I do think it makes sense to say it is insignificant from 2003 on. Because the model for the period 2003-2011 is estimated from more data than just these few years. But I am coming a bit out of my depth so I will refer you the blog post I mentioned and the documention for the mgcm package: http://stat.ethz.ch/R-manual/R-devel/library/mgcv/html/gamm.html http://stat.ethz.ch/R-manual/R-devel/library/mgcv/html/s.html My reason for my original statement "and continued but not significant warming from 2003 to 2011" was exactly that I didn't want people to interpret the lack of significance as indication of no warming. And I do think that we can agree on that? I
  24. SRJ - If your concern is autocorrelation, I would suggest looking at the SkS Trend Calculator, which calculates uncertainties including autocorrelation effects, using the techniques of Foster and Rahmstorf 2011. Period ____ Trend GISTEMP 1980-2005 _ 0.156 +/-0.051 C/decade 1955-2005 _ 0.123 +/-0.023 C/decade 1905-2005 _ 0.071 +/-0.011 C/decade 1855-2005 _ 0.059 +/-0.007 C/decade Even with autocorrelation uncertainties the increase in trends is quite notable. All of this kerfluffle, however, is really over such a tiny point. Monckton was incorrect over the observed acceleration in warming, and in his strawman argument (as the IPCC conclusion of anthropogenic influences was not from this graph). This graph is merely an illustrative demonstration of "simple fits" to the temperature record (as per the IPCC illustration). Personally, I would consider this illustration (a) quite supportable as the simple demonstration it is, and (b) most definitely not the basis of conclusions about anthropogenic warming.
  25. # 99 KR You misunderstood me, I was referring back to Dikran in post 94 where he suggested fitting a linear trend to the trend estimates from my plot in post 86. Those trend estimates are autocorrelated since they have so much data in common. I should have stated clearer in my post 97 that it was about autocorrelation between the trend estimates of post 86 rather than autocorrelation of the temperature anomalies themselves. The trends you are calculating are again for time periods of different length, and as such comparing apples to oranges. What I would do is to compare trends calculated over time spans of equal length, e.g. 100 years. Using the SKS Trend calculator here is how I would do it: Period _____ Trend Hadcrut3 1850-1950: 0.023 ±0.013 °C/decade (2σ) 1875-1975: 0.034 ±0.013 °C/decade (2σ) 1900-2000: 0.065 ±0.012 °C/decade (2σ) 1912-2012: 0.074 ±0.012 °C/decade (2σ)

Prev  1  2  3  4  5  Next

Post a Comment

Political, off-topic or ad hominem comments will be deleted. Comments Policy...

You need to be logged in to post a comment. Login via the left margin or if you're new, register here.

Link to this page


The Consensus Project Website

THE ESCALATOR

(free to republish)


© Copyright 2024 John Cook
Home | Translations | About Us | Privacy | Contact Us