Global ice melt is accelerating
What the science says...
| Select a level... |
 Basic
Basic
|
 Intermediate
| |||
|
Arctic summer sea ice has shrunk by an area equal to Western Australia, and might be all gone in a decade. |
|||||
Climate Myth...
Ice isn't melting
Thanks to a rapid rebound in recent months, global sea ice levels now equal those seen 29 years ago, when the year 1979 also drew to a close. In fact, the rate of increase from September onward is the fastest rate of change on record, either upwards or downwards. The data is being reported by the University of Illinois's Arctic Climate Research Center, and is derived from satellite observations of the Northern and Southern hemisphere polar regions (Daily Tech).
Ice is melting at accelerating rates in the Arctic, Antarctica, Greenland, and glaciers all over the world.
Ice sheets are beginning to shrink
An ice sheet is a huge layer of land ice. The only ice sheets are in Antarctica and Greenland.
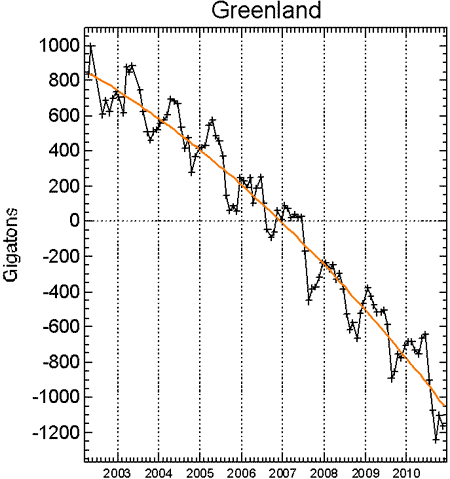
The Greenland ice sheet is losing mass at an accelerating rate. In recent years the ice loss has spread from the south coast around to the northwest.

(Image source: Climate Signals.)

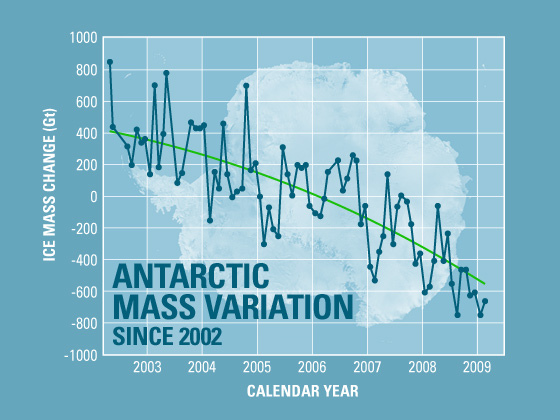
Similarly, Antarctica is also losing ice at an accelerating rate. Antarctica is basically divided into two distinct ice sheets, the West Antarctic and East Antarctic. The East Antarctic ice sheet, which is much bigger than the West Antarctic one, was until recently considered stable, but has also begun losing ice.

(Image source: NASA.)
Ice shelves are collapsing
Ice shelves are thick, floating platforms of ice formed when glaciers flow from the land onto the ocean surface.
The Antarctic Peninsula is warming rapidly. Several ice shelves have collapsed completely,including one covering 3,250 km2, almost twice the area of urban Sydney.

(Image source: National Snow and Ice Data Center.)
Glaciers are retreating
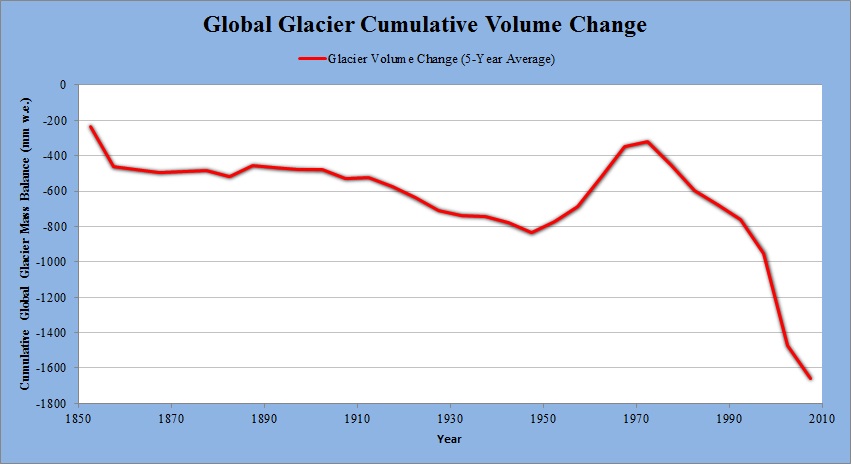
Glaciers are retreating around the globe. Although one can point to particular glaciers that are growing, glaciologists look for trends in the total mass of glaciers worldwide. It turns out the world’s glaciers are losing ice at an accelerating rate.

(Image data source: Cogley 2009.)
And despite all the hype about a certain mistake in the 2007 IPCC report, the Himalayan glaciers are in fact melting.
Southern sea ice not doing much
Sea ice floats on the ocean surface, and is not to be confused with ice sheets on land. Even though the Antarctic ice sheet is losing mass, the extent of sea ice around the coast of the continent has grown slightly.
This is because of a complex variety of factors, and despite the warming of the Southern Ocean. The trend is expected to reverse in coming decades as the Antarctic continues to warm.
Arctic sea ice in a death spiral?
Arctic sea ice grows and shrinks seasonally, with an annual minimum in September. In 1979, when satellites first measured it, September Arctic sea ice extent was roughly equivalent to the area of Australia. Since then it has declined by about a third, equivalent to losing Western Australia – outstripping all projections.

(Image source: Copenhagen Diagnosis.)
2010 had the third lowest minimum on record (after 2007 and 2008). Two expeditions successfully circumnavigated the Arctic Ocean in a single summer, something that would have been impossible just a few years earlier or any time in recorded history.
Contrarians claim Arctic sea ice has “recovered” since the record low extent of 2007. But sea ice exists in three dimensions, and it has continued to thin rapidly. Ice volume data paints a picture even more dire: the Arctic has actually lost not one third but two thirds of September sea ice. What’s more, the volume reached a record low in 2010 – not an encouraging sign of recovery.
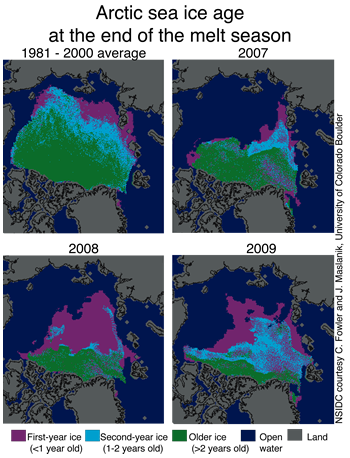
2010 set the stage for continued melting. At the end of the summer, a record-breaking 86% of ice cover was less than two years old; ice older than five years has all but disappeared. The remaining new ice is thinner and much easier to melt than older ice.

(Image source: National Snow and Ice Data Center.)
Ice-free summers are now probably inevitable, but it’s not clear how soon because the Arctic is melting much faster than any model predicted. Mark Serreze, Director of the US National Snow and Ice Data Center, says we’re “looking at a seasonally ice-free Arctic in twenty to thirty years.” A few scientists argue that September sea ice could be essentially gone within the next decade.
Basic rebuttal written by James Wight
Update July 2015:
Here is a related lecture-video from Denial101x - Making Sense of Climate Science Denial
Last updated on 13 July 2015 by MichaelK. View Archives


 Arguments


Does anyone track global snow/ice extent and relate it to albedo? I read in http://en.wikipedia.org/wiki/Stefan-Boltzmann_law#Temperature_of_the_Earth that the earth's albedo is 0.3. This means we can multiply the energy coming in by 0.7.
Could increase in air temperature be accurately predicted by the decrease in albedo?
SB, I don't know of anyone tracking it, but tamino did a post a few years ago on it, and SoD has a variety of posts on it.
Would all the melted glacier ice dumping into the oceans artificially slow the temperature elevation of the ocean? Like a glass of ice tea in the sun, will the temp rise of the ocean accelerate after all the ice melts?
Lawrence Tenkman @11,
The Ocean Heat Content measured down to 2000m is increasing at a rate in excess of 10Zj/year due to AGW. The global loss of ice mass is subject to a lot of variation year-to-year but to put some numbers down:-
Sea Ice Arctic Sea Ice loss (from PIOMAS) averages 350Gt/y since 2007. Antarctic Sea Ice Volume is poorly assess but probably insignificant. (The small Antarctic areal increase to 2004 graphed in the OP was very minor. It became more pronounced for a while 2014-16 before plunging negative where it remains. The graph here is from NSIDC.)
Land Ice The dramatic acceleration of polar land ice in the OP graphs has not been maintained. With GRACE-FO beginning to give results (graph of Greenland mass balance), the recent combined rate of loss of global land ice has been assessed as something like 650Gt/year.
So the global ice loss is roughly 1,000Gt/year.
In terms of the energy to warm the resulting melt water up to average ocean temperatures, something like +4ºC, would require 0.015Zj/year, significantly less than the 10Zj/year annual increase in OHC. Energy to warm melt-water is also significanlty less than the energy required to convert that amount of ice into the melt-water (0.30Zj/year) but ocean-wise that would only affect icebergs melting out while bobbing on the briny sea.
Where all this melt water will play more of a role in global climate is it being fresh water and not briny. Note that the Greenland rate of gross ice loss is probably five-times greater than the rate of net ice loss and there is a lot of other fresh water entering the oceans from rivers and also the annual sea ice melts, but fresh water is more buoyant than ocean water and increases in the discharge of fresh water into the oceans can disrupt deep ocean currents, the AMOC (which brings warmth to the high Atlantic) being of particular concern.
MA Rodger,
I really liked your link on 650 GT/yr ice loss. It was informative and easy to read.
Per Velicogna et al 2020 - Continuity of ice sheet mass loss in Greenland and Antarctica from the GRACE and GRACE Follow‐On missions:
Both the Greenland and the Antarctic Ice Sheets continue to lose ice mass from April 2002 through September 2019.
Greenland Ice Sheet average mass loss:
Antarctic Ice Sheet average mass loss:
https://agupubs.onlinelibrary.wiley.com/doi/abs/10.1029/2020GL087291