Climate Science Glossary

Term Lookup

Enter a term in the search box to find its definition.

Settings

Use the controls in the far right panel to increase or decrease the number of terms automatically displayed (or to completely turn that feature off).

Term Lookup

Settings


All IPCC definitions taken from Climate Change 2007: The Physical Science Basis. Working Group I Contribution to the Fourth Assessment Report of the Intergovernmental Panel on Climate Change, Annex I, Glossary, pp. 941-954. Cambridge University Press.

Home Arguments Software Resources Comments The Consensus Project Translations About Support

Bluesky Facebook LinkedIn Mastodon MeWe

Twitter YouTube RSS Posts RSS Comments Email Subscribe


Climate's changed before
It's the sun
It's not bad
There is no consensus
It's cooling
Models are unreliable
Temp record is unreliable
Animals and plants can adapt
It hasn't warmed since 1998
Antarctica is gaining ice
View All Arguments...


Username
Password
New? Register here
Forgot your password?

Latest Posts

Archives

Review of Rough Winds: Extreme Weather and Climate Change by James Powell

Posted on 23 September 2011 by Anne-Marie Blackburn
Book cover for Rough WindsThe perennial question following any extreme weather event is whether climate change is responsible for the event in question. Until recently, the short answer to this question was 'No' but recent findings suggest that this answer needs to be refined. It is still not possible to state categorically that climate change has caused a specific event, and natural variability continues to play a key role in extreme weather. But climate change, through rising temperatures and water vapour levels for example, is changing the odds of extreme events occurring. The last couple of years have certainly seen a large number of extreme events take place, from the floods in Queensland, Colombia, Pakistan and Sri Lanka, to the droughts in Texas, Australia, China and the Amazon, and record-setting high temperatures in countries that cover approximately one-fifth of the Earth's surface. Wildfires, snowstorms, tornadoes and hurricanes have also made the headlines in a number of countries. This has led to the appearance of new expressions: 'global weirding' and 'a new normal'.

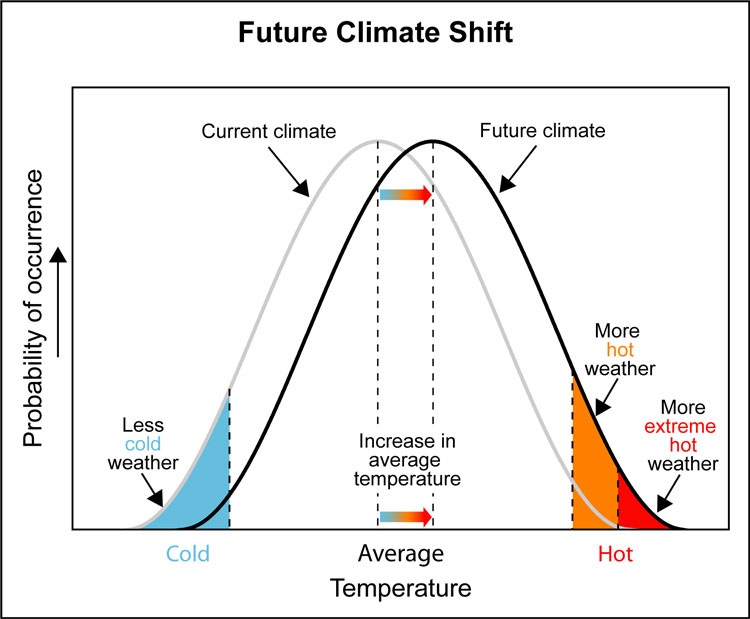
It is within this context that Dr James Powell, whose book 2084: An Oral History of the Great Warming is reviewed here, aims to find out whether there is now a 'preponderance of evidence' showing that climate change is truly under way, a situation which he argues warrants a response. He focuses on extreme weather for a number of reasons. Weather is what we experience on a daily basis and is therefore more tangible than some vague notion of climate change in distant countries or futures. Additionally, extreme weather can prove very costly in terms of lives, livelihoods and infrastructures, and we therefore all have a stake in taking preventative measures. Finally, and perhaps most importantly, increases in the occurrence of events such as extreme temperatures are the best harbingers of climate change. This is clearly illustrated in figure 1 below. With this in mind, the author frames the issue as one of risk management and compares it to the insurance industry: we take out insurance not because of a high probability of fire or burglary, but because we stand to lose a lot if we are uninsured and such an event takes place. Similarly, Powell argues, increasing and/or intensifying extreme events would require action to be taken - we should aim to 'avoid the unmanageable and manage the unavoidable'.
Climate shift

Figure 1: Bell curve showing how an increase in average temperatures leads to an increase in hot and extreme weather. Note also that this doesn't mean there'll be no more cold weather: these cold events will become rarer but will not disappear. Source: US Climate Change Science Program / Southwest Climate Change Network 

After providing some background on recent events in the prologue, the author explains the science behind climate change and its possible links with extreme weather. This is an important step as it begins to answer the question 'Why are scientists predicting that global warming will cause intensifying and/or increasing extreme weather events?' This then provides a platform from which to analyse and look at the specifics behind recent events. In doing this, Powell shows how science proceeds from a testable hypothesis whose basis, in this case, lies in basic physics: rising temperatures should lead to an increase in water vapour levels. In turn, this additional heat and moisture should provide the perfect setting for the development of more, and more intense, storms. And so the stage is set: the hypothesis and assumptions are described and the case can now be built block by block.

The book is then organised in short chapters that each tackle a specific event or related extreme weather events - heat, drought, fire, rain and snow, floods, tornadoes, and hurricanes. Powell is meticulous in his research and these chapters read like investigative reports, looking at events and placing them in their historical context, before looking at the evidence that helps determine whether climate change has played a role. And like all good scientific reviewers, the author is not afraid to discuss scientific uncertainties and diffculties which make attribution studies such a complex task. But this is more than a simple description of the mechanisms behind extreme weather. Powell discusses the resulting damage and suffering inherent to such events. This helps bring the message home: extreme events are more than abstract physical phenomena. They are some of the most destructive disasters than can hit you, and their toll can reach tens of thousands of deaths and billions of US dollars. If the overall impact of events paints a bleak picture, the personal stories are particularly harrowing. Unlike 2084, these are events which have already taken place and wreaked havoc on the lives and livelihoods of thousands of people. And Powell's personal account of the 1988 Yellowstone National Park fires somehow makes these events more tangible, particularly if you are lucky enough to never have faced such destructive forces.

Powell also addresses issues that have arisen, or could arise, from the responses and management of extreme events. For instance, the action taken by the Army Corps of Engineers to manage the 2011 Mississippi floods could have led to the river reverting to its alternate course, through the Atchafalaya Basin, an event which would have considerable impacts on downstream communities and shipping. Clearly, this did not happen this time, but should we run the risk of causing such a change again, or do we need to think of alternative solutions to manage future problems? Also, during the heatwaves in Europe (2003) and Russia (2010), people lost their lives because they did not know that they had to drink more water in warmer conditions or because they drowned after drinking alcohol. This clearly shows that simple measures, such as awareness campaigns, could yield significant results and allow us to protect ourselves against the worst effects of such events, which helps to address the issues behind 'managing the unavoidable'.

But the overall strength of his argument lies perhaps in the evaluation of predictions made by climate scientists. With rising water vapour levels now observed, is the expected increase in extreme precipitation events already noticeable? It appears so: analyses of US and northern hemisphere precipitation show just this. Similarly, changes in the timing of snow melt, and rising sea-surface and air temperatures have been implicated in wildfires, droughts and heatwaves. But at no point does Powell claim that climate change alone is responsible for all events in recent years. This is particularly true of tornadoes and hurricanes. Not only does he clearly state the uncertainties, he also points out other factors, such as river engineering projects, La Niña and forestry practices, that have played major, sometimes predominant, roles in some of the events he discusses. This is openness at its best, a way of pre-emptively answering those critics who tend to cherry-pick details and miss the whole picture when evaluating climate-related evidence.

So does Powell manage to answer the questions he sets out to answer, namely whether there is now a 'preponderance of evidence' that climate change is under way? He certainly makes his position clear: for him, there is already enough evidence to take action and prevent the worst from occurring. It is difficult to argue against this. Of course, extreme events have always occurred, without the help of humans, but it is the number of recent record-breaking events or worst events in decades that should make us stand up and take note. These come on top of trends that show rising global temperatures, melting Arctic sea ice, retreating glaciers, rising sea levels, and migrating species. All of this is consistent with what we expect from climate change. So do we now wait until we have absolute proof, which probably means leaving it too late to 'avoid the unmanageable', or do we start addressing the root cause of all these changes?

Rough Winds was released as a Kindle Single and is currently at #3 under Earth Science. The good news is that you don't need a Kindle to read it - you can download apps to read it on PC, Mac, iPhone/iPad and Android. With the Horn of Africa and Pakistan experiencing severe drought and floods, respectively, as well a new La Niña possibly on its way, this is a timely book that I thoroughly recommend.

Download Rough Winds from Amazon.

0 0

Printable Version  |  Link to this page

Comments

Prev  1  2  3  4  5  

Comments 201 to 235 out of 235:

  1. Norman#199: " I have experienced no changes on notice " You do realize that with that statement, your position is reduced to the equivalent of 'if I can't see it from my window, it's not happening'? Further discussion of 'if its not happening to me, its not happening' is irrelevant.
    0 0
  2. #188, Norman, the jury is out on whether blocking will be increased by global warming. It is the primarily the uneven nature of natural factors like low solar UV that make them more prone to enable blocking. The blocking phenomenon itself is weather. Both Trenberth and Lindzen among many others studied it early in their careers with Trenberth focusing on differential heating and Lindzen on resonanace. It is certainly plausible as Albatross points out in 193 that global warming will enhance differential heating although the opposite is also plausible. Looking at it top down, some solar variations like low solar UV have a significant association with blocking mainly due to differential heating of the stratosphere. The tie to extreme weather seems to be at least twofold. First the heating from CO2 will exacerbate hot weather and droughts. Second the CO2 will also increase differential heating since it has more effect in hotter, drier than in cooler, wetter areas. That in turn causes an enhancement of the blocking as the troposphere resonates with the stratosphere. Lindzen: http://www-eaps.mit.edu/faculty/lindzen/85thst~1.pdf
    Trenberth: http://www.cgd.ucar.edu/cas/Trenberth/trenberth.papers/i1520-0469-042-22-2415.pdf
    0 0
  3. Norman - "...but I have experienced no changes on notice as the weather in Omaha is already more extreme than many other locations. As I stated the purpose of the data I posted was not an attempt to prove or disprove the content of James Powell ebook." Then the question is: Why are you posting it? Why post iteration after iteration (and so on) of anecdotal evidence? Because it certainly looks like you are arguing that increasing extreme weather cannot be proven - with lots of cherry-picked incidents, but no statistical or trend analysis. You have repeatedly denied making such an argument - but you repeatedly keep on doing so. If you aren't seeing changes in extremes in your locale, That's great, and I wish you continued good fortune in that as long as possible. I would not, however, have high confidence in such luck. Local weather is not a good prognosticator. Do rates of extreme events show statistically significant changes? Powell seems to feel so, based upon a great deal of experience and extended global data, which he carefully examines. You seem not to, based upon personal experience and some limited, selected data (which appear, quite frankly, to show confirmation bias on your part). Personally, I think Powell's case is a heck of a lot stronger than yours. You can certainly continue to hold to your position. But until and unless you address the limits of the data you are selecting from, you're not proving anything. If you are arguing against evidence for increased extreme events, you are doing a poor job of it. If you are not, you are giving a strangely consistent impression of someone arguing just that... --- As a Nebraska resident, you might be interested in this 1998 EPA paper (a bit dated, but...) on Climate Change and Nebraska: "...based on projections made by the Intergovernmental Panel on Climate Change and results from the United Kingdom Hadley Centre’s climate model (HadCM2), a model that accounts for both greenhouse gases and aerosols, by 2100 temperatures in Nebraska could increase by 3°F in spring and summer (with a range of 1-6°F) and 4°F in fall and winter (with a range of 2-7°F). Precipitation is estimated to increase by 10% (with a range of 5-20%) in spring, summer, and fall, and 15% in winter (with a range of 5-30%). The amount of precipitation on extreme wet or snowy days in winter is likely to increase."
    0 0
  4. Albatross#198: "decline in net primary production between 2000 and 2009 on account of an increase in droughts" This is a trend, confirmed by Potter et al 2011: Results indicated that net primary production in Amazon forest areas declined by an average of 7% in 2010 compared to 2008. This represented a loss of vegetation CO2 uptake and potential Amazon rainforest growth of nearly 0.5 Pg C in 2010. If I calculate correctly, 0.5 Pg C = half a gigaton (metric); that's 1.8 Gtons CO2 or roughly the 2008 annual emissions of Russia or India. And that was the result of a single drought season. You know what they say: Half a petagram here, half a petagram there, pretty soon you're talking some serious carbon.
    0 0
  5. As if there are not enough papers on extremes already, here are some more: Christidis et al. (2011) Anderson (2011) With apologies to Walt Kelly: "We have met the enemy and he is us"
    0 0
  6. Sphaerica @200 and KR @203 I hear the both of you loud and clear. I am not wanting to be considered a troll on SkS. I do believe sufficient information is already available to determine if there is a noticeable trend in extreme weather. Increasing average temperature and precipitaion does not necessarily have to increase the number of extreme events, it certainly may, but it also may not. Good science can determine the actual frequency of extreme weather events. A warmer earth would increase the overall average temperatures and also likely increase the overall precipitation. I do not agrue these points. The thesis of the OP is that extreme weather is on the increase and global warming is the cause. The task of compiling enough data to determine this would take one individual a very long time and be prone to errors and mistakes in data entry. NOAA has extreme temperature and precipitation data on a daily basis for cities. If these cities are broken into regions and the data compiled one could have a strong degree of confidence as to what the situation is for extreme weather events, are they increasing? Staying the same? Decreasing? At least it can be done with extreme temps and precipitation. Others have already complied hurricanes and tornadoes at least in the US. I would like to see this study done on a global basis (as muoncounter has pointed out that one should do more than look out their own window) but I am not sure where the data for global locations is stored. The US would be a good start to see it there is a signal in the data. I would suggest adding an extreme event to the year it took place and plotting the total in bar graph fashion. If a few hundred people on SkS chose one city to compile and then at the end give a report on the trends for the city, a sound scientific empirical study would answer the question of this thread. This type of study would be qualitative. Another study can be quantitative. Order the month's most extreme precipitation events and temperature readings in fashion that 1 is most extreme followed down the line. Then you can get a date for the most extreme weather as well. Link to NOAA page that has daily records for both precipitation and temperature.
    0 0
  7. Albatros @193 and Eric (skeptic) @202 Thanks to both of you for the links to the various papers. I am still reading through them. They are informative.
    0 0
  8. And another paper on quantifying North American extremes - Peterson et al (2008). Norman, I think you'll find quite a lot of quantification of changes in North American extremes in there, and the relevant trends. Their well-supported conclusion:
    "Detailed homogeneity assessments of daily maximum and minimum weather observing station data from Canada, the United States and Mexico enabled analysis changes in North American extremes starting in 1950. The measures of extremes assessed were primarily indices developed by the joint CCl/CLIVAR/JCOMM Expert Team on Climate Change Detection and Indices. Similar decreases in cold extremes and increases in warm extremes were found when examining the 10th, 5th and 2.5th percentiles. Annual extreme cold temperatures are warming faster than annual extreme warm temperatures when the parameter measured is the actual temperature but cold and warm extremes are changing about the same when examined on a percentile or normalized basis. By any of several measures, heavy precipitation has been increasing in recent decades and the average amount of precipitation falling on days with precipitation has also been increasing. These changes in extremes are likely to impact natural ecosystems as well as agricultural and societal infrastructure."
    There you go, Norman, the task of compiling the North American data has been done for North America (including Canada and Mexico). Or is this not quantitative enough?
    0 0
  9. And Guirguis et al 2011 [h/t Rob P] takes a Northern Hemisphere view to put the last few winters into context, using NCEP data, finding that the warm extremes of the last few winters were more extreme and of a longer duration than the much-pulicised cold extremes, and that this is part of a multi-decadal trend. Severe Heat Indexes are generally rising, while Severe Cold Indexes are generally falling.
    0 0
  10. skywatcher @ 208 Thanks for the link to the Peterson Paper. I am reading it now.
    0 0
  11. skywatcher @208 In the Peterson (2008) paper, I am wondering if you could explain figure 16 trend line. There is a monster peak in the early 1980's but the trend line barely goes up for the 5-day maximum and actually goes down for the 1-day precipitation even though this frame is by far the greatest amount of precipitation anomalies. Then in the early 1990's the dip downward is the greatest since 1956 but the trend line is going up. Without an understanding of how this trend line works or what it is showing, I am not sure how the author concludes that preciptiation has been increasing.
    0 0
  12. Joe Romm reports on extreme flooding in Thailand this month and last. It is by far the most expensive flood in Thai history and has resulted in 10% of their rice farms destruction. They are (were?) the largest rice exporter in the world. They often get heavy rain during La Nina, but the current Nina is fairly weak. Joe links to Jeff Masters blog about this flood. Do you eat much rice? The price will rise this year. Maybe this is just another coincidence and the weather has not responded to AGW, or maybe we are looking at the future.
    0 0
  13. michael sweet @212 It appears someone has already compiled a list of what I have been looking for. This person took extreme weather events from the 1950's, 60's and 70's and put them on a list. I will link you to this webpage and you can see what you make of it. List of some extreme weather events.
    0 0
  14. Norman, why is it in your desire to prosecute your agenda (and it is patently obvious you have one) you first frequent the denialist and dissembling websites for ammunition rather than relying upon the science and the scientific method themselves? A hint: The words "Gore 'Lie-A-Thon' " on the top of your linked source should have been a tipoff of bias. And a very typical page at c3. Reliance upon this type of "source" undermines your credibility severely.
    0 0
  15. 213, Norman, Wow. That's just amazing. You (and your source) have proven that there have been extreme weather events prior to the advent of AGW, therefore AGW must not be affecting extreme weather events. Well done! Fantastic! Well, I'll certainly sleep easier tonight.
    0 0
  16. Daniel Bailey @214, I would hope that linking this sight does not undermine my credibility. Someone took the time (which would be a daunting task to compile) and gathered newpaper clippings of extreme weather events in the past. If one ignores the opinion of the author of the sight and concentrates only on the actual data (Newpaper clippings from around the world on extreme weather events) you get a historical perspective on severe weather events in number, intensity, and time frame. If you would insert Jeff Masters 2010-2011 weather compilation into this long list would it still stand out as something not seen since 1816? When looking at the whole globe, it would appear that somewhere they are experiencing extreme weather quite often. Look at some of the headlines in the long list of extreme event. Here is a sample: "1976: Worst Drought In England And Wales For 500 Years" "1951: Mississippi River Reaches Highest Level For 107 Years" "1951: 100 Degree Heatwave Lasts For 7 Weeks In Texas" "1952: Scientist Says Both Polar Ice Caps Melting At Alarming Rate" "1977: Worst Drought In California History - Year 2" "1977: Antarctica Iceberg Is 45 Miles Long & 25 Miles Wide"
    0 0
  17. [ response to deleted snipped ] The topic of this Thread is "Extreme weather and Climate Change". Finding a large sample of past extreme weather events that compare to those in James Powell's ebook should not be considered off-topic or extraneous. It is what the topic is about. The topic is Global Warming causing climate to shift in such a way that more extreme weather will be the result. If it can be clearly demonstrated that extreme weather events are not exceptional for these last few years (by showing large lists of past extreme weather events that are very similar to the ones brought up today), then that would seem a valid position to consider.
    0 0
  18. Okay, so in spite of my better judgement, I clicked a few of these - and there was good old Steve G, Prince of CherryPickerville. Including the infamous picture of USS Skate, supposedly at the 'ice-free' North Pole. That's the problem with a 'source' like C3: there is no vetting of the material cited, which leaves those gullible enough to take it on face value thinking, 'wow, that's a lot of information - must mean something.' We've had another player - friend PT - who operated the same way. It's also a Faux News tactic - 'people are saying that global warming is ... ', when the 'people' saying those things are the Faux News on-air talking heads. Repeat it often enough and it must be true, no? In addition, Norman: please note that many of these headlines are reports of disaster - bridge collapse, 400 dead, etc. You've specifically disputed the use of disaster counts as meaningful - yet here they are being used by you.
    0 0
  19. Daniel Bailey, Here is a link to a peer-reviewed article that shows similar patterns to the c3 website. Look at Table 1 of the link. Severe droughts and severe floods from 1977 to 1998. Many samples of such events taking place. It does not seem to be as alarming as James Powell feels it is. Peer Reviewed article with list of weather extremes.
    0 0
  20. To tack onto muoncounter's able comment above: I would not trust any information from a site such as c3 (given its history) in any fashion, to the point of even checking what the time of day was compared to that shown on the website. No compilation of news events, no matter how lengthy, should be relied upon with any form of scientific accuracy. There is simply no context to base any kind of assessment. It is simply a cacophony of anecdotal events in tabular form, listed with the presumption by the reader that it is not only complete but accurate as well. At best, one may consider it interesting in the same sense that one finds supermarket tabloids interesting. Honestly, it is difficult to even know how to respond to you Norman, without it sounding cross. You continually cherry-pick, use anecdotal references interchangeably with scientific ones and preferentially cite denialist websites preferentially over scientific ones. This latest site you ally yourself with has this post:
    "SkepticalScience.com: The 'SS' Global Warming Propaganda & Lie Machine Exposed - Fundamentally Evil"
    Seriously? Since you, by extension/virtue of your reliance upon c3, maintain that Skeptical Science is "Fundamentally Evil", then why are you here? I, for one, no longer believe your protestations of 'just looking for the truth' (paraphrased). It can no longer be construed as innocent mistake your predilection for frequenting & citing such websites as c3. Indeed, I am personally quite offended by this most recent tack you have taken. It was a mis-step; you have over-played your hand. And I am very disappointed.
    0 0
  21. Daniel Bailey @220 I am not actually allied to the c3 website and I do not agree with their thoughts on Skeptical Science. I like this web site and it contains a vast amount of useful information. I like the strict moderation to keep things on topic. I just saw the list of items on this page and clicked on several to see they were newpaper items. I do not know how else one can determine extreme weather events since they do not always leave evidence that can be analyzed later. I do not want to disappoint and will steer clear of c3 or other type blogs for gathering evidence of the point I am trying to make. That weather may not be getting more extreme as the globe warms.
    0 0
  22. Norman#219: Nice article you've cited: Human activities are causing the augmentation of the natural atmospheric greenhouse effect. Future climate models (which should not be accepted uncritically) predict that anthropogenic forcing will bring about changes in the magnitude and frequency of all key components and natural cycles of the climate system. Climate change will gradually (and, at some point, maybe even abruptly) affect regional and global food production. Warming temperatures and a greater incidence and intensity of extreme weather events may lead to significant reductions in crop yields. --emphasis added Given that this was in 2001, perhaps those projections are coming home to roost. Oops, that was a short compilation of news events.
    0 0
  23. Norman, Your list includes many newspaper headlines. I recall last fall when deniers trumpeted a headline stating England was having the coldest winter in 350 years. It did not pan out that way. Dr. Masters has researched his list and when he says it was the worst flood in Pakistan in 500 years that is believable. The newspaper headlines you quote are not vetted and not believable. Please provide a peer reviewed list of disasters. I will note that last year there were 19 countries with all time highest temperatures and none with all time lows. How does that list count for extreme weather? Top that, if you can.
    0 0
  24. Norman, is that seriously the best you can come up with? That there were some prior events considered 'extreme' is not news to you, me, James Powell or anyone else. Additionally, cherry-picked news articles can hardly be considered credible enough to faithfully place weather events into their proper climatological context (usually kinda turns the readers off...). I'm sure the newspapers from Russia, Pakistan or other places would have been suitably apocalyptic in their prognosis of the relevant extreme events! What is more interesting is when data is placed into a climatological context, such as Peterson et al, or many other papers including Rosenzweig (outdated with regard to recent extremes by virtue of being published in 2001, but hardly supporting your case anyway). By the way, in Peterson et al fig 16, the smoothed line is most likely a moving average or other smoothing function so that you can see the trend over the noise. Is that the worst criticism you have of that paper, seriously? I'll echo michael sweet's request at #223.
    0 0
  25. Normna, this has now been going on since comment 15. We're up to 225. 85 of those are yours... more than 30%. They all say the exact same thing, over and over. "Look, look, I found another extreme weather event. Here's another anecdote! Another headline! Another thingy." You have littered this thread with 85 comments pointing out that there has been extreme weather in the past, and so without any other metric than squinting one eye and saying "looks the same to me" you are trying to argue that nothing is wrong, nothing to see, everyone please move along. After 85 of 225 comments it has become very tiresome.
    0 0
  26. You are absolutely kidding me, Norman. You're saying that one city does not show a trend, therefore we can't be sure there's a trend. Peterson08 analysed thousands of stations across North America, the overall trend in temperature and precipitation extremes is very clear, as shown by their conclusions. That you continue to try and dismiss a published quantitative analysis of extremes at thousands of stations by discussing a single station is utterly ridiculous.
    0 0
  27. skywatcher @226, What my data shows is that it resembles the graph of extreme one day preciptiaton events that the Figure 16 of the Peterson (2008) graph shows (I don't have the ability at this time to post this graph, it does not have the normal link of other graphs or I would like to post it here). In the data I compiled for Oklahoma City, there is a large increase in extreme one day precipitation amounts (both in number and preciptiation amount) in the 1980's and then it drops off in the 1990's and 2000's. Very similar pattern to the Figure 16 graph of the Peterson (2008) paper. He has a trend line that shows it going up but nothing comes close to the peak in the 1980's.
    0 0
  28. muoncounter @222 You have suggested looking farther then out ones own window to get a sense if the climate is changing for the worse, but in Nebraska there is no evidence of this taking place. I do have good memory of several extreme weather events that have taken place in my local area and there is no evidence of an increasing number. Last 10 years of Corn Harvests in Nebraska have been very good. And 2011 looks just as good or better. Record Corn harvest expected for Nebraska in 2011.
    0 0
  29. 228, Norman, Thank you for being the poster child for denial
    "...but in Nebraska there is no evidence..."
    Everyone can relax because in your opinion Nebraska looks fine.
    0 0
  30. Norman You are constantly cherry-picking areas you claim have seen no changes. But what about those places that have already seen changes in extreme event frequency and/or intensity? How do you explain those? And how do you explain that rising temperatures and water vapour levels have no impact on extreme weather? The US Global Change Research Program's report on National Climate Change highlights some of the changes that have already happened. How do you explain these without taking into account climate change? What mechanisms are responsible? How are the effects of rising temperatures and water vapour levels, and changing atmospheric circulation, for example, nullified?
    0 0
  31. Norman: it is terrific that Nebraska is doing so well. Unfortunately, according to your source!!! the rest of the country is not: "According to the USDA, corn production for 2011-12 is forecast 556 million bushels lower than previously expected, with a reduction in harvested area and lower expected yields. The national average yield is forecast at 153 bushels per acre, down 5.7 bushels from last month's projection, as unusually high temperatures and below-average precipitation during July across much of the Corn Belt sharply reduced yield prospects" (my emphasis). Perhaps we could all move to Nebraska. The price of corn, and meat, and ethanol, will go up this year due to crop losses caused by AGW. Nebraska will benefit htis year, what about next year?
    0 0
  32. Norman: You accidently posted a two month old forecast. According the most recent forecast, Nebraska will not set a record, although they will have a good crop. The national forecast has also been lowered, due to heat and drought. Please try to give current information in the future. It only took me one Google to get current data, and I do not really care about Nebraska corn.
    0 0
  33. And so the cherry picking goes on. Norman, take yourself over to the "Continued Lower Atmosphere warming" thread, where you'll see a whole series of graphs in which 1998 is a massive outlier, representing the highest or near-highest value, yet the trend, even when starting on that year, and most certainly in years prior to 1998 is up. According to your reasoning in #227, it should be down, as a trend can never be up when there is a large peak in the past. You avoid the conclusions of Peterson's exhaustive study by saying "Look at Oklahoma City", "Look at Nebraska". Well Peterson already did that, seeing as Oklahoma City and Nebraska are in the USA. The trends in extremes are up, the mechanism is clear. I would suggest that if all you can do is say "look at X, it didn't have recent extremes", then your argument is dead in the water and you should be ignored.
    0 0
  34. Every passing post shows Norman grasping at thinner and thinner straws with increasing desperation. I don't think I need to read more about this.
    0 0
  35. Norman, I think one of your posts was deleted, but here's a longer term look at corn yields in Iowa: http://holocene.meteo.psu.edu/shared/articles/MaloneetalAgForMet09.pdf Also I would distinguish the "terrible weather years" hypothesis from the trend in yield improvement The latter may have a lot of factors involved like fertilizers, harvesting methods, hybrid seeds, etc. Those are two different analyses.
    0 0

Prev  1  2  3  4  5  

You need to be logged in to post a comment. Login via the left margin or if you're new, register here.


The Consensus Project Website

THE ESCALATOR

(free to republish)


© Copyright 2024 John Cook
Home | Translations | About Us | Privacy | Contact Us