Climate Science Glossary

Term Lookup

Enter a term in the search box to find its definition.

Settings

Use the controls in the far right panel to increase or decrease the number of terms automatically displayed (or to completely turn that feature off).

Term Lookup

Settings


All IPCC definitions taken from Climate Change 2007: The Physical Science Basis. Working Group I Contribution to the Fourth Assessment Report of the Intergovernmental Panel on Climate Change, Annex I, Glossary, pp. 941-954. Cambridge University Press.

Home Arguments Software Resources Comments The Consensus Project Translations About Support

Bluesky Facebook LinkedIn Mastodon MeWe

Twitter YouTube RSS Posts RSS Comments Email Subscribe


Climate's changed before
It's the sun
It's not bad
There is no consensus
It's cooling
Models are unreliable
Temp record is unreliable
Animals and plants can adapt
It hasn't warmed since 1998
Antarctica is gaining ice
View All Arguments...


Username
Password
New? Register here
Forgot your password?

Latest Posts

Archives

Foster and Rahmstorf Measure the Global Warming Signal

Posted on 20 December 2011 by dana1981

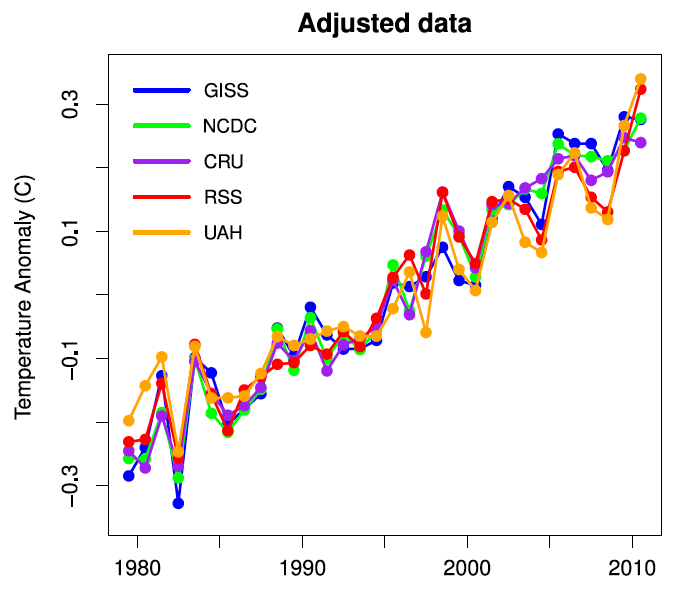
Foster and Rahmstorf (2011) have published a paper in Environmental Research Letters seeking to extract the human-caused global warming signal from the global surface temperature and lower troposphere temperature data.  In order to accomplish this goal, the authors effectively filter out the effects of solar activity, the El Niño Southern Oscillation (ENSO), and volcanic activity.  The result is shown in Figure 1 below.

Fig 5

Figure 1: Annual averages of the adjusted data - the global warming signal

Foster and Rahmstorf characterize ENSO by using the Multivariate ENSO Index (MEI), aerosol optical thickness data (AOD) for volcanic activity, and solar irradiance data (from PMOD) to characterize solar activity.  They also tried using Southern Oscillation Index (SOI) data for ENSO, sunspot number data for solar activity, and a volcanic radiative forcing reconstruction from Ammann et al. (2003), but found these changes made little difference to their results:

"None of these substitutions affected the results in a significant way, establishing that this analysis is robust to the choice of data to represent exogenous factors."

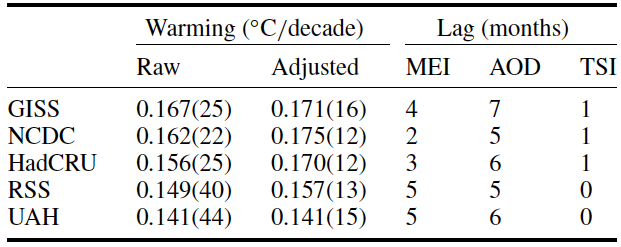
They approximated the influence of these exogeneous factors by using multiple regression of MEI, AOD, and PMOD on temperature data from GISS, NCDC, HadCRU, RSS, and UAH.  Since those exogeneous factors can have a delayed effect on temperatures, they tested lag values from 0 to 24 months to see which best fit the data.  The results are listed in Table 1.

Table 1: Warming rates in  °C/decade for 1979-2010, and lag in months, for each of the five temperature records and each of the three exogenous factors. Numbers in parentheses are standard errors in the final digits of the estimated values.

table 1

As Table 1 shows, filtering out these external effects increased the 32-year warming trend in every data set except UAH.  This analysis reveals that the underlying human-caused global warming trend in the surface temperature data ranges between 0.170 and 0.175°C per decade, and between 0.141 and 0.157°C per decade in the two main satellite lower troposphere temperature data sets. 

This is a very similar result to Huber and Knutti (2011), who estimated that approximately 100% of the observed surface warming since the 1950s has been caused by human effects.  This corresponds to approximately 0.55°C warming, most of which has occurred since mid-1970, for 0.15 to 0.20°C per decade anthropogenic warming, based on the Huber and Knutti results.

Additionally, we see that the lag before ENSO is reflected in surface temperature is 2 to 4 months, 5 to 7 months for volcanic effects, and 1 month for changes in solar activity.  In the lower troposphere, the lags are 5, 5-6, and zero months, respectively.  The authors conclude:

"When the fluctuations in temperature over the last 32 years (which tend to obscure the continuation of the global warming trend) are accounted for, it becomes obvious that there has not been any cessation, or even any slowing, of global warming over the last decade (or at any time during this time span). In other words, any deviations from an unchanging linear warming trend are explained by the influence of ENSO, volcanoes and solar variability....It is worthy of note that for all five adjusted data sets, 2009 and 2010 are the two hottest years on record....All five data sets show statistically significant warming even for the time span from 2000 to the present."

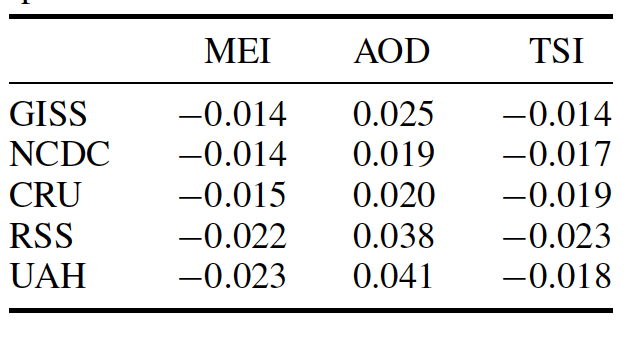
Overall, Foster and Rahmstorf find that ENSO has the largest impact on short-term temperature variations, followed by volcanic activity, with solar irradiance a distant third.  However, the contributions of each factor to the 32-year temperature trends were very similar (Table 2, Figure 2).

Table 2: Trends in  °C/decade of the signal components due to MEI, AOD and TSI in the regression of global temperature, for each of the five temperature records from 1979 to 2010.

table 3

Figure 7

Figure 2: Influence of exogenous factors on global temperature for GISS (blue) and RSS data (red). (a) MEI; (b) AOD; (c) TSI.

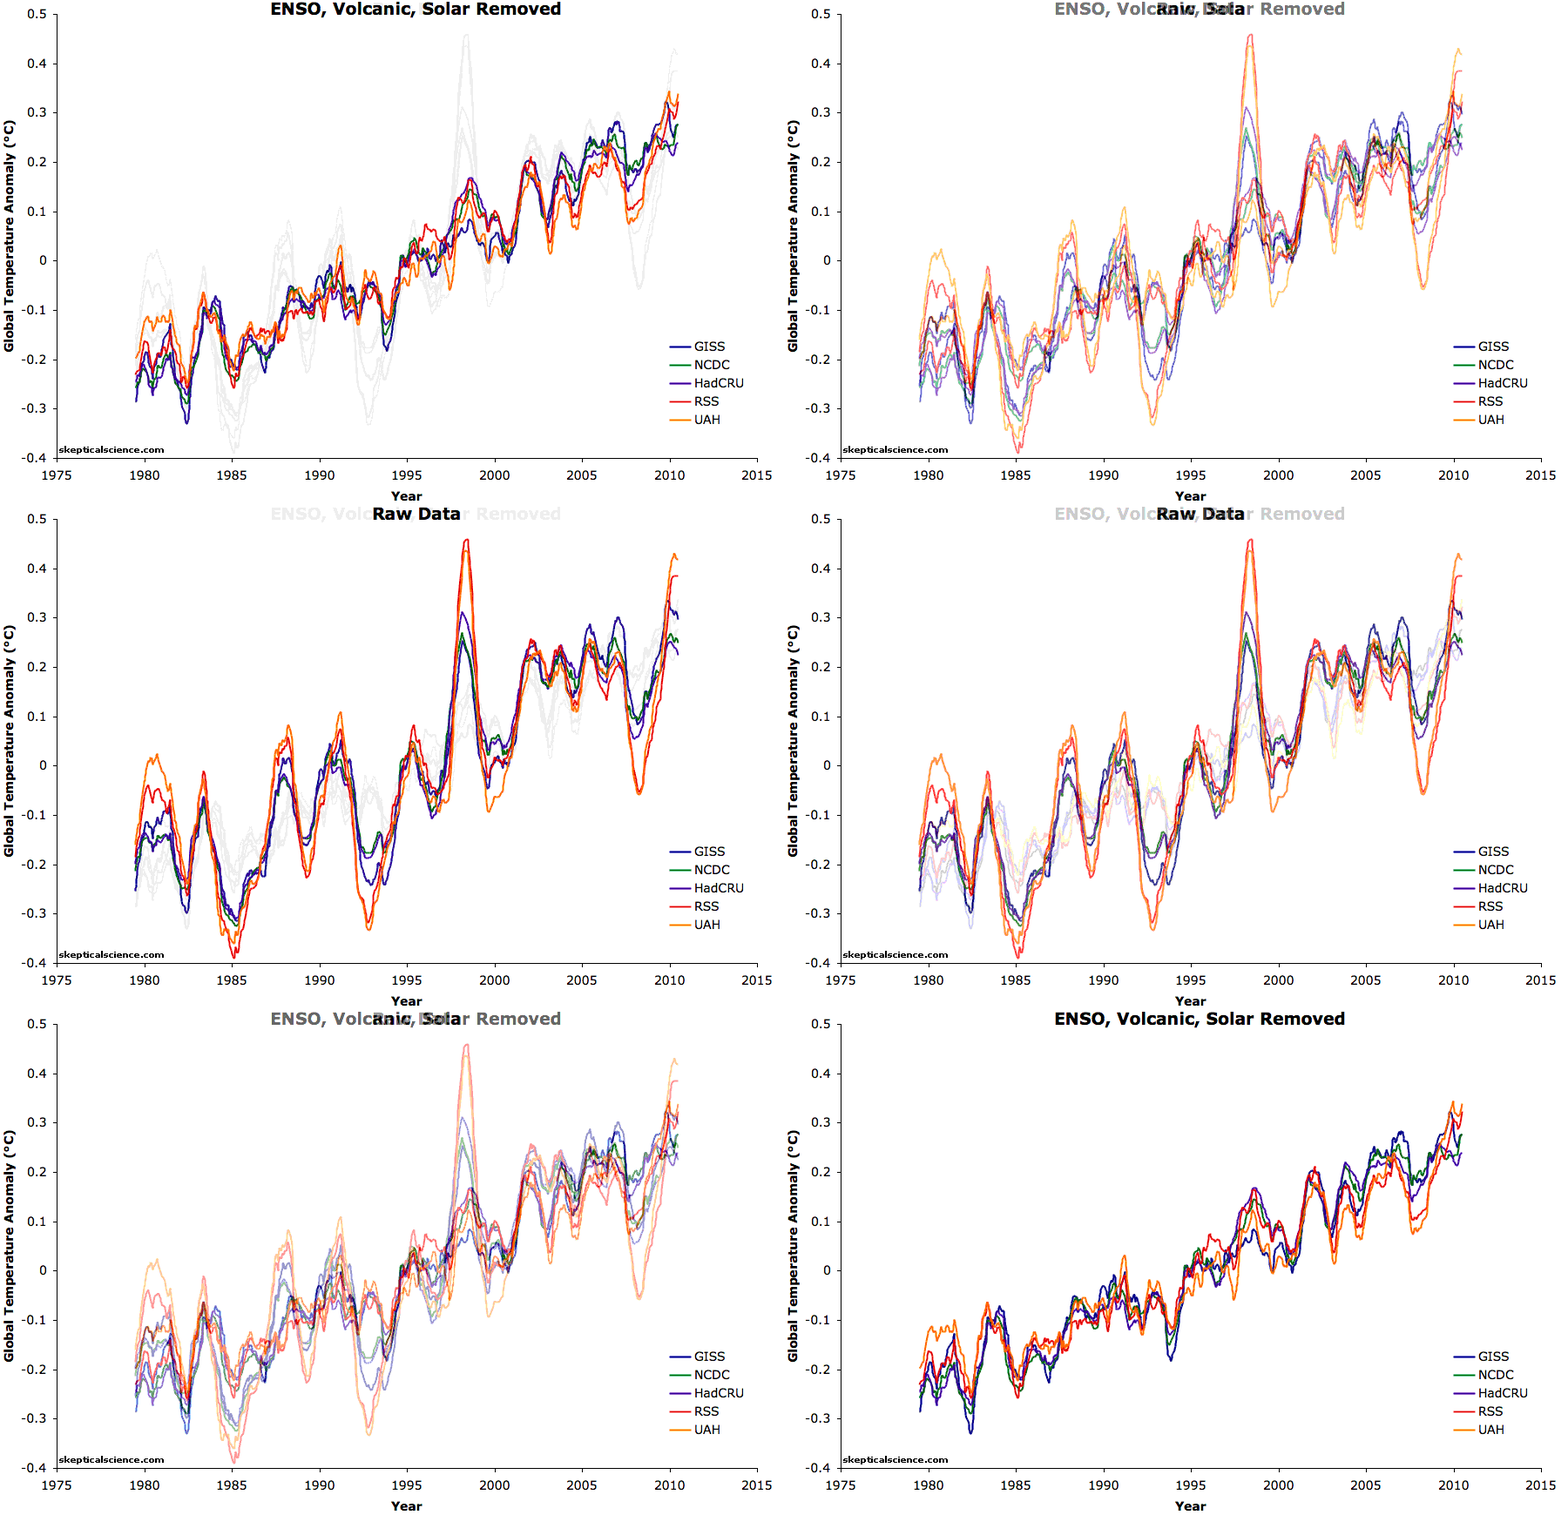
These factors contributed to very slight cooling of global temperatures over the past 32 years, with the execption of UAH, for which they have had no net impact on the trend.  Figure 3 shows the temperature data before and after the Foster and Rahmstorf exogeneous factor removal.

before/after filtering

Figure 3: Temperature data (with a 12-month running average) before and after the exogeneous factor removal

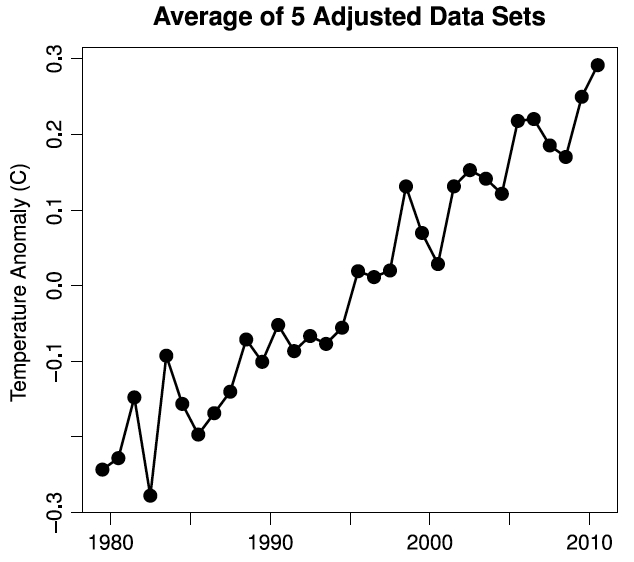
The authors conclude by averaging all of the data sets together (Figure 4):

"Because the effects of volcanic eruptions and of ENSO are very short-term and that of solar variability very small, none of these factors can be expected to exert a significant influence on the continuation of global warming over the coming decades. The close agreement between all five adjusted data sets suggests that it is meaningful to average them in order to produce a composite record of planetary warming.  [Figure 3 shows] the true global warming signal."

figure 8

Figure 4: Average of all five adjusted data sets.

Based on this average of all five adjusted data sets, the warming trend has not slowed significantly in recent years (0.163°C per decade from 1979 through 2010, 0.155°C per decade from 1998 through 2010, and 0.187°C per decade from 2000 through 2010).  As Foster and Rahmstorf conclude,

"The resultant adjusted data show clearly, both visually and when subjected to statistical analysis, that the rate of global warming due to other factors (most likely these are exclusively anthropogenic) has been remarkably steady during the 32 years from 1979 through 2010. There is no indication of any slowdown or acceleration of global warming, beyond the variability induced by these known natural factors."

For more on this paper, see tamino's take.

Note: the Foster and Rahmstorf results have been incorporated into the rebuttals to It's the sun (Intermediate and Advanced), A drop in volcanic activity caused warming, It's El Niño, Global warming stopped in [insert year], It hasn't warmed since 1998, and It's cooling

0 0

Printable Version  |  Link to this page

Comments

Prev  1  2  

Comments 51 to 100 out of 100:

  1. Bert @50, while I may be disappointed in the end, on evidence to date I do not think you have skept.fr's measure at all. He is not a carbon copy denier, and should not be treated as one. Further, suggestions that he has simply trying to distract us from the obvious are not helpful.
    0 0
  2. Tom : thank you. Bert : read my first message in #13, my point was clear about signal-noise disambiguation, and my conclusion was clear too : "I think FR get the broad picture with their choices, but I don't know if the decadal trends they obtain from their removals are very precise. Maybe lower, maybe higher." (My emphasis). In my opinion, if multidecadal unforced variability exists and is assessed, the real AGW signal may well be higher (not lower) that the conclusion of FR2011. For example, if you look at this recent Douglass guest post on Curry's blog, you see that the author suggests the internal variability modes could have known a very low shift at the beginning of the 2000s, the lowest of the past 70 yrs (figure 1 from Towsley et al 2011). If he is correct (that I don't know, and remind this is just a blog post without real scientific value), it would mean that instead of a slight warming, and the warmest T from instrumental records, past decade should have known a very sharp cooling. So, maybe we underestimate (even FR2011) the real signal of AGW in climate. That is why even people who refers to the sun or the natural variability, frequently in a perspective of denialism, doesn't understand the real implication of what they advance for climate. The 2000s decade could well have been the definite proof that natural factors are henceforth unable to cool the Earth, even in the most favorable condtions for that. And this would be quite a bad news for all us. You must really keep an open mind on all these questions. I'm skeptic, not denier.
    0 0
  3. skept.fr - As I (personally) interpret F&R 2011, the purpose of the paper was to remove large, known sources of variability from the temperature signal, and see how they affected the statistical relevance of an underlying warming trend. Hence their regression against ENSO (known to affect temperatures, with at least a partially understood physical basis for those effects), volcanic/sulfur aerosols (simply on the basis of albedo), TSI (goes without saying), and the annual cycle. The results indicate a very strong agreement among the five temperature records, a clear linear trend, and greatly reduced variability in that identified trend. In addition the correlation strength and lag times are quite interesting, and match reasonable expectations of the physical basis for their effects on temperatures. Remaining variability may be (I would almost say "would have to be") due to other effects. But - given the statistically linear residuals of the data after these components, these other potential influences do not show a cyclic effect, or for that matter a dominant effect, on the data that we have so far. Perhaps after some time, with more data, we might have enough to tease out other cyclic or acyclic influences on temperature. Right now, with the data used in the F&R paper, limited by (among other things) the length of the satellite record - there's little evidence for it.
    0 0
  4. skept.fr#52: "The 2000s decade could well have been the definite proof that natural factors are henceforth unable to cool the Earth, even in the most favorable condtions for that." Fair point. I noted here that quiet solar conditions (a natural variation if ever there is one) were ideal for the onset of cooling; F&R's important result show no evidence of that happening. But surely the pseudo-skeptics will cry, 'wait 'til next year!'
    0 0
  5. Agreed with KR @53 - this paper certainly doesn't remove all exogeneous factors, just 3 big ones (3 of the biggest, in fact). The one criticism at WUWT that I'd like to see implemented is the influence of human aerosol emissions. That would make for an interesting addition to the analysis, if we could get good enough emissions data.
    0 0
  6. dana1981 - I agree on the human aerosols. I suspect our data on the subject (given the regional nature and short lifespan of human aerosols) isn't terribly good, but I've suggested the same over at Tamino's blog. In the meantime, I don't think F&R have in any way claimed that these are the only exogenous influences on climate - simply that they are large ones, and that accounting for them improves our view of GHG influences.
    0 0
  7. #53 KR : I agree with your presentation of FR2011, the near-linearity of the signal suggest residual noise (if any) is probably weak. But the fact that there is no acceleration in the trend could also suggest that there is a residual natural cooling noise in the past decade (and/or warming in the previous). If so, the AGW rate would accelerate in reality. I don't know, but I'm pretty sure FR2011 cannot be interpreted firmly in a "reassuring" way (you know, interpretation like "don't worry, warming rate is steady, it proves that we will get 1,7 K in 2100 in BAU scenario"). #dana1981 : the anthropogenic sources of aerosols is supposed to have decreased in the 1980-1990s (works of Martin Wild and co-authors on "global brightening"), then increased in 2000s due to global increase of coal plant emissions (Chinese and emerging countries). (So again, one should note this a cooling trend in the 2000s decade.) Is there a reference web source explaining how the AOD is calculated (methods, sites, etc.)? For example, I don't know how the indirect effect (in cloudy sky) can be measured.
    0 0
  8. hi dana, nice graphs! i get it, only too well. am i right in thinking the optical index will filter out effects not only from volcanic activity, but also from human produced black carbon etc? if so, why no mention? i'm thinking of changing my handle to 'einstein's barmaid' :D
    0 0
  9. oh bother! sorry, didnt read the second page of comments.
    0 0
  10. Hi Gerda. I haven't researched exactly how AOD is developed, but I don't think so. Look at Figure 2b above - volcanic eruptions are clear, but there's no indication of human aerosol influences.
    0 0
  11. skept.fr (and Gerda) I think the links to AOD are found embedded in Tamino's article . Plus you could ask him directly there...I'm not sure if human aerosols get to the stratosphere as easily as volcanic...
    0 0
  12. maybe something to do with the location on the sensors? e.g. wdca sites seem to be mostly in europe, n.america and africa, none in asia; http://wdca.jrc.it/data/parameters/data_AOD.html which would give good results for background (mostly natural) haze but not human emissions on the timescale and period we are dealing with here?
    0 0
  13. thanks utahn, i was thinking that also. it's obviously a tool that can be used for both, as i found a nasa site specifically dealing with smoke http://www.ssd.noaa.gov/PS/FIRE/GASP/gasp.html presumably the natural and man made signals are distinct and easily separable...
    0 0
  14. Interesting link Gerda, it would be even more interesting if they went back to 1900 or so ;) Like their acronym as well, apropos...
    0 0
  15. Looking at the info, it seems that it's mainly the ENSO that's had an effect over since 1998 to make it appear that global warming has ended, which is what the skeptic-deniers always claim. I guess a logical question is, as global warming is causing the ocean to warm up, why is the cooling effect of the La Nina still so pronounced?
    0 0
    Response:

    [DB] "it seems that it's mainly the ENSO that's had an effect over since 1998 to make it appear that global warming has ended, which is what the skeptic-deniers always claim"

    You mean the denialist meme you are repeating? 

    "why is the cooling effect of the La Nina still so pronounced"

    What cooling effect?  Please read the OP again.  You must've missed this bit:

    All five data sets show statistically significant warming even for the time span from 2000 to the present

  16. @DB. The peer-reviewed paper in the article is saying that if you remove the effects of solar irradiance, aerosols and ENSO, then the warming trend continues. The article says "Foster and Rahmstorf find that ENSO has the largest impact on short-term temperature variations", as indeed is shown in their graphs. The graph is showing a cooling effect caused by La Ninas in 2008 and 2010, which accounts for what skeptic-deniers perceive to be the flattening in the warming trend. La Ninas are caused by upwelling of cold water, so my question is that given that the oceans are absorbing a lot of heat, why aren't the La Ninas getting less pronounced?
    0 0
    Response:

    [DB] "why aren't the La Ninas getting less pronounced?"

    Who said the La Ninas would get less pronounced? The La Ninas themselves are warming up.  The most recent La Nina was the warmest on record, warmer indeed than many El Ninos.  What you are missing is the incomplete temperature monitoring of the ocean deeps.  Thus, what may seem like a "cooling effect" in the surface temperature record (which statistically is still warming during the La Nina) misses the injection of heat into the deep. Essentially, ENSO causes a redistribution of heat (thus the use of the word "variations"), but overall does not warm nor cool the Earth.

    In the face of said posited "cooling", ask yourself how it is then that the most recent decade is the warmest in the surface temperature record?

  17. mace @66, who says La Nina's are not becoming less pronounced? The graph below shows the various La Nina years in blue. If you look closely you will see a pattern. They are getting warmer. Indeed, the last two La Nina's have been warmer than every recorded El Nino year prior to 1998. If that is not becoming less pronounced, I don't know what is. What has not happened, is that La Nina's have not become less pronounced relative to years within the same decade. But there is no reason why they should. Just as La Nina's are getting hotter for La Nina's, normal years are getting hotter for normal years, and El Nino's are getting hotter for El Nino's. So the short term contrast between El Nino's and La Nina's remains the same, and is expected to. Meanwhile, in the long term La Nina's are hotter than the El Nino's my father used to enjoy (and that I enjoyed as a child).
    0 0
  18. @Tom Curtis. Sorry, you misunderstood what I was asking. If you take a look at the Multivariate ENSO Index (MEI) figures in the chart in the article, the La Nina from autumn-2010 to summer-2011 had a cooling effect that was more pronounced than the one in 2000. I agree that 2010 as a whole had the highest global mean temperature and 2011 will be the hightest global mean temperature of a year where part of it had a La Nina.
    0 0
  19. So, what I'm essentially saying is that given that the La Nina in 2010/11 had a greater cooling effect than that in 2000, yet 2011's global mean temperature is higher, then this means that another forcing agent must be responsible for raising the temperature and most likely that's manmade pollution. However, given that the oceans are getting warmer due to global warming, you would expect the La Nina in 2010/11 to have a reduced cooling effect as well, so 2011 should be warmer than what it is. Do you see my point? Our sea level predictions are dependent on the oceans getting warmer as well as the ice melting, but if the oceans are getting warmer than why is the La Nina in 2010/11 cooler than that in 2000?
    0 0
  20. mace#69: "if the oceans are getting warmer than why is the La Nina in 2010/11 cooler than that in 2000?" Let's not turn this into an el Nino/la Nina-centric discussion; there are several existing threads for that. The point here - really the core of Foster and Rahmstorf - is that these short term oscillations are noise written on the underlying signal. The amplitude of these oscillations is still large enough to make it look like 'it's cooling' when in fact that is just noise. FR removes the noise; without taking that step, we will still see occasional years that look cooler than they 'should' be. In fact, that's one way to show they have done an excellent job of separating the trend from the noise. But you seem to be confusing 'index' with 'cooler'. Look here for a description of how MEI is calculated.
    0 0
  21. Re: skept.fr @ 57, and others Aerosol Optical Depth is usually measured using sun photometers, which have a series of narrow-band filters (a few nm wide) to take direct sun measurements at selected wavelengths. Yes, such methods are biased towards clear skies. The largest network with international coverage is NASA's AERONET. Look there for data, methods, etc. Another international network is the Global Atmosphere Watch PFR network, run out of Switzerland. There's is probably the best instrument, but there are far fewer of them that in AERONET. Measurements can also be made using "Rotating Shadow Band" instruments (also filtered), such as those by the USDA UVB Monitoring Network.
    0 0
  22. Yes Tom Curtis I am sorry if I went off half cocked. I fully realize it is not helpful. I am just an older retired Physicist and we are used to being correct! skept.fr is at least logical and his analysis is sound if his assumptions are real. The real problem I have is that full picture is difficult to comprehend. Flying a light aircraft solely on instruments is something you all should try. If you do not cross correlate all the information or rely on one instrument indication you will crash. We are all biased by our life histories. None of us is immune. Again I will think more carefully before posting next time. Bert
    0 0
  23. #71 Bob : thank you. So, if I correctly understand the methods, the AOD measure is not limited to volcanic activity signal, but to all aerosol's changes including the anthropogenic sources. Furthermore, the direct effect (reflectance in clear sky) can be accurately estimated, but not the indirect effects of aerosols (total cloudiness and optical property of clouds). If this a correct, FR2011 probably underestimate the trend (or the slope of the warming signal). As mentioned in 57, it is widely considered in the literature (see this 2009 review for example) that aerosols have been decreasing in the 1980s and 1990s (warming trend, not fully accounted in FR2011 for the indirect effects by AOD) then stabilizing and slightly increasing in the 2000s (cooling trend with same problem, not fully accounted for the indirect effects by AOD). So, it suggests a full account of aerosols would likely produced a higher warming signal in 2000s than in previous decades.
    0 0
  24. skept.fr#73: "aerosols have been decreasing in the 1980s and 1990s" Numbers are always nicer than 'probablies' and 'summaries.' Here are some from Hatzianastassiou et al, as presented at 2009 EGU: On a global basis ... the AOT has slightly increased (by about 4%) over the two-decadal study period, mainly in the Southern Hemisphere. Consequently, the magnitude of aerosol DREsurf has also increased by 0.38±0.1 W m-2 (or by 6%) indicating thus an aerosol solar dimming from 1984 to 2001. ... Although on a global basis the contribution of aerosols to GDB can be exceeded by the effects of other radiative components such as clouds, aerosols are found to significantly contribute to GDB at the regional scale Here AOT = aerosol optical thickness, GDB= global dimming and brightening, DREsurf = direct radiative effect on solar radiation at the Earth's surface The problem will be in the last sentence of the quote: these effects are regional. How do you propose to include that in an analysis such as FR2011, which is a decomposition of temperature record into components and not a forward model?
    0 0
  25. #73 skept.fr: "So, if I correctly understand the methods, the AOD measure is not limited to volcanic activity signal, but to all aerosol's changes including the anthropogenic sources." I may be wrong, but what I understand from this study is that AOD here stands for stratospheric AOD, which really is a measure limited to volcanic activity signal, and which influence used in FR2011 seems detailed in Lean&Rind 2008 (finally the equivalent study with the same exogenous factors, but in the opposite path) : "Volcanic aerosols in the stratosphere are compiled by [Sato et al., 1993] since 1850, updated from giss.nasa.gov to 1999 and extended to the present with zero values." Moreover, the study result of FR2011 called "true global warming signal" corresponds to an estimate of the net anthropogenic forcing : "including greenhouse gases, landuse and snow albedo changes, and (admittedly uncertain) tropospheric aerosols." Just to be sure to agree on the fact that it doesn't represent the filtered GHG global warming signal, but the whole AGW signal.
    0 0
  26. Sorry, wrong link for Sato et al., 1993.
    0 0
  27. The links to AERONET and GAW that I posted are to networks of ground-based passive optical instruments that use direct sun readings to measure the atmospheric attenuation at specific (narrow range) wavelengths. The filters can be in the UV, visible, or near-IR portions of the spectrum, and are usually selected with particular types of analysis in mind (i.e., particular types of atmospheric aerosols). These sorts of instruments have several characteristics: - the direct sun reading does not tell you whether the attenuation is the result of absorption or scattering or both. - the direct sun reading does not tell you where in the atmosphere the aerosol is. It represent an atmospheric total. - the initial measurement tells you Total Optical Depth. Data analysis accounts for attenuation due to Rayleigh scattering. Depending on the wavelength, other adjustments are made for absorption by other known gases - e.g. ozone, water vapour, etc. The remainder becomes the Aerosol Optical Depth, and it is wavelength-specific. - depending on the purpose, wavelengths will be selected to avoid certain absorption bands, but you can also target them if you are trying to measure a particular gas (e.g., ozone). - how Aerosol Optical Depth varies with wavelength can tell you a lot about the aerosols - e.g., size distribution. - some instruments (AERONET in particular) take readings away from the sun. This allows identification of many other optical properties of the aerosols, including whether they are mainly absorbers (e.g. soot) or scatterers (e.g. dust). - clouds also have optical depths. Thin ones are measurable, but thick ones absorb everything and optical depth becomes infinite (mathematically). To get aerosol optical depth, analysis includes some sort of cloud screening, so that cloud doesn't get confused with aerosols. - all of this will allow some determination of what type of aerosol is present, and perhaps where it is in the atmosphere (e.g., volcanic dust in the stratosphere). There are other methods of measuring aerosols, such as aircraft sampling, or LIDAR. LIDAR is a laser-based active sampling method that sends light beams into the atmosphere, and measures the return signal. They are capable of creating atmospheric soundings of various optical properties. A quick Google search led me to this European network: EARLINET. I hope this helps clarify some of the characteristics of measuring aerosol optical depths.
    0 0
  28. #74-77 : thank you all for the different precisions. Papy is right, FR2011 reference is explicitly this GISS source, dealing with stratospheric aerosols only (so volcanic activity). For tropospheric aerosols, both natural and man-made, interesting regional estimates in Streets et al. 2009 , to read with muoncounter's reference. But this is outside the scope of FR2011. Aerosols are clearly still difficult to constrain, for their emissions as well as their effects, but Bob's explanations for analysis methods are interesting.
    0 0
  29. Redirected from the UAH Misrepresentation Anniversary, Part 2 - Of Cherries and Volcanoes thread: I would have to agree with DaneelOlivaw on the point he raised in that thread: F&R 2011 isn't an attribution study, but rather a separable components study which subtracts attributable influences. And, as they clearly demonstrate, subtracting time-dependent influences directly attributable to TSI, volcanic aerosols, and ENSO fluctuations leaves a linear trend behind. This demonstrates that the linear trend is not due to TSI, volcanic forcing, or ENSO variations. Now, that linear trend is likely a combination of a few different factors - well mixed GHG's, countered somewhat by lower atmospheric aerosols, various feedback effects (albedo and the like), etc. F&R, stating that "most likely these are exclusively anthropogenic", are making a very reasonable statement. The physics of greenhouse gases and fairly basic spectroscopy support a linear trend of just about that size, and claims otherwise require both dismissing that spectroscopy and introducing some Mysterious Unknown Forcing (MUF). The conclusions of the paper are that the linear trend is not due to the various examined additional forcings, and that with those additional forcings accounted for the linear trend is both clearer and statistically valid over much shorter time frames. But, while claiming the linear trend is due to non-anthropogenic factors requires invoking leprechauns or the like, F&R 2011 isn't making attribution claims about the linear trend...
    0 0
  30. #16 muoncounter (off-topic there, so I post my answer here) : FR2011 is not an attribution study, so you're correct, "let's not start again". Readers will usefully refer to the IPCC 9.1.2 for the common characteristics and differences between attribution and detection. Notably: The approaches used in detection and attribution research described above cannot fully account for all uncertainties, and thus ultimately expert judgement is required to give a calibrated assessment of whether a specific cause is responsible for a given climate change. The assessment approach used in this chapter is to consider results from multiple studies using a variety of observational data sets, models, forcings and analysis techniques. The assessment based on these results typically takes into account the number of studies, the extent to which there is consensus among studies on the significance of detection results, the extent to which there is consensus on the consistency between the observed change and the change expected from forcing, the degree of consistency with other types of evidence, the extent to which known uncertainties are accounted for in and between studies, and whether there might be other physically plausible explanations for the given climate change. Having determined a particular likelihood assessment, this was then further downweighted to take into account any remaining uncertainties, such as, for example, structural uncertainties or a limited exploration of possible forcing histories of uncertain forcings. The overall assessment also considers whether several independent lines of evidence strengthen a result. So, you need a complex array of evidences – not just a paper grossly detrending for 3 factors on 3 decades or another running with an EMIC – to produce a correct assessment in detection-attribution. Christy and Spencer are criticable for their imprecise rhetoric, and the correct answer to such a behavior is to be very precise in what is said. At least, it is what I judge convincing.
    0 0
  31. skept.fr#80: Your quote from 9.1.2 misses the actual definition of attribution in that section: ‘Attribution’ of causes of climate change is the process of establishing the most likely causes for the detected change with some defined level of confidence ... A valid step towards establishing the most likely causes is to eliminate less likely factors from consideration. That is the primary result of the method used in FR2011. ... in practice attribution of anthropogenic climate change is understood to mean demonstration that a detected change is ‘consistent with the estimated responses to the given combination of anthropogenic and natural forcing’ and ‘not consistent with alternative, physically plausible explanations of recent climate change that exclude important elements of the given combination of forcings’ FR2011 demonstrate that the detected change is inconsistent with three physically plausible natural forcings. That is the second part of the above 'in practice attribution.' Why is this level of scrutiny - and semantic precision - not applied to the pseudo-skeptics who routinely make unsupported claims? To say 'its the sun' or 'its cosmic rays' is to make claims of attribution: Where is this rigorous standard in those cases?
    0 0
  32. muoncounter, relax. This level of scrutiny is applied to fake sceptics. Although, since their claims are for the most part so deattached from reality, one does not even need to apply much scrutiny at all to tell they are bunk. "A valid step towards establishing the most likely causes is to eliminate less likely factors from consideration. " Yeah, but... were volcanic aerosols or ENSO really "likely causes" of global warming? Volcanic aerosols have actually a cooling effect so they are excluded from the get go. ENSO is cyclical and cannot increase the energy in the earth system that is documented and that the ocean surface is hotter than the deeps. And we know that solar activity is actually decreasing while temperatures are on the rise. So I don't think that what FR2011 set to do was to eliminate those factors as causes of global warming. If that were the case, it would be a boring and redundant paper. In my view what they tried to do is to, knowing that global warming is primarily anthropogenic, remove the noise produced by other factors in order to see that anthropogenic signal more clearly. This is a subtle point, I understand that!
    0 0
  33. #81 muoncounter : Why is this level of scrutiny - and semantic precision - not applied to the pseudo-skeptics who routinely make unsupported claims? It is, and notably here on SkS. The better way to convince your reader is to be blameless. Concerning FR2011, here are some supplementary suggestions for understanding why it is not an attribution study: a) The solar forcing is reduced to TSI signal, but we know there are other factors influencing climate (for example spectral changes in UV, not correlated to total irradiance, and their effect on stratosphere-troposphere coupling). Furthermore, we don't know the precise time response of climate (mainly oceans) to solar forcing. So the T trend 1979-2011 may contain noise from past forcing from solar origin. Only a physical model can tell us. b) The unforced variability is ignored except for ENSO. See our long discussion above about all others modes of variability, and the possibility that coupling / decoupling of these modes create multidecadal variability, not just year-to-year change. Again, only a physical model can answer, see my reference to GEOMAR as an example of such model. c) the tropospheric aerosols (mainly from anthropogenic source) is ignored, so on the 32 yrs, we don't know what part of the signal is due to changes in aerosols inside the period and what part to changes in GHGs. Here too, a physical model would use estimation of aerosol emissions and fully calculate their direct/indirect effects so as to bring a clearer picture. The Christy point (other discussion) was about a precise quantification of GHGs signal - not about its existence, not even about its first order importance (even if Christy is skeptic about that, the press release is cautious). So the reference to FR2011 cannot answer to this level of precision.
    0 0
  34. skept @83 - I disagree with a couple of your points. First, FR11 did quantify the climate response times to each exogeneous effect (it was 0-1 month for TSI). Given that TSI has not increased significantly for the past 60 years, unless there is a 60+ year lag effect - which I do no find physically plausible in the least, and none has been proposed - I don't think that's a valid concern with regards to the FR11 results. Second, the excluded aerosol effect is an anthropogenic one, and thus is part of the leftover (mainly) anthropogenic trend. The claim is not that the leftover trend is from GHGs, it's that it's anthropogenic. I have revised the text in UAH part 2 slightly to note that the remaining trend is *almost entirely* anthropogenic, as opposed to being totally anthropogenic, which may not be true.
    0 0
  35. DOlivaw#82: "one does not even need to apply much scrutiny at all to tell they are bunk." Unfortunately, we need to apply such scrutiny or the pseudos make it seem like they're going unanswered. Read the Pielke threads for a demonstration of that effect. But my question was rhetorical; a means to point out the failure of the pseudo skeptic to be skeptical of his or her own belief system (the belief in ABC - anything but CO2). skept.fr#83: "The better way to convince your reader is to be blameless." No, the better way is to be relentless in pointing out the failures of many, if not all, of the arguments positing ABC. Your point a. (UV) is a weak hypothesis at best. Your point b. (other oscillations) was shown to be moot in prior commentary. Your requirement of a model as a standard for attribution is novel, as it is not part of the definition of attribution in 9.1.2 quoted above. Do you read the word 'demonstration' to mean 'model'? Such models (showing GHG forcing as the dominant cause of the warming signal) exist; why do you require FR to reinvent this wheel?
    0 0
  36. skept.fr @80 and KR @79, "So, you need a complex array of evidences – not just a paper grossly detrending for 3 factors on 3 decades or another running with an EMIC – to produce a correct assessment in detection-attribution. " Please, there is a whole body of science and literature out there on attribution. What you state is exactly what is being done. Scientists and SkS are not pinning everything on FR11-- with respect, you seem to be trying to argue a strawman. There is a compelling body of observational evidence out there that humans are causing the warming and and that includes research into estimating how much of that warming we are probably responsible for. RF11 is just part of a much bigger pyramid of knowledge. For the record, as far as I can determine, FR11 do not claim their paper is an attribution paper, nor does SkS.
    0 0
  37. DaneelOlivaw @82, I have seen ENSO cited as the cause of the warming numerous times by deniers, and infamously, McLean, De Freitas and Carter have argued that ENSO is the major cause of the warming trend in the peer reviewed literature. Volcanoes cannot cause global warming, but their absence can. Notably both the strong warming in the early twentieth century and the Medieval Warm Period are attributed at least in part to a relative absence of large volcanic eruptions. Indeed, F&R2011 find that the lack of large eruptions since 1995 has contributed positively to the trend on all indices, although the net contribution is small and overwhelmed by other factors. Finally, TSI is declining but warming has been attributed to other solar related factors. Because F&R2011 use a statistical approach rather than a physical (model based) approach, any solar effects in addition to variations in TSI are also captured by their approach, so long as those effects are significantly correlated with the solar cycle. Therefore they rebut any putative increasing non-TSI solar forcing (so long as it is correlated with TSI) as well as TSI forcing as a cause of the long term trend. You state that:
    "In my view what they tried to do is to, knowing that global warming is primarily anthropogenic, remove the noise produced by other factors in order to see that anthropogenic signal more clearly."
    That is my view as well. However, that does not preclude their paper from having larger implications. One such implication is that, by identifying the temperature signal associated with each "forcing" signal, ie, the MEI, AOD, and TSI they reduce the uncertainty regarding the anthropogenic contribution to the rise in temperatures. A second is that by constructing a temperature signal free of identifiable noise, they produce a clear temperature signal which can be compared with putative causes of that signal. As indicated elsewhere, that comparison refutes most major alternatives to anthropogenic forcing as a cause of the temperature increase. Neither of these points is made in the paper - but they follow from it.
    0 0
  38. skept.fr @83: a) As noted above, any solar effect correlated (including negatively correlated) with TSI would contribute to the TSI signal component as detected by purely statistical means. Ergo any solar effect not accounted for must not correlate with TSI, ie, it must not show an 11 year cycle. To my knowledge, no such solar mechanism has been proposed. b) As discussed elsewhere, because the temperature signal minus the influences of AOD, MEI and TSI is very close to linear, the sum of remaining forcings must also be very close to linear. As no major oceanic oscillation has been close to linear over the period 1979-2010, they are thereby shown to have a minor effect on global temperatures, if any. c) It is true that we do not know how much changes in tropospheric aerosols have influenced the temperature. However what we do know because of the near linear increase in temperature is that the net forcing of GHG plus aerosols has not varied greatly from a linear increase. (Due to thermal lag, "greatly" is here a very relative term.) I note that Spencer has said in his blog in defense of his press release that:
    "In my opinion, the supposed “fingerprint” evidence of human-caused warming continues to be one of the great pseudo-scientific frauds of the global warming debate. There is no way to distinguish warming caused by increasing carbon dioxide from warming caused by a more humid atmosphere responding to (say) naturally warming oceans responding to a slight decrease in maritime cloud cover..."
    This is frankly inconsistent with any attempt to interpret his claims in his press release as being "...about a precise quantification of GHGs signal ...". Spencer is making a very bold claim. More specifically, the precise context of the quote from Dana's article is as follows:
    "Christy and other UAHuntsville scientists have calculated the cooling effect caused by the eruptions of Mexico’s El Chichon volcano in 1982 and the Mt. Pinatubo volcano in the Philippines in 1991. When that cooling is subtracted, the long-term warming effect is reduced to 0.09 C (0.16° F) per decade, well below computer model estimates of how much global warming should have occurred. Although volcanoes are a natural force, eruptions powerful enough to affect global climate are rare and their timing is random. Since that timing has a significant impact on the long-term climate trend (almost as much as the cooling itself), it makes sense to take their chaotic effect out of the calculations so the underlying climate trend can be more reliably estimated. What it doesn’t do is tell scientists how much of the remaining warming is due to natural climate cycles (not including volcanoes) versus humanity’s carbon dioxide emissions enhancing Earth’s natural greenhouse effect. “That is the Holy Grail of climatology,” said Roy Spencer, a principal research scientist in the ESSC, a former NASA scientist and Christy’s partner in the satellite thermometer project for more than 20 years. “How much of that underlying trend is due to greenhouse gases? While many scientists believe it is almost entirely due to humans, that view cannot be proved scientifically.”
    Clearly Spencer is talking very much about the sort of natural climate cycles (ENSO, volcanoes, the solar cycle) that F&R2011 explicitly deal with. It is absurd to suggest that it is legitimate for Spencer to talk about the trend introduced by volcanoes, but to consider irrelevant a paper that explicitly shows that trend, and that it is cancelled by negative trends introduced by other "natural cycles". Finally, I have learnt from long experience debating both creationists and fake skeptics of global warming (not to mention few "911 troothers", a geocentrist or two, and a couple of Apollo fraudsters) that there is no such thing as "blameless". No matter how impeccably precise you are they will find a way to distort what you say as a means of attack. As they would find reason to blame even a saint, the goal is simply to be clear and to have integrity. Reasonable people will recognize both qualities and not be distracted by denier nitpicking. (And in this case it is nitpicking, though not by deniers.)
    0 0
  39. #84 dana : "Given that TSI has not increased significantly for the past 60 years, unless there is a 60+ year lag effect" Solar forcing is still in "low level of understanding" in IPCC terminology, and we cannot be sure that TSI is the correct metric for estimating all solar influences on climate. See this very complete review by Gray et al 2010 for all the mechanisms that are currently studied by solar or climate scientists. (I'm not such a scientist, so I ignore if muoncounter is correct when he says : "(UV) is a weak hypothesis at best".) For a more than 60 yrs lag, I see no real basis for excluding this hypothesis. Ocean time response takes decades to millenias – that's why GHGs will influence climate on very long term, even if we stop rapidly their emissions. I suppose the same is true for solar forcing, so any change in TSI (or relevant metric) from Maunder to present (for example) could have a weak but real influence on present climate. For me, it would give a bad impression of "settled science" to go beyond the IPCC conclusion and to state that we are virtually certain there is no residual influence (which would imply a "high level of understanding"). I underscore "residual" because the point we're discussing here is not the Sun as a major driver for 1979-2010 T trend (denialist fantasy), but the Sun as a possible cause of a (very small if any) part of the trend. For the aerosol point, OK, but of course the cause of change in surface temperature is not the same, as it implies SW radiation for aerosols and LW radiation for GHGs. You can perfectly have a 30 yrs warming trend with no change in GHGs, just because aerosols decrease in the period. #85 muoncounter : don't understand why you insist on such details, my initial point (in Christy discussion) was that "FR2011 is not an attribution study", and de facto, it is not. As I added : "AOGCMs simulations, which are in charge of such attribution, suggest the 0,16 K/dec signal FR2011 have separated from natural noise very likely emerges from GHG forcing", there is no matter for debate here. Your quote from IPCC is clear : there is no "demonstration" in FR2011 because it is a statistical paper on (some) noise and not a physical paper on the origin of the signal (the very definition of an attribution). And you miss other quotes in 9.1.2, for example : Both detection and attribution require knowledge of the internal climate variability on the time scales considered, usually decades or longer. The residual variability that remains in instrumental observations after the estimated effects of external forcing have been removed is sometimes used to estimate internal variability. However, these estimates are uncertain because the instrumental record is too short to give a well-constrained estimate of internal variability, and because of uncertainties in the forcings and the estimated responses. Thus, internal climate variability is usually estimated from long control simulations from coupled climate models. #86 Albatross : "What you state is exactly what is being done. Scientists and SkS are not pinning everything on FR11" Please, recall the precise background. The very last part of the discussion here is related to the SkS paper on Christy and UAH . In this paper, SkS relies mainly on FR2011 and HK2011 to contradict a point in press release. I suggested it is not the beter choice, because FR2011 will not answer to the Christy's point. (I also suggested Christy's point was pure rhetoric and probably choose to be so, that is formally exact but physically uninteresting).
    0 0
  40. skept.fr @89, "Please, recall the precise background. The very last part of the discussion here is related to the SkS paper on Christy and UAH." Please note that I am, of course, very well aware of the background and context.Please note too the objective of the post; specifically note too that it is not meant to be an overview of attribution papers. Dana merely cited two recent examples of papers in the literature that challenge Spencer's ridiculous (and unsubstantiated) assertion/rhetoric. I agree with you that of the two papers, HK11 is the attribution study. But again, it is a moot point, because neither FR11 nor SkS claimed that RF11 was an attribution paper. We also seem to be in agreement that Spencer and Christy are (probably) knowingly engaging in rhetoric and making unsubstantiated and misleading claims-- those are the key issues. I hope we can agree that that is very troubling and not at all consistent with the actions of reputable scientists. No?
    0 0
  41. #90 Albatross : of course we can agree on your last point. (But very frankly, such careful analysis of press releases is not my cup of tea, because press releases have no scientific value.) #88 Tom (sorry I miss your message when answering to others). a) Don't understand your point. Long term solar influence (in the sense of #89) is not particularly related to the 11 yr cycle variation, but to multicycle trend (if any). And spectral change may be more complex than we thought, there is a current debate (for example SIM-SORCE and VIRGO-SOHO do not find the same UV versus total variation in recent cycle 23). b) Point already discussed, but not relevant for the question (precision of GHG attribution) as a removal of ENSO (from MEI data) cannot be seriously described as a "precise" analysis of forced and unforced multidecadal variability. c) Spencer's vague assertions on his blog are not mine. (As I said to Albatross, afterthoughts of UAH team are not exactly an intellectual challenge IMO!) I don't know for Christy, but I recall that Spencer have written on his blog he believes GW comes fron "Mother Nature". I think this is a false belief, and I observe that when Spencer tried with Braswell to advance more scientific arguments, he was contradicted by Dressler. Sufficient to build my (provisional) opinion about the importance of his Mother Nature hypothesis, when compared to dozens of convergent articles on observation, detection or attribution.
    0 0
  42. Tisdale has a very interesting rebuttal to this paper at WUWT today.
    0 0
  43. @ dalyplanet
    "Tisdale has a very interesting rebuttal to this paper at WUWT today."
    Methinks someone has an "interesting" definition of "rebuttal".
    0 0
  44. I find myself these days asking the question...."What would be hard questions to handle if a denialist queries part of my presentation on AGW?" Since the Foster - Rahmsdorff multiple regression analysis is one of the important parts of any AGW presentation,IMO, my imaginary denialist is now asking me: "The establishment, peer reviewed literature has allowed publication of an article to the effect that lessening of stratospheric water vapor has temporarily slowed global warming ...see http://www.heatisonline.org/contentserver/objecthandlers/index.cfm?ID=7634&Method=Full.... SKS had no particular quarrel with this article, I recall; only in its over interpretation by others. Then why is this effect of lessening stratospheric water vapor (apparently) completely removed by the method of Foster and Rahmsdorff?
    0 0
  45. curiousd, Please provide a working link. I'm also confused by the wording of your "argument." "Has allowed?" It passed peer review, that's all. That doesn't make it true, that just makes it good enough for everyone to decide if it's true. What are the published comments on the paper? Have subsequent papers been published that rebut it? Is it being properly interpreted in this context? I personally have never seen such an argument, and even if it is, I don't necessarily see it as incompatible with F&R 2012. My next step would be to see if, when adding stratospheric water vapor to the F&R methodology, how much and in what direction it contributes.
    0 0
  46. Sphaerica, the link below seems to work for me: http://www.heatisonline.org/contentserver/objecthandlers/index.cfm?ID=7634&Method=Full That being said, when someone uses the phrase
    "...my imaginary denialist is now asking me..."
    it raises the hackles on the back of my neck.
    0 0
  47. Honestly if you're going to argue that changes in solar activity from over 60 years ago could be causing global warming today, you might as well argue that subterranean unicorn farts are causing global warming too. Just because we can't conclusively disprove something doesn't mean that it's remotely physically plausible.
    0 0
  48. curiousd @94, I am not up on the maths used by Foster and Rahmstorf, but my understanding is that they took four indices, one each for solar, ENSO, and volcanic activity, and a linear trend; and regressed them against the temperature record. The only check that these are all the factors involved is that the residuals have a normal distribution. Using this method, if there were a fifth factor whose activity was highly correlated with one of the four factors used by Foster and Rahmstorf, its effects would have been included with the regression of that factor. Thus, if stratospheric H2O was causing a near linear cooling trend in surface temperatures, it would have been included in the analysis simply as a reduced global warming signal (the linear trend) and the linear trend should be interpreted as the consequence of two factors (increased GHG forcing plus decreasing stratospheric H2O) rather than the consequence of one. Alternatively, as stratospheric temperatures are significantly effected by solar activity, the effect of reduced stratospheric H2O may by highly correlated with the solar signal. As Sphaerica points out, the test of this supposition would be to find an index of stratospheric H2O, and to repeat Foster and Rahmstorf's analysis with five indices rather than four.
    0 0
  49. @curiousd Firstly it is rather overstating things to suggest that the "Foster - Rahmsdorff multiple regression analysis is one of the important parts of any AGW presentation"; it isn't, it is a useful analysis that shows that the recent "hiatus" in global temperatures can be adequately explained by the observed forcings and ENSO. If it wasn't for the "skeptics" bloviating on about the hiatus and promulgating multiple misunderstandings of statistical significance, Foster and Ragmsdorff would get far less attention that it does. The really important parts of an AGW presentation are about physics, not statistics. What Foster & Rahmsdorff are not doing is claiming that their regression analysis is a solid attribution study (as far as I can see), so it isn't that surprising that there may be other elements relevant to a proper attribution (e.g. cloud cover, aerosols etc.) that do not appear in the analysis. Regression analysis has a problem called "missing variable bias", which basically means that if one of your explanatory variables is correllated with some relevant variable that is not included in the analysis, it will act as a proxy (to some extent) for the missing variable. This means that a regression analysis can be used to show that something can be explained by X, Y and Z, but not that it is explained by X, Y and Z. This is what Foster and Rahmsdorff are aiming to do, i.e. demonstrate that observed temperatures can be explained by a linear trend, solar forcing, volcanic forcing and ENSO, and therefore there is no real reason to be greatly surprised by the apparent hiatus that is the focus of so much interest. The analysis is primarily useful in combatting misinformation.
    0 0
  50. Elsewhere, RobertF writes:

    "I am a sub-beginner and probably a bit skeptical of both sides. Recently, I saw a graph from Rahmstorf showing a continuing warming. A denier friend informs me that Rahmstorf cooked the books by adjusting for ENSO, in part. The rationale given is that ENSO has no direct global impact and thus surface temperatures cannot be adjusted for what is a local phenomenon. As justification, the denied offered a citation from Trenberth: "Although it is possible to use regression to eliminate the linear portion of the global mean temperature signal associated with ENSO, the processes that contribute regionally to the global mean differ considerably, and the linear approach likely leaves an ENSO residual."

    What am I missing? Thanks in advance!"

    Your "denier friend" is being no friend in feeding you such nonsense.

    To begin with, the link between fluctuations in ENSO and changes in mean global surface temperatures is well established - and is the dominant short term (1-2 year) influence on global temperatures.  This has been established by (among many more credible sources), the noted "skeptics", McLean, Carter and DeFreitas, who produced this figure comparing detrended middle atmosphere temperatures with the Southern Oscillation Index (SOI):

    As you can see, except where there is volcanic cooling, the correlation is very close.  Consequently there is no doubt that ENSO is responsible for most of the interannual variability in GMST.  A fact so well established that even leading "skeptical" scientists are publishing on it is hardly one we should disagree with on the word of an anonymous friend.  

    (Note, use of this figure should not be taken as endorsement of McLean et al's ludicrous claim that because they show a correlation with the detrended GMST, therefore ENSO is responsible for the long term trend in GMST.)

    So, given that there is an correlation, what are we to make of Trenberth's claim?  You will note that he does not say there is no correlation, only that "a linear approach is likely to leave a residual".  And if you look closely at the Foster and Rahmstorf adjusted data above, you will see exactly that residual.  It is most obvious in the peak at 1998, and the trough in 2008 corresponding to the 1998 El Nino and the 2008 La Nina respectively.

    "Leaving a residual" does not mean that there is no relation between ENSO and GMST as your friend would have you believe.  It merely means that the effect is not a simple multiple of the strenght of the ENSO signal.  Therefore any approach which treats it as such (including F&R) will leave a small part of the ENSO signal in the data, ie, a residual.  The effect will be that such approaches will understate the effect of ENSO on short term temperature trends.  Had F&R used a more sophisticated approach, they would have shown still stronger long trends over the last two decades than they actually show (although probably within statistical error of the trends they do show).

    Of course, you do not need a sophisticated statistical method such as F&R to see what recent temperature trends would have been without the effect of ENSO.  You merely need to group like with like - El Nino years with El Nino years, La Nina years with La Nina years - and thus determine the trend largely without any ENSO influence.  John Neilson-Gammon has done exactly that:

    As you can see, the trends for different types of years are approximately the same.  Unsurprisingly, that trend, 0.16 C per decade, is very close to that found by F&R.  (The slight difference is partly accounted for in that this method does not account for the recent cooling of the Sun.)  More importantly, recent years fall very close to there respective trend lines.  Therefore there has been very little recent cooling beyond the switch to a La Nina dominated pattern.

    ENSO may not be the whole story in the recent lower trends in GMST.  Scientists, being scientists, explore every possibility.  But clearly ENSO is the dominant factor, and the other factors which scientists are exporing are additional effects - effects without which we would have seen an acceleration in global temperature rise.  "Skeptics" like to drag those other studies across the trail to suggest ENSO is not a clear and dominant factor.  The want to treat the diligence of scientists in exploring every factor as proof that no factor explored by scientists explains the recent lowered trends.  But that is a simple pea and thimble game.  Scientists know that ENSO is a dominant factor in the recent reduced trends.  All that is at issue is how much of an effect it has had, and how much influence (if any) other less certain factors have had.

    0 0

Prev  1  2  

You need to be logged in to post a comment. Login via the left margin or if you're new, register here.


The Consensus Project Website

THE ESCALATOR

(free to republish)


© Copyright 2024 John Cook
Home | Translations | About Us | Privacy | Contact Us