Climate Science Glossary

Term Lookup

Enter a term in the search box to find its definition.

Settings

Use the controls in the far right panel to increase or decrease the number of terms automatically displayed (or to completely turn that feature off).

Term Lookup

Settings


All IPCC definitions taken from Climate Change 2007: The Physical Science Basis. Working Group I Contribution to the Fourth Assessment Report of the Intergovernmental Panel on Climate Change, Annex I, Glossary, pp. 941-954. Cambridge University Press.

Home Arguments Software Resources Comments The Consensus Project Translations About Support

Bluesky Facebook LinkedIn Mastodon MeWe

Twitter YouTube RSS Posts RSS Comments Email Subscribe


Climate's changed before
It's the sun
It's not bad
There is no consensus
It's cooling
Models are unreliable
Temp record is unreliable
Animals and plants can adapt
It hasn't warmed since 1998
Antarctica is gaining ice
View All Arguments...


Username
Password
New? Register here
Forgot your password?

Latest Posts

Archives

Patrick Michaels: Serial Deleter of Inconvenient Data

Posted on 17 January 2012 by dana1981

Patrick Michaels is a research fellow at the Cato Institute think tank, the chief editor of the website World Climate Report, has been given a climate blog at the business magazine Forbes, and his articles are frequently re-posted at climate "skeptic" blogs like Watts Up With That (WUWT).  Despite his clear conflict of interest (Michaels has estimated that 40% of his work is funded by the petroleum industry), many people continue to rely on him as a reliable source of climate information.  This is an unwise choice, because Michaels also has a long history of badly distorting climate scientists' work.  In fact, not only does Michaels misrepresent climate research on a regular basis, but on several occasions he has gone as far as to manipulate other scientists' figures by deleting parts he doesn't like.

Patrick Michaels is a serial deleter of inconvenient data.

Hansen 1988

Skeptical Science has previously documented the most high-profile example of Michaels' serial data deletions, which involved James Hansen's 1988 study projecting future global warming.  James Hansen is a scientist at the NASA Goddard Institute for Space Studies (GISS), and one of the world's foremost climate scientists.

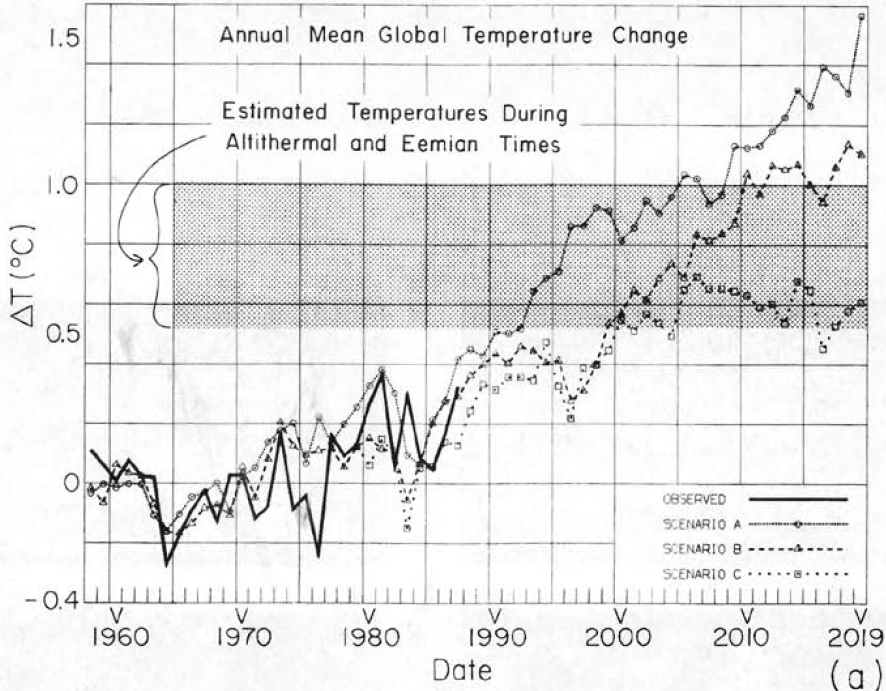
Climate scientists aren't in the business of predicting how human greenhouse gas emissions will change in the future - that is a policy question.  Instead, climate scientists predict how the climate will change in response to a series of possible emissions scenarios (for example, continuing with business-as-usual emissions, dramatically cutting our emissions starting in the year 2020, etc.).  In 1988, Hansen used the NASA GISS climate model to predict how the planet would respond to three possible scenarios.  Scenario A assumed continued exponential (accelerating) greenhouse gas growth.  Scenario B assumed a reduced linear rate of growth, and Scenario C assumed a rapid decline in greenhouse gas emissions around the year 2000.  Hansen believed Scenario B was the most likely to come to fruition, and indeed it has been the closest to reality thus far.  In the summer of 1988, Hansen presented his results in testimony before U.S. Congress.

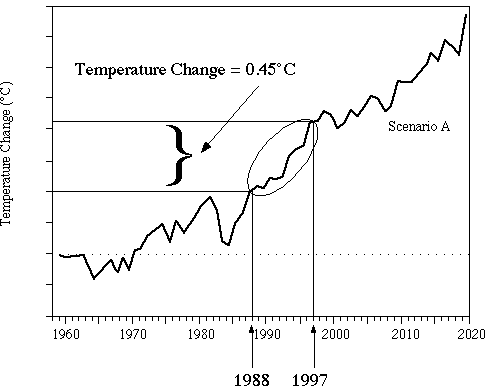
Ten years later, with the Kyoto Protocol international agreement to reduce greenhouse gas emissions in the works, Patrick Michaels was invited to testify before Congress about the state of climate science.  He spoke of Hansen's 1988 study, and in the process, grossly misrepresented its projections and accuracy by deleting Scenarios B and C, wrongly asserting that the planet had warmed "more than four times less than Hansen predicted." 

Original Version

Hansen 88 Figure

Michaels Version

Michaels Hansen Deletion

James Hansen had this to say about Patrick Michaels' distortion of his work:

"Pat Michaels, has taken the graph from our 1988 paper with simulated global temperatures for scenarios A, B and C, erased the results for scenarios B and C, and shown only the curve for scenario A in public presentations, pretending that it was my prediction for climate change. Is this treading close to scientific fraud?"

Michaels certainly didn't mess around with his first known case of data deletion, using it to mislead our policymakers as they decided whether or not to commit to reducing American greenhouse gas emissions (they ultimately refused to ratify the Kyoto Protocol).  Michaels' other data deletions, while being almost as misleading, were not made on nearly as grand of a stage.

Schmittner 2011

Another example of Michaels' serial data deletion involved a paper by Schmittner et al. last year which attempted to estimate the climate sensitivity - how much the planet will warm in response to a continued rise of greenhouse gases.  Schmittner et al. used geologic data to calculate the climate sensitivity based on the transition between the Last Glacial Maximum (LGM) and the current relatively warm interglacial period (approximately 20,000 years ago), and came up with an estimate towards the lower end, but within the likely range listed by the Intergovernmental Panel on Climate Change (IPCC).

However, there are two strong caveats associated with their results.  First, based on their interpretation of the geologic data, they estimated a smaller temperature change from the LGM transition than most previous studies, which was the main reason that their climate sensitivity estimate was relatively low.  Had they used a more widely-accepted global temperature change for the period in question, their climate sensitivity estimate would likely have been very close to the most likely estimate from the IPCC.

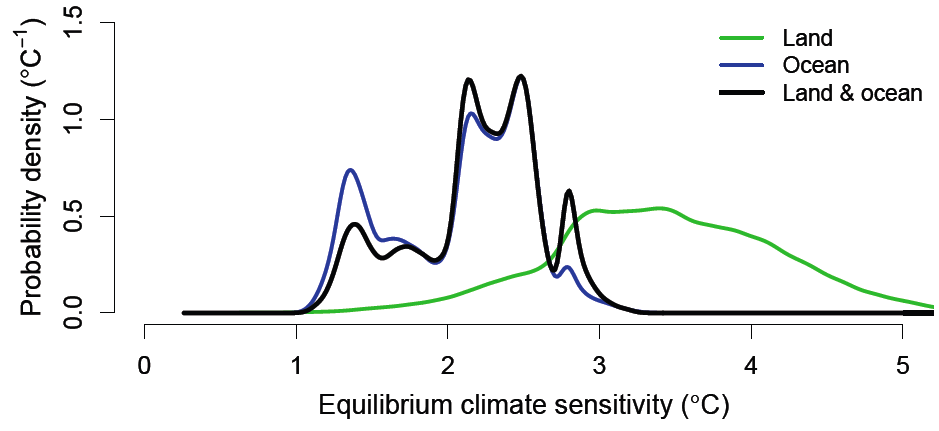
Second, and more relevant here, Schmittner et al. arrived at two fairly different results when they used ocean temperature data as opposed to land temperature data.  Their climate sensitivity estimate based on land-only data was significantly higher than with ocean-only data.  When they combined the two, the result was close to the ocean-only estimate, because the majority of their data came from ocean measurements.

This is an important caveat because climate sensitivity applies to the planet as a whole.  If different results are obtained from ocean and land data, then we can't be sure which is correct, and in fact many climate scientists are skeptical of the small LGM temperature change estimate, which is based heavily on the ocean temperature data.  Thus Schmittner et al. felt it important to include both estimates in the figures in their study.

However, it is very important for climate "skeptics" like Patrick Michaels that climate sensitivity be low.  This would mean that the planet will not warm as much in response to rising greenhouse gases, and we don't have to worry about reducing our emissions as quickly.  Thus as he did with Hansen's figure, Michaels deleted the inconvenient data from the figure in Schmittner et al., leaving only the combined estimate, which as noted above, is heavily weighted by the lower, ocean-based climate sensitivity estimate. 

Original Version

schmittner sensitivity

Michaels Version

Michaels Schmittner Deletion

On Planet 3.0, thingsbreak had an excellent interview with Nathan Urban, co-author of Schmittner et al., in which Michaels' distortion of his results was discussed:

"World Climate Report doctored our paper’s main figure when reporting on our study.  This manipulated version of our figure was copied widely on other blogs....I find this data manipulation problematic.  When I created the real version of that figure, it occurred to me that it would be reproduced in articles, presentations, or blog posts.  Because I find the difference between our land and ocean estimates to be such an important caveat to our work, I made sure to include all three curves in the figure, so that anyone reproducing it would have to acknowledge these caveats....I find the result of their figure manipulation to be very misleading...They intentionally took our figure out of the context in which it was originally presented, a form of “selective quotation” which hides data that does not support their interpretation...I find World Climate Report’s behavior very disappointing and hardly compatible with true skeptical inquiry"

Gillett 2012

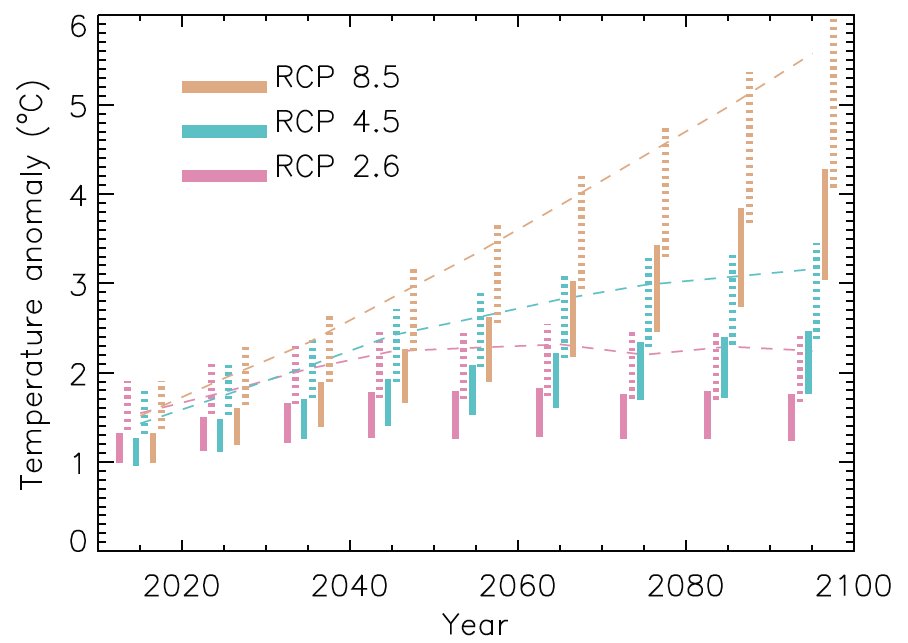
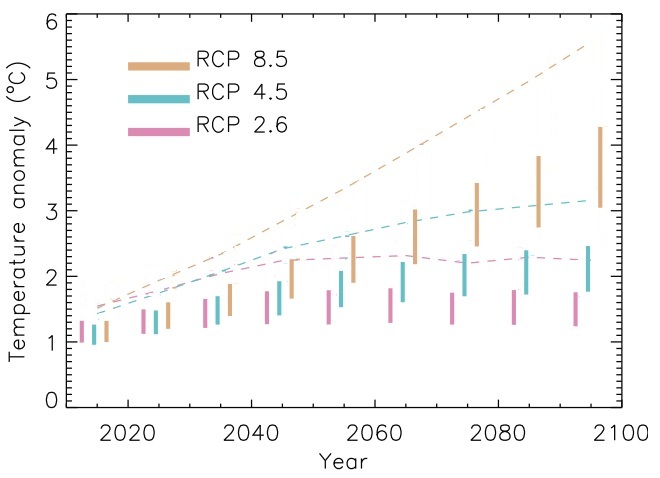
The latest example of Michaels' serial data deletion involves a recent paper by Gillett et al. which like Hansen (1988), projects future global warming in several different emissions scenarios.  However, Gillett et al. made three different projections for each scenario.  For the first projection, they simply ran their climate model to see how much global warming it would predict in each scenario.  For the other two projections, they scaled their climate model run based on observational temperature changes that they estimated from greenhouse gases and other influences over two timeframes, 1851-2010, and 1901-2000.

In their figure showing the results of these projections, they illustrated the results using the two different timeframes, because the results in each were markedly different.  When Gillett et al. constrained their model using the timeframe from 1851 to 2010, the model projected less warming than when they used the timeframe from 1901 to 2000.  

This is a very similar situation to Schmittner et al., in that using two different sets of data produced two fairly different sets of results.  Thus like Schmittner et al.,  Gillett et al. made a point to note the fact that their results were very sensitive to the timeframe they used, and included both results in their figures

But once again, the data projecting larger future global warming was inconvenient for Patrick Michaels' narrative, so he simply deleted it

Original Version

Gillette Projections

Michaels Version

Michaels Gillett Deletion

In these figures, the dashed lines in the horizontal direction are the projections from the unconstrained climate model for the three emissions scenarios (the RCPs).  The solid vertical lines are the model projections using the 1851-2010 data, and the dotted vertical lines (deleted by Michaels) are the model projections using the 1901-2000 data.

Deleters and Enablers

In every case discussed above, Michaels has deleted the data which contradict his constant arguments that the planet will warm less than most climate scientists expect, and thus that global warming is nothing to worry about.  Given his history as a serial data deleter, rather than being given so many platforms from which to spread his misinformation, Patrick Michaels (and certainly the World Climate Report website) should be considered an unreliable source of information.

This is a problematic situation.  There are a large number of people who simply don't want to accept the scientific reality that humans are causing rapid global warming.  However, this reality is accepted by the vast majority of scientific experts, because it is supported by the preponderance of scientific data.  Denial enablers like Anthony Watts, Forbes, and other media outlets have found a way around the first problem by giving fake skeptics like Patrick Michaels a platform to speak to those who are in denial about the science.  Patrick Michaels has found a way around the second problem by simply deleting the data which is inconvenient for his narrative, only presenting his audience with the bits of evidence which seem to support their denial, as long as the inconvenient data are ignored.

0 0

Printable Version  |  Link to this page

Comments

Prev  1  2  3  4  Next

Comments 101 to 150 out of 191:

  1. Eric @99, Thanks. I tried to have a look over there a little while ago and their site was not working properly-- probably part of their protest over SOPA. I didn't kow that they pre moderate comments there... Long day here, time to get some more work done and then rest.
    0 0
  2. Further to Albatross's observations at #67 on Chip Knappenberger's comment:
    "While data might be sacred, how it is displayed or used, is not."
    it is worth noting that not only is the accurate and faithful visual depiction of data also "sacred", but the honest reporting of peer-reviewed work is too. What Michaels, Knappenberger, and Watts did was to take material that had been reviewed and assessed by professional experts, and that had been accredited as such by the fact of publication, and then post hoc alter the original authors' intended assessment. It's one thing to construct de novo the sort of pseudoscientific, bogus, BlogoscienceTM nonsense that is consistently paraded at W[W]WT, but it's another to fiddle with peer-reviewed material in order to misrepresent it to the lay audience. Others have made similar observations on this thread before me, but it bears repeating and expanding on - when an amateur deliberately manipulates data in order to present an inaccurate or a misleading impression to a third party it qualifies at the least as deception; when a professional does this, it is scientific misconduct. IMHO.
    0 0
  3. #51 Chip : You're free to use data however you want, although an honest broker will always explain which data they've selected and why. However, such analysis will not have gone through peer review and will not have been checked for mistakes, misleading choices etc. Take most of WUWT's scientific 'analysis' for example: their conclusions aren't in peer reviewed journals because their analysis would fail peer review. So how to get the impression of peer reviewed work (i.e. stuff that's been filtered for mistakes or misleading choices) supporting your conclusion? One way would be to take graphs from the peer reviewed literature and delete the data points that disagree with your opinion. A reader might think 'oh, this is real peer reviewed data and the analysis was good enough to get in a proper scientific report, maybe this blog post is right'. Unless you made it abundantly clear exactly what you'd done and why in the caption attached to the graph, then you'd be misleading your audience. Something that should be completely unacceptable in scientific debate and I don't see how anyone could think otherwise.
    0 0
  4. Chip @78, Michaels was attempting to denigrate a graphic because it *didn't show any* power outages in a given year, and the graphic's legend said "Most outages occur in local distribution networks and are not included in the graph.” Can you see how leaving out that information makes it seem like you have a strong point, when really you don't? How is that not deceptive?
    0 0
  5. Wow, you guys at SS are getting bashed lately in the skeptical blogosphere lately for manipulating quotes, especially concerning the Michaels story. Is this true? H
    0 0
  6. @150 hank_ Well, I could say "No", but then it becomes a he said/she said Yes or No situation, so I wont. Just carefully read the post and the links therein and decide for yourself if quotes were manipulated and by whom. Might be a revealing experience regarding the reliability of skeptic claims.
    0 0
  7. Hank @105, that we are being "bashed" on the "skeptical" blogosphere says all you need to know. Evidently the people taking swings at us only have the courage to do so in our absence, and where they are not required to back up their claims with evidence. And before you say, "Sauce for the goose ...", I am sure Dana would be happy to raise the allegations in the main post on Michael's own blog. The problem is, Michael's doesn't have the courage to allow comments, which might result in his needing to back up his claims with evidence. Please note, the proper abbreviation of Skeptical Science is SkS. We avoid using "SS" because some of those oh so courageous "skeptical" bloggers have in the past deliberately made comparisons between Skeptical Science and Hitler's Schutzstaffel based on a coincidence of initials. This says all you need to know about their moral virtues, and the quality of their arguments.
    0 0
  8. If SkS is getting "bashed" in the "skeptical blogosphere", it means we must be doing something right. The truth hurts, and people in denial don't react well to it.
    0 0
  9. Aye, Tom. It's easy to stand behind a wall, sneer, and preach The Truth. This is an open forum. Thanks for the report from behind the wall, Hank. Do you have anything of substance to add? Perhaps you could represent the bashers, since they seem to be taking the day off from open dialogue. Not up to it? Just the messenger? By the way, look at what you posted carefully. What exactly are you asking? If SkS is being bashed? If so, you just reported that SkS is. If you meant to ask about manipulation, read this thread for yourself.
    0 0
  10. Ultimately this isn't really about the graphs. Michaels claimed that Hansen 1998 made a prediction, that global temperature anomalies would increase by 0.45 C between 1988 and 1997, which it did not. Yes, he used a doctored graph to support this claim, but it is the false claim itself which is the essential problem. Likewise, Michaels claimed that Schmittner 2011 found low climate sensitivity... when, in truth, it did not. Again, he doctored a graph to support the false claim, but the graph is not the issue. It is just the prop on which the false claim was based. Ditto Gilette 2012. Michaels falsely claimed it found low future warming... by removing the portions of the graph showing potentially high future warming. It isn't the act of making changes to a graph in and of itself which is problematic. Additions and removals from graphs can be just fine. For instance, if one of Hansen's emissions scenarios had happened to exactly match observed emissions then it would have been reasonable to show a graph based on just the warming from that scenario. Michaels went wrong in using temperatures based on an emissions scenario which did not match observations and falsely claiming this was what Hansen predicted. So, again, the modifications to the graphs are not the root problem. The false claims which the graphs were modified to 'support' are the issue.
    0 0
  11. CBD @110 - exactly. Chip has attempted to defend the WCR deletions by saying we could just cover up the figures and there would be no problem with their posts. That totally misses the point. Their posts also completely ignore the inconvenient data, and thus they wrongly claim that the papers support their assertions of low climate sensitivity and/or relatively little future global warming. The papers only support those assertions if you ignore the inconvenient data. Michaels' deletion of Hansen's Scenarios B and C is in a whole other league of distortion. I'm working on another post examining that one in more depth. Look for it to be published here probably on Monday.
    0 0
  12. @106 - 108 Pardon my ignorance of the whole Michaels situation. But none of you have answered the original question; Has the SKS staff manipulated statements from Michaels and then presented them here as an actual quote from him? That's what has been said elsewhere. H
    0 0
    Response:

    [dana1981] No, as a few commenters have noted, there is only one statement from Michaels in the above post, and it is a direct quote from his congressional testimony.  I would be interested to know exactly how we are purported to have "manipulated statements from Michaels."

  13. hank_ - Yes, SkS* is getting a lot of attention on 'skeptic' blogs right now. I suspect that's because this particular topic, distortions of data and science by advocacy groups such as Michaels' are a serious and telling issue. And having that particular flaw pointed out bothers some folks. "Manipulating quotes"? There's a clear Comments Policy, violators of that are deleted or snipped to remove offensive or over the line language - and that's an open requirement to participation. In the Michaels post itself - the only quotes I see there are from scientists extremely unhappy with Michaels' selective editing of their graphic data representations. There have been a few Ad Hominem Tu Quoque fallacies thrown out (And You Fallacy); but quite frankly there's a difference between SkS posting some of the graphics/text of a paper with direct references (as opposed to reproducing entire papers each time) - and what Michaels has done, which is to edit graphs to change the presentation, which is equivalent to deliberately misquoting a person to portray them as having a diametrically opposed position. But: Read it yourself, hank_, look up the original sources as well, and judge for yourself. * Note the abbreviation - unwarranted associations with WWII are implied ad hominem's.
    0 0
  14. hank_ - My apologies, the opening post does indeed include a Michaels quote: asserting that the planet had warmed "more than four times less than Hansen predicted." That's part of the Congressional Record, and is indeed an incorrect assertion when you have actually read Hansen's paper and looked at the data. So, no.
    0 0
  15. Hank, so far as I can tell the only purported quotation of Michaels in the document above is that he said; "more than four times less than Hansen predicted." These words can be found in CATO article by Michaels here. Thus, I see no evidence supporting the claim you are reporting. If you had some information on precisely what misquotation is being claimed it might then be possible to provide a more direct answer.
    0 0
  16. Hank Which quotes are you referring to?
    0 0
  17. Why would someone ask a question when the answers are right there in front of him/her? Further, why would someone ask such a question while admitting ignorance of the situation being discussed? I could make this a multiple choice question, but several of the choices would violate the comments policy. DNFTT
    0 0
  18. @hank_ #112 Lest there be any confusion, there is no such thing as "SkS staff." All of the SkS authors are unpaid volunteers.
    0 0
  19. Coincidentally, Watts is now censoring my comments on WUWT, and of course there are no comments allowed on WCR, so obviously any discussion of Michaels' data deletions will have to occur on SkS.
    0 0
  20. hank: Have the pseudoskeptics can point out exactly where in the OP or comments Michaels is misquoted? As far as I have seen, every reference to Michaels' Congressional testimony or to WCR posts directly cite the appropriate texts (and provide links such that they can be checked for accuracy by anyone who cares to do so). I must confess I suspect that much of the brouhaha is for the benefit of those who will not take the time to review SkS' post.
    0 0
  21. @ John Hartz
    "All of the SkS authors are unpaid volunteers."
    So what am I to do with this stack of IOU's...?
    0 0
  22. Dana@119, So, despite vocal claims to the contrary, Watts et al. really are not interested in open scientific discourse. How hypocritical of Anthony Watts. But that does not surprise me in the least. So we now know, by their own actions, that neither WUWT nor WCR (Michaels et al.) nor Pielke Senior are interested in open dialogue and permitting people to freely critique or challenge their assertions on their own turf. Ironically, if Watts or Michaels had the gumption to post here, they would be welcome to (assuming they can follow the house rules of course).
    0 0
  23. Daniel and John, "All of the SkS authors are unpaid volunteers." In contrast, Pat Michaels and Chip Knappenberger have quite the fiscal (-snip-) to do what they do. They are paid generously apparently for the purpose of (-snip-) debate, (-snip-) doubt and (-snip-) Congress and the American people about climate science.
    0 0
    Response:

    [DB] Inflammatory snipped.

  24. This information about Waxman wanting to call Michaels back to answer for some of his false statements is interesting. We've also previously discussed false testimony to congress from Monckton and others. It would be nice to see a hearing to correct all the dis-information in previous climate hearings.
    0 0
  25. "It would be nice to see a hearing to correct all the dis-information in previous climate hearings." It would be. But my guess is that won't happen because the stakes for are too high for those responsible(misleading congress is a federal offense), and the will in congress to force a proper accounting against those headwinds is simply not there at present.
    0 0
  26. Re my comment @123, My apologies, I should practice what I preach. My point was that unlike SkS authors, Michaels and Knappenberger are paid (and generously so) to do what they do. It is, hopefully, evident to readers by now exactly what that is.
    0 0
  27. Congress is not about to address lies that they want to hear, hence the field days had by barely competent individuals like Michaels, Monckton etc. In fact, it could be interesting for SkS to analyze closer the contents of these testimonies and make a list of the statements that constitute something else than "the whole truth and nothing but the truth." The expression certainly does not cover representing other's research as saying something different than what it actually says, which was done many times by Michaels and the sorry piece called WCR.
    0 0
  28. Hank, what's bee said "elsewhere" is false. Michaels' testimony to congress is a matter of public record. Instead of believing what you read "elsewhere" do your work and find out what the reality is. If you find it more convenient and emotionally pleasing to believe what they say "elsewhere" then you can do that. If you decide to do so, you will be as far as one can possibly be from skepticism.
    0 0
  29. Albatross@122, Comments are open (to the modestly well-behaved) over at MasterResource.org where I have just posted this: Global Lukewarming: A Great Intellectual Year in 2011 reviewing the implications of Santer et al. 2011, Foster and Rahmstorf 2011, Schmittner et al. 2011 and Gillett et al. 2012. -Chip Knappenberger
    0 0
  30. The MasterResource article is a re-tread of a few of the same misrepresentations we discussed here, and a few new ones. Instead I would recommend the more thorough and accurate SkS posts on these papers. Santer et al here and here, F&R here, Schmittner here, and Gillett here.
    0 0
  31. Some people at WCR really do either a problem with comprehension or paying loose with the truth. I said that "WUWT nor WCR (Michaels et al.) nor Pielke Senior are interested in open dialogue and permitting people to freely critique or challenge their assertions on their own turf". From the WCR page in which Michaels tries to justify doctoring scientists' graphs: "No Comments No comments yet. RSS feed for comments on this post. Sorry, the comment form is closed at this time" I do not appreciate people being dishonest with me and/or trying to misrepresent what I have said.
    0 0
  32. Disambiguation: "Hank_" is not me. I've been wondering if Michaels ever disclosed whose "advocacy science" he was doing -- this kind of stuff is either funded research to be presented to the lawmakers or courts, or it's what Michaels has been doing, taking published science and taking out the inconvenient parts. It's what advocates do. Legal advocates take published law and take out the inconvenient parts and argue the part they're there to advocate. Michaels and his group can absolve their consciences by thinking, it's not a lie, it's work for hire.
    0 0
  33. Poor Albatross. I know it is difficult to keep one's temper down!! Chip is casually dishonest.
    0 0
  34. Dana @130, Note how Knappenberger elects to misrepresent not only the science but the scientists' position on AGW-- none of the papers support assertions/opinions that warming down the road will be "lukewarm" (a vague term at best, so it is difficult to make a quantitative analysis, I guess it can mean whatever the person using it wants it to mean). Specifically, to my knowledge Santer, Urban, Foster, Rahmstorf, Solomon, Mears, Wigley, Meehl, Stott, and Thorne (amongst the other authors of the papers cited) are all very much concerned about the impacts of doubling or trebling CO2 and it is my understanding that they do not advocate continuing with business as usual as advocated by WCR. So that makes the narrative of the Knappenberger opinion piece especially disingenuous. I am confident that some authors would take strong exception to Knappenberger misrepresenting their work and trying to use it to push a "lukewarm" agenda/narrative. Not only that, but any evidence that has been published the past year or so that showed model predictions are consistent with observations when one takes the inherent uncertainties into account or notes that there are still outstanding issues with the satellite tropospheric temperature estimates (e.g., Thorne et al. (2011a), Thorne et al. (2011b), Mears et al. (2011)) or papers that are consistent with the climate sensitivity reported in the IPCC's 4th assessment (e.g., Park and Royer (2011), Pagani et al. (2010), Previdi et al. (2011), Kiehl (2011)) were simply ignored in the Knappenberger piece. The opinion piece in question is a very clear attempt to bias and mislead people by ignoring the body of evidence. I should not be surprised, as their behavior is consistent with the topic of and material posted by them this thread. Now before certain apologists try and seize this as an opportunity to take this thread off topic to detract from them doctoring graphs, can we all please take future discussion to the relevant threads as linked to by Dana @130. Thanks.
    0 0
  35. hank_, it has come to my attention that one complaint of misquotation has some substance to it. At this stage all I can tell you is that the error was inadvertent, and that it is being corrected. I will not comment any further on this issue here as it is of topic on this thread (and should have been raised on the thread where the error occurred - but of course we would far rather errors be raised and corrected than that formalities like remaining on topic be observed).
    0 0
  36. Pssst, serious disambiguation -- "Hank_" is the guy using both the capital letter and underscore. "hank_" is the one with the lower case letter and the underscore. Neither of them is me. Is there any collision detection in the signup algorithm? Are we going to be joined by a "Hank" and a "_hank_" and a "_Hank" eventually? Aiee. If you wonder who's who, click the link behind the names, I suppose that can't be fudged.
    0 0
    Response:

    [DB] I keep tabs of who's-who; there's no confusing the two of you.

  37. 136, hank, _hank, _Hank, hank_, Hank_, and _h_a_n_k, It's probably an act of extreme hubris to register for a site on the world wide web using nothing more than a familiar form of one's own first name, don't you think? :D
    0 0
  38. The argument here (such as there is one) goes to intent. There is strong internal evidence (of the grade of finding a fish in a milk container establishing that the milk was watered) showing that Michaels simply COPIED the Gillett graph and erased the dotted lines Didn't do a very good job of it, you can spot it in the figure at normal size and it is completely clear when blown up. That sort of behavior is not ethical. Chip Knappenberger's argument that the 1851-2010 data is better than the 1901-2010 data is risible. Instrumental records are increasingly unreliable the further back you go, and more so pre-1900. If you doubt this take a look at the BEST record with uncertainty intervals shown
    0 0
  39. Dana @ 108
    If SkS is getting "bashed" in the "skeptical blogosphere", it means we must be doing something right. The truth hurts, and people in denial don't react well to it.
    Indeed: I'm reminded of Noam Chomsky's endorsement of Greg Palast; 'hated by all the right people'! This 'you deleted data with your chart, too' false-equivalance thing is one of the most transparently daft - and shameful - things I've seen in this debate, and that really is saying something.
    0 0
  40. Busted! Eli has a genuine point - that's certainly simple erasure of the original graph; and clumsy erasure at that! Shades of Don Easterbrook! Perhaps Mr. Knappenberger would care to run his tu quoque argument filter over this particular point...
    0 0
  41. Eric (skeptic), I responded to your post on WUWT only to find that WUWT no longer accepts my posts. The (-snip-) has strengthened the walls of his (-snip-)'s castle. In short, there is a common but not universal convention to use common axis for two distinct figures when their axis are identical. This was done in Knutti and Hegerl, and has no bearing on whether 3a and 3b are distinct. That they are distinct is established conclusively by the fact that they are distinctly enumerated.
    0 0
    Response:

    [DB] Inflammatory snipped.

  42. I just tried to go back to Eli's site to double check after reading through his evidence before. No luck...can't seem to scroll to the critical image now. Anyway, it definitely is unethical to just erase parts of a graph in an attempt to make an argument. That is basically fabricating a pattern. It's just a short step between that and completely fabricating data. That's a firing offense in academia, to my mind. It simply boggles the mind that Michaels would be careless enough to leave evidence of that.
    0 0
  43. You don't really even need to go to Eli's (which is working just fine as far as I can see). If you look carefully you can see intriguing artifacts, even at this resolution. Look at the RCP 4.5 dashed line at about 2045, for instance. Or the truncation of a dash in RCP 8.5 shortly after (both of these are detailed at Eli's). But you might also want to inspect the intriguingly truncated dash in RCP 2.6 at 2026. Or RCP 8.5 at 2076, for that matter. Or try this - copy each of the largest files available by clicking the embedded images above, superimpose the Michaels graph over the original in Photoshop on a separate layer, shift-resize it to perfectly match the original (it's slightly smaller, but identical in ratios, labels, and font, so zooms out nicely to overlay perfectly) and then switch this upper layer on and off as you sweep around and scrutinise the graphs.
    0 0
  44. Tom, I disgree. The primary purpose of fig 3b is to add details to 3a, and 3b would serve very little purpose standalone, confusing at best. Can you at least agree that 3b is subordinate to 3a? BTW, your reply to me has appeared at WUWT.
    0 0
  45. Oh yeah, Eric ('skeptic'), no one would ever figure out the whole 'range of climate sensitivity predictions based on various studies and types of evidence with the highest probability estimates centering on this temperature band' thing without figure 'b' now, would they? (Well, I had, but hell, I went to Art School for a while there.) This is your tit-for-tat equivalence? Pull the other one! Seriously: this really makes you all look completely ridiculous. Still, by all means keep at it, because it really does make you all look completely ridiculous.
    0 0
  46. Bill, I believe that 3a is perfectly understandable without 3b. I also said above and several times at WUWT that removing 3b is not equivalent to the Michaels graph editing. All I am disputing here is Tom's statement that 3b makes sense as a standalone graph (obviously including the labels from 3a). My point is very specific and narrow, perhaps even "ridiculous", but I won't let it be conflated with something I did not say.
    0 0
  47. Eric, I'd agree on the 'ridiculous' in that your point has zero apparent relevance regardless of whether or not you are correct. So why bother? What possible benefit could come from a debate over whether 3b can stand on its own or not? Again, while we have two situations of some information not being included they are obviously very different: In the SkS instance the additional details in figure 3b were not shown... but the writeup accurately described the conclusions of the paper. In each of the Michaels examples the details not shown were precisely those which would have proved that the claims he was making about the papers were false. The difference between 'not including every bit of detail' (heck, the next complaint could be that SkS didn't use exactly the same text to describe the figure, or didn't quote the entire paper... 'they excluded information!') and 'removing just the details which prove what you are saying is false' ought to be clear to everyone. So if you aren't trying to make a case for the SkS usage being somehow 'wrong' why continue talking about it at all?
    0 0
  48. CBDunkerson, because I asked Tom that question over at WUWT. The debate has no other possible benefit. But please show me the writeup here that describes the caveats of fig 3b in any of the dozen places where 3a is used because I have not seen it. I agree with your points, especially as you stated them in 110. My only reason for continuing my very minor discussion is to get an explanation for Tom of how figure 3b can be considered standalone.
    0 0
  49. BTW, I would please ask those who want to discuss the specifics of K&H08 fig 3b to do so here: /argument.php?p=5&t=268&&a=115#63452 where I pasted it with some of the rows labeled.
    0 0
  50. Eric (skeptic), I cannot do a search for all uses of a particular image. Consequently I am not able to with reasonable effort find all, or most of the used of that graphic on SkS to comment on. If you think it is worth the effort, you find an example where you think not including figure 3b of Knutti and Hegerl has resulted, or facilitated, in misrepresentation of some part of Knutti and Hegerl by SkS. Failing such an example, the issue is irrelevant to this topic. You may also want to find an example where not including figure 3b of Knutti and Hegerl has resulted in a failure to canvass issues that should have been canvassed in a post on SkS. Note that this is a distinct issue (on several counts) to the Michaels/Knappenberger doctoring of graphs. Never-the-less, it is a bare minimum for relevance in your current line of questioning, and has not been established. (In you believe you have found an instance of this type, please raise the issue in the thread where you find it so as to be on topic.)
    0 0

Prev  1  2  3  4  Next

You need to be logged in to post a comment. Login via the left margin or if you're new, register here.


The Consensus Project Website

THE ESCALATOR

(free to republish)


© Copyright 2024 John Cook
Home | Translations | About Us | Privacy | Contact Us