Climate Science Glossary

Term Lookup

Enter a term in the search box to find its definition.

Settings

Use the controls in the far right panel to increase or decrease the number of terms automatically displayed (or to completely turn that feature off).

Term Lookup

Settings


All IPCC definitions taken from Climate Change 2007: The Physical Science Basis. Working Group I Contribution to the Fourth Assessment Report of the Intergovernmental Panel on Climate Change, Annex I, Glossary, pp. 941-954. Cambridge University Press.

Home Arguments Software Resources Comments The Consensus Project Translations About Support

Bluesky Facebook LinkedIn Mastodon MeWe

Twitter YouTube RSS Posts RSS Comments Email Subscribe


Climate's changed before
It's the sun
It's not bad
There is no consensus
It's cooling
Models are unreliable
Temp record is unreliable
Animals and plants can adapt
It hasn't warmed since 1998
Antarctica is gaining ice
View All Arguments...


Username
Password
New? Register here
Forgot your password?

Latest Posts

Archives

On the reliability of the U.S. Surface Temperature Record

Posted on 22 January 2010 by John Cook

The website surfacestations.org enlisted an army of volunteers, travelling across the U.S. photographing weather stations. The point of this effort was to document cases of microsite influence - weather stations located near car parks, air conditioners and airport tarmacs and anything else that might impose a warming bias. While photos can be compelling, the only way to quantify any microsite influence is through analysis of the data. This has been done in On the reliability of the U.S. Surface Temperature Record (Menne 2010), published in the Journal of Geophysical Research. The trends from poorly sited weather stations are compared to well-sited stations. The results indicate that yes, there is a bias associated with poor exposure sites. However, the bias is not what you expect.

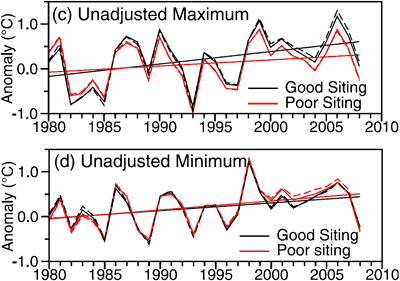
Weather stations are split into two categories: good (rating 1 or 2) and bad (ratings 3, 4 or 5). Each day, the minimum and maximum temperature are recorded. All temperature data goes through a process of homogenisation, removing non-climatic influences such as relocation of the weather station or change in the Time of Observation. In this analysis, both the raw, unadjusted data and homogenised, adjusted data are compared. Figure 1 shows the comparison of unadjusted temperature from the good and bad sites. The top figure (c) is the maximum temperature, the bottom figure (d) is the minimum temperature. The black line represents well sited weather stations with the red line representing poorly sited stations.
Maximum and Minimum Temperature Anomaly for good and bad sites
Figure 1. Annual average maximum and minimum unadjusted temperature change calculated using (c) maximum and (d) minimum temperatures from good and poor exposure sites (Menne 2010).

Poor sites show a cooler maximum temperature compared to good sites. For minimum temperature, the poor sites are slightly warmer. The net effect is a cool bias in poorly sited stations. Considering all the air-conditioners, BBQs, car parks and tarmacs, this result is somewhat a surprise. Why are poor sites showing a cooler trend than good sites?

The cool bias occurs primarily during the mid and late 1980s. Over this period, about 60% of USHCN sites converted from Cotton Region Shelters (CRS otherwise known as Stevenson Screens) to electronic Maximum/Minimum Temperature Systems (MMTS). MMTS sensors are attached by cable to an indoor readout device. Consequently, limited by cable length, they're often located closer to heated buildings, paved surfaces and other artificial sources of heat.

Investigations into the impact of the MMTS on temperature data have found that on average, MMTS sensors record lower daily maximums than their CRS counterparts, and, conversely, slightly higher daily minimums (Menne 2009). Only about 30% of the good sites currently have the newer MMTS-type sensors compared to about 75% of the poor exposure locations. Thus it's MMTS sensors that are responsible for the cool bias imposed on poor sites.

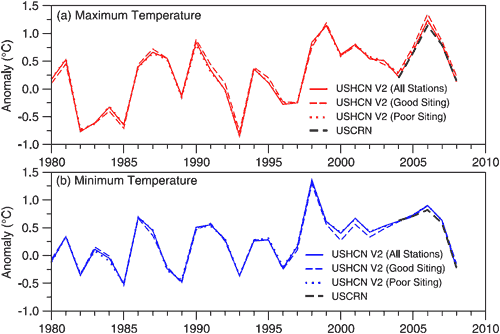
When the change from CRS to MMTS are taken into account, as well as other biases such as station relocation and Time of Observation, the trend from good sites show close agreement with poor sites.
Maximum and Minimum Temperature Anomaly for good and bad sites
Figure 2: Comparison of U.S. average annual (a) maximum and (b) minimum temperatures calculated using USHCN version 2 adjusted temperatures. Good and poor site ratings are based on surfacestations.org.

Does this latest analysis mean all the work at surfacestations.org has been a waste of time? On the contrary, the laborious task of rating each individual weather station enabled Menne 2010 to identify a cool bias in poor sites and isolate the cause. The role of surfacestations.org is recognised in the paper's acknowledgements in which they "wish to thank Anthony Watts and the many volunteers at surfacestations.org for their considerable efforts in documenting the current site characteristics of USHCN stations." A net cooling bias was perhaps not the result the surfacestations.org volunteers were hoping for but improving the quality of the surface temperature record is surely a result we should all appreciate.

UPDATE 24/1/2010: There seems to be some confusion in the comments mistaking Urban Heat Island and microsite influences which are two separate phenomenon. Urban Heat Island is the phenomenon where a metropolitan area in general is warmer than surrounding rural areas. This is a real phenomenon (see here for a discussion of how UHI affects warming trends). Microsite influences refer to the configuration of a specific weather station - whether there are any surrounding features that might impose a non-climatic bias.

UPDATE 24/1/2010: There has been no direct response from Anthony Watts re Menne 2010. However, there was one post yesterday featuring a photo of a weather station positioned near an air-conditioner along with the data series from that particular station showing a jump in temperature. The conclusion: "Who says pictures don’t matter?"

So the sequence of events is this. Surfacestations.org publishes photos and anecdotal evidence that microsite influences inflate the warming trend but no data analysis to determine whether there's any actual effect on the overall temperature record. Menne 2010 performs data analysis to determine whether there is a warming bias in poorly position weather stations and finds overall, there is actually a cooling bias. Watts responds with another photo and single piece of anecdotal evidence.

UPDATE 28/1/2010: Anthony Watts has posted a more direct response to Menne 2010 although he admits it's not complete, presumably keeping his powder dry for a more comprehensive peer reviewed response which we all eagerly anticipate. What does this response contain?

More photos, for starters. You can never have enough photos of dodgy weather stations. He then rehashes an old critique of a previous NOAA analysis criticising the use of homogenisation of data. This is curious considering Menne 2010 makes a point of using unadjusted, raw data and in fact, it is this data that reveals the cooling bias. I'm guessing he was so enamoured with the water pollution graphics, he couldn't resist reusing them (the man does recognise the persuasive power of a strong graphic).

0 0

Printable Version  |  Link to this page

Comments

Prev  1  2  3  4  5  Next

Comments 51 to 100 out of 214:

  1. Consider this jpark. The average global temperature anomaly (compared to the 1961-1990 average temperature)-according to GISS-for whole of the 1960's was -0.012 degrees C. For the 1970's, it was +0.002 degrees C (a change of +0.0122 degrees). For the 1980's, it was +0.18 degrees C (a change of +0.178 degrees. For the 1990's it was +0.321 degrees (a change of +0.141 degrees-would have probably been a higher change except for at least one major volcanic eruption) & for the 2000's, it was +0.515 degrees C (a change of +0.194). So we essentially see an acceleration in the rate of change for each decade, in spite of the fact that there was a downward trend in solar irradiance (of around -0.3 watts/meter squared per decade) over that same period. So I really don't see where the case for skepticism is.
    0 0
  2. Oh, & before you say that this is simply limited to ground based stations Remote Sensing Systems (one of the groups which processes data from the microwave sensing satellites) shows the following anomalies. For the 1980's, the average anomaly (when compared to the 1979-2000 average) was -0.065 degrees C. For the 1990's, the average anomaly was +0.083 (a change of +0.148 degrees) & the average anomaly for the 2000's was +0.258 degrees (or a change of +0.175 degrees). Again, an acceleration in the warming trend.
    0 0
  3. Marcus, there is a police investigation being conducted into the theft of the emails. http://news.bbc.co.uk/2/hi/uk_news/england/norfolk/8453117.stm
    0 0
  4. There is no UHI or microclimate influence over the oceans which cover 70% of the earth's surface. Trends in temps from these areas are comparable to those over land. Case closed.
    0 0
  5. Interesting. jpark arrives, writes more or less the same thing 3 times, then goes wildly off-topic. He tells us he will carefully read the links people have provided for him, but somehow I doubt he will. I visit this site to learn, not to have my time wasted. Thanks for the interesting and informative comments that others have made.
    0 0
  6. lord_sidcup at 01:03 AM on 25 January, 2010 I noticed the same thing. jpark sailed in under false colors, look like. I seem to remember something to the effect of "fence sitter", but unfortunately that seems to have been another performance of an old, tired gambit. Waste of time. So many people on the network, so few basic narratives to choose from, boredom is the upshot.
    0 0
  7. jpark, no one has parried your questions, they have answered very clearly; scientists understand the nature of the data they have, and know how to interpret it. Therefore, it is not 'duff.' Just because you and I do not see how it is used simply does not invalidate it. In order to doubt the scientists' word, you'd have to believe one of two things; they are lying, or they are incompetent and are mistaken. I do not offer the other possibility, that they are competent and mistaken, because while that is possible in the individual case and happens all the time, it is extremely unlikely when we are talking about tens of thousands of scientists in aggregate. This is a question you and I can examine without understanding the science. Proposition 1: Scientists are lying. I looked for a motive here. Two have been offered, that they are greedy, and that they are politically motivated. I dismissed greed because there are too many ways for scientists to make a good living in our world. A few may compromise their ethics to keep jobs or earn a few more dollars, but not the majority of scientists. Please grant that science is a difficult field and requires greater than average intelligence, thus some degree of foresight. Any scientist tempted by the short term gain that might accompany colluding in a lie, must realize that the discovery of that lie would mean the end of a hard-earned career. Examine the other essential component of the greed theory. It leads to the question of political motivation. Who would pay so many scientists to lie, and why? I am told they are global elites who want to destroy the Western economy. It seems counter to common sense that people would wish to destroy the system that gave them power. I had to either reject the theory that scientists are lying, or confidence in my own reasoning power. Sorry, jpark, I rejected the idea that tens of thousands of scientists gave up the very principles that led them to the difficult career field of their choice, to lie for a few dollars they could easily earn elsewhere. To believe that there is a vast political conspiracy, and that scientists from all over the world have bought into it, I think that a tin foil hat would not suffice. I would need a tin covered home and car, and a full-body tinfoil suit to wear every time I leave my tin house. Political motivation, rejected. I conclude that the majority of scientists are not lying.
    0 0
  8. Proposition 2: Scientists are incompetent and mistaken. We are talking about tens of thousands of scientists, from dozens of countries all over the world, in hundreds of different scientific academic, research and government institutions, from dozens of different scientific disciplines, approaching the problem from different directions, with different instruments and methods, coming to a common conclusion. While you can question the competence of some, you'd have to doubt the very fundamentals of science education worldwide to think they are all incompetent. I reject the idea that they do not know what they are talking about. jpark, I have looked at WUWT. I found very little serious comment there. I wanted to see what they made of David Barber's first hand observations of ice conditions in the Beaufort Sea last year. I looked at it at the same time that I looked at Barber's own summary report of his observations. The analysis in WUWT was one-sided, and the comments rarely rose above attacks on Barber's honesty, professionalism and competence. As I have said already, I have deeply considered the issues of honesty and competence, and have satisfied myself on those scores. WUWT is not very interesting to me as a source of valuable comment.
    0 0
  9. "UPDATE 24/1/2010: There has been no direct response from Anthony Watts re Menne 2010. However, there was one post yesterday featuring a photo of a weather station positioned near an air-conditioner along with the data series from that particular station showing a jump in temperature. The conclusion: "Who says pictures don’t matter?" Not surprising. It's transparent to every scientist how ridiculous his sort of rhetoric is, but not always to his target audience. A picture or two like this is psychologically more convincing to many non-experts than any detailed objective analysis. #45, It might be a good idea to do a post on what an anomaly is, why it's used instead of raw temperature values, and what a baseline is. It's pretty basic stuff, I know, but I've seen Anthony Watts post anomaly values side by side (gistemp, HadCrut, RSS, UAH), then imply that because gistemp is larger, it's biased high. #36, Schwartz et al. mostly explains what climate scientists already understand. In the absence of manmade aerosol cooling, and the ocean time lag, more warming would be expected from industrial GHG emissions than has been observed. Schwartz explains that much of the uncertainty from deriving the climate sensitivity estimate from the instrumental temperature record comes from the uncertainty in determining the amount of negative aerosol forcing. Where he might have some contention, I think, is in his assertion that the ocean time lag in heating explains 25% of the discrepancy between observed and expected warming. My understanding is that most scientists determine that this value is a bit higher. Lastly, the instrumental temperature record is only one method for determining climate sensitivity. Other methods yield a similar best estimate as the IPCC. http://www.skepticalscience.com/Working-out-climate-sensitivity.html
    0 0
  10. "Others here have parried my question rather than answered it. Is the actual data duff or not? If the data going into all the trendy models is bad then we, the public, will simply dismiss the model." Sigh. Temperature data doesn't go into the models. Neither the trendy nor the old boring ones. Temperature data is a model *outcome*, not *input*.
    0 0
  11. "If the data going into all the trendy models is bad then we, the public, will simply dismiss the model." Whoever said that, thank you, here's another opportunity to point folks to an actual description of models as opposed to rumors about models: http://www.aip.org/history/climate/GCM.htm
    0 0
  12. Doug Bostrom - I reckon "jpark" is another pseudonym for "JohnP" who similarly turned up out of nowhere on "2009-2nd-hottest-year-on-record-sun-coolest-in-a-century" thread. I thought he was just a bot, but if it is the same one here he is actually working away at distraction.
    0 0
    Response: Based on their IP address, unlikely - one user is from the UK, the other is from the USA. That is, unless they're using IP mapping, which is unlikely (I have experienced users trying to disguise their IP before but only after I disabled their accounts on multiple occasions).
  13. #60 (dhogaza), yes I found that confusing too, not least because we're not really talking about models in this case-we're talking about directly observed changes in average temperatures.
    0 0
  14. I had a great conspiracy theory going there John, and you've ruined it. Perhaps they have exchanged emails ...?
    0 0
    Response: Sorry to rain on your tinfoil hat parade :-)
  15. kforestcat (Post #17 & 21): The U.S. National Climate Data Center has tried to be clear in explaining the methodology they've used in an effort to optimize the usefulness of the data they are constrained to work with. If you type "NCDC temperature methodology adjustments" into your browser, you'll find plenty of information, including this page: http://www.ncdc.noaa.gov/oa/climate/research/ushcn/ushcn.html#QUAL As noted by other posters, you can find links to scientific studies assessing the precision and accuracy of the data. Although I find your response (#17) rather draconian, as a U.S. taxpayer I concur with you that our Federal employees should be held to highest performance standards. Assuming you are no less demanding on yourself than you would be toward your PhDs, you might want to consider what measures are appropriate under the circumstances. ;-) (Sorry... This is more of a general response to those whose judgment is swift and merciless (and typically wrong) regarding the quality of data that indicate warming, while being substantially more lenient toward data that appear to show the opposite. Even if one is inclined to be skeptical regarding the accuracy of the surface temperature data, bear in mind that glaciers and ice caps have no political agenda.)
    0 0
  16. Marcus (#13 and other posts above): I concur with your distinction between skepticism and denialism. One way of describing it is that skeptics doubt, while denialists have no doubt. Unfortunately, there are many difficulties in applying these terms in practice. One problem is that denialists typically insist that their position is science-based and falsifiable, if only someone would present them with credible evidence. Of course, this is impossible from a practical standpoint. Another problem is that skepticism is a “slippery slope” to denialism, particularly in the current environment where criticism of AGW is dominated by confusing and ultimately fallacious arguments. Even a well-intended skeptic can end up becoming a denialist without realizing it, while still believing their position(s) to be rational, unbiased, and based on evidence. Another problem is that deniers resent being called "deniers", which unfortunately heightens the emotionalism of the dialog. Ironically, in many cases deniers even resent being called "skeptics"! This might be a hard to understand, since most scientists regard skepticism as an essential component of scientific method, but I interpret it to be because denialists give zero credibility (meaning "absolute zero") to the theory of anthropogenic climate change. From their perspective, they are the possessors of the only scientific truth. Therefore, it should be someone else’s job to play the role of “skeptic” if they wish. In their view, they are not “skeptics” at all, but simply realists. The distinction between skepticism and denialism is important with respect to the current discussion of the surface temperature data. Denial that warming is occurring had faded from popularity, but like so many other "vampire arguments" in this debate, it refuses to die and has enjoyed a recent resurgence. Moreover, it eventually invokes the denialists' fallback position when all else fails: conspiracy theory.
    0 0
  17. HI looks like I have some apologising to do! I think I did say sorry when I went off topic but I was trying to get an answer I understood. I am genuinely interested in the debate and I realise I have a lot to learn. I will keep plugging away and see if I can get it. I guess my instinct would be 'bad data=bad science'.
    0 0
  18. "I guess my instinct would be 'bad data=bad science'." All data is, to some extent, "bad", as there is no such thing as a perfect instrument. The question is whether or not a set of data is *useful* in the context of the task at hand. Making sense of imperfect data is very good science, indeed.
    0 0
  19. My first post. Not sure if this will help, but here is a link to Thursday's NY Times article: http://www.nytimes.com/2010/01/22/science/earth/22warming.html?partner=rss&emc=rss The article, titled,"Past Decade Warmest on Record, NASA Data Shows," concludes that: "The NASA data released Thursday showed an upward temperature trend of about 0.36 degrees Fahrenheit (0.2 degrees Celsius) per decade over the past 30 years. Average global temperatures have risen by about 1.5 degrees Fahrenheit (0.8 degrees Celsius) since 1880."
    0 0
  20. dhogaza..great answer, I like that.
    0 0
  21. And is this helpful too?
    0 0
  22. jpark, not much. It's the same old cry from D'Aleo who says a lot of things but does not prove any, and in the meanwhile makes a whole lot of gross mistakes. One should really need to hear those craps to blindly accept them acritically.
    0 0
  23. jpark if you have time watch this: The Global Warming Debate A Layman’s Guide to the Science and Controversy A layman decided to search evidence from both sides. It has a good history of the scientific discoveries of global warming as well as how the media and skeptics first dealt with it. He details how in his experience he has found similarities with today's skeptics with how they dealt with acid rain and the ozone hole and misrepresent information. He includes all references to the papers and evidence he found. PS to John. The link you have under "resources" for the HTML version of this no longer (works...http://cce.890m.com/) Which is a pity as it was a really good site.
    0 0
  24. Jpark: Among other things D'Aleo doesn't know the difference between temp anomalies and absolute temperatures. He also doesn't know who is responsible for choosing the stations in the CLIMAT data set (hint: it's not the researchers who use the data to create GISTEMP, HadCRUT, etc). That's enough to skewer D'Aleo, not worth wasting any more time on him. As far as his "computer expert" EM Smith goes, he converts all the temperature data to INTEGERS before doing any analysis. Think about that. It's beyond bone-headed.
    0 0
  25. Kforestcat: "..and then divide the current temp with the mean to get the anomaly." Maybe when you unjustifiably fire your next PhD you could ask them to explain the difference between subtraction and division before they leave.
    0 0
  26. Re: jpark at 09:06 AM on 24 January, 2010 "I read this "Why Hasn't Earth Warmed as Much as Expected? New Report on Climate Change Explores the Reasons" from Science Daily. I think you can understand my layman's puzzlement. http://www.sciencedaily.com/releases/2010/01/100119112050.htm " ------------------------------------------------------- Have a read of Ari Jokimäki's comments on Schwartz et al, over at AGW Observer: http://agwobserver.wordpress.com/2010/01/24/comments-on-schwartz-et-al-2010/
    0 0
  27. jpark, Compare what D'Aleo and Smith assert to what NOAA actually says about their Global Surface Network: http://gosic.org/gcos/GCOS-dev.htm
    0 0
  28. yocta, the author (cce) of that site is working on putting it up on a different server, he told me a week or two ago. Thanks for finding that archived version of his slide presentation--I didn't know it existed. You could send cce an encouraging e-mail (his address is at the site you pointed to).
    0 0
  29. Some of the comments seem to reflect a fundamental confusion between precision and accuracy. Precision is the reproducibility of measurement, whereas accuracy is how well the value corresponds to the real value. The use of temperature anomalies recognizes that it is possible for a measurement to be precise but not accurate. For example, a temperature station that is located close to an air conditioner will, on the average, read warmer than one that is located far from the air conditioner. Fortunately, to evaluate climate change, you don't need accurate measurement of absolute temperature, you only need to determine how the temperature has changed over time, by subtracting the average temperature to compute the temperature anomaly, any average bias is subtracted, allowing precise determination of how temperature change over time. So are Watts's photos of temperature stations next to air conditioners irrelevant? Well, not necessarily. Suppose the temperature station is at some point moved closer to the air conditioner. Then there might be an increase in the temperature anomaly that does not reflect an increase in the average temperature at that site. Now, it seems pretty improbably that this would happen frequently enough to affect the trend appreciably, but somebody who desperately wants to disbelieve in global warming will clutch at any straw. So how do you test whether poor siting of temperature measurement stations really is associated with a greater warming trend, which could possibly be due to increased exposure to environmental factors that increase the measured temperature? You compare the trend in the temperature anomalies of the well-sited stations to that of the poorly sited stations. And what is the result? The poorly sited stations slightly underestimate the warming trend, rather than overestimating it. This pretty conclusively disposes of the bad siting hypothesis for the warming trend. I'd have to agree that it is a bit suspicious that Watt and colleagues have not reached, and reported, this conclusion themselves. It is hard not to suspect that they got the same results and chose not to report it because it didn't fit their hypothesis. To be charitable, sometimes when people get results that are inconsistent with a pet hypothesis, they are emotionally incapable of accepting that fact, and fall into perseveration, collecting more and more data in the hopes that if they get enough data the numbers will turn around--a bit like a compulsive gambler riding a losing streak deeper and deeper into debt in the conviction that sooner or later his luck will turn.
    0 0
  30. Thanks for this post. At Deltoid I posted a few links to Watts commenting on requests for analysis of the good stations, including his advice that he'd do it when 75% of the USHCN stations were surveyed. http://scienceblogs.com/deltoid/2010/01/so_thats_why_surfacestationsor.php#comment-2226935 I was very intrigued to see what happened at WUWT after reading Menne et al, and not overly surprised that there has been nothing thus far - even though the denizens there make sure that anything interesting to them hits WUWT within a few hours of being put online. I hope there will be a post on Menne et al. It will provide a fine opportunity to pin Watts down on the analysis question. Hopefully some bright sparks will post something polite and on the money, that he will look dishonest if he wriggles.
    0 0
  31. November 2008
    Some folks have commented that becuase I’ve posted my “How not to measure temperature…” series, that I’m only focused on finding the badly sited stations. While they are a dime a dozen and often visually entertaining, actually what we want to find are the BEST stations. Those are the CRN1 and 2 rated stations. Having a large and well distributed sample size of the best stations will help definitively answer the question about how much bias may exist as a result of the contribution of badly sited stations. Since the majorty of sttaions surveyed so far seem to be CRN 3,4,5 with CRN1,2 making up only 12% of the total surveyed stations thus far, it is important to increase the sample size.
    http://wattsupwiththat.com/2008/11/24/a-note-to-wuwt-readers/
    0 0
  32. JPark, re #71 (really, are you just here to randomly throw out red herrings?) The article by Richard Foot in the very, err, "reputable" (not) Vancouver Sun is consistent wityh other misinformation that they have published on AGW. This is the same Foot who was fawning over the "maligned" McIntyre a while ago. Foot also makes extensive reference to D'Aleo et al. Also, Foot does not even know how to cite James Hansen (not Hanson as Foot claims)! Wonder which denialists website he got his ideas from? Also, the Canadian Arctic is warming rapidly (as per Environment Cnada data; 1.7 C per 62 years [years with data to date] for Arctic Tundra and 1.3 C for the Arctic Mountains and Fiords), so by excluding those Arctic data GISS are actually underestimating the warming, not overestimating it. There are many reaosns for excluding certain data, reasons that Richard Foot, you and D'Aleo et al. seems to not be able to grasp. Jpark, let us for a second assume that the instrument-based SAT record is rubbish (it is not, as has been demonstrated over and over again, but whatever). Now, go and look in the long-term trends in oceanic heat content (no UHI there), trends in global radiosonde network (RATPAC) and trends in global satellite MSU data (RSS, UAH take your pick)-- no UHI or microclimate problems there either. Now look at the long-term trends (30-yrs) and compare them with those of the instrumented global SATs. Then please get back to us with the trend data from all four datasets (RSS, UAH, GISS, RATPAC).
    0 0
  33. Marcus at 22:02 PM on 24 January, 2010 Marcus, do you see that because the 1960's, 70's and 80's temperatures are included in the "average" temperature by which your anomaly are calculated, comparing those anomalies to the 1990's and 2000's temperature anomalies is mathematically a little misleading? The change in temperature for the 80s has already been taken into account in establishing the baseline, so it is artificially low when compared to the 90s and 00s. This is the kind of thing that makes me skeptical. Those facts as presented are misleading, whether it’s intentional or not. I won't argue that it’s not getting warmer. I think it is. But how much warmer and why are big question marks for me.
    0 0
    Response: "I won't argue that it’s not getting warmer.  I think it is.  But how much warmer and why are big question marks for me."

    Note that the choice of the baseline period (eg - 1960 to 1990) has no bearing whatsoever on the temperature trend. As you say, the trend or "how much warmer" it's getting is what we're interested in when we look at temperature anomaly. And of course, you're correct that one of the most important questions is why it's getting warmer.
  34. I'm not a climate scientist, and I don't really care to recreate the work done by Menne. But what is the effect of all of the things he does to the temp. data before he creates his anomaly chart? From Menne 2010, at page 5... "Specifically, the unadjusted and adjusted monthly station values were converted to anomalies relative to the 1971–2000 station mean. The anomalies were then interpolated to the nodes of a 0.25° × 0.25° latitude– longitude grid using the method described by Willmott et al. [1985] -- separately for the good and poor exposure stations. Finally, the interpolated maximum and minimum temperature anomalies were grid-box area weighted into a mean anomaly for the CONUS for each year as shown in Fig. 2." What is the effect on the data when it is "interpolated to the nodes of a 0.25° × 0.25° latitude–longitude grid?" Further, the "interpolated maximum and minimum temperature anomalies were grid-box area weighted into a mean anomaly." What do these mean, and what happens to the data once you do it? I'm a layman, but I think this is a lot of geospatial averaging of the monthly anomalies and the mean anomaly which goes on prior to actually making our comparisons of temperature anomalies, right? Why was this done? What is the effect of doing it? Would the results be different if you didn't? Just skeptically thinking out loud here. ..
    0 0
  35. I guess we are all waiting for a riposte..til then http://pielkeclimatesci.wordpress.com/2010/01/15/professional-discourtesy-by-the-national-climate-data-center/
    0 0
  36. Menne 2010 says "The geographic distribution of stations that fall into the two categories is shown in Fig. 1 (note that just over 40% of the 1218 total USHCN Version 2 sites had available ratings)." A quick glance at surfacestations.org shows that they have ratings for 78% of the total 1221 USHCN stations. Why does Menne 2010 not use those other 38%? They are leaving almost half of the station data that has been collected unaccounted for in their study. And why 1218 vs 1221 total stations? Also, according to surfacestations.org, 61% of the stations have a temperature error of > or = to 2 degrees C, and 8% have a temp. error of > or = to 5 degrees C. Doesn't that put a pretty wide error band on the anomaly results, too? Can you draw meaningful conclusions from data when 69% of your stations have a minimun error of 2 degrees C? I guess if you just take averages for the anomalies, you could consider the error to be washed away for purposes of the results, but I'm not sure that's "scientifically" accurate. Is that why there are no error bands on anomaly results? I realize I'm asking a lot of questions, but I'm interested, and have an open mind. ;-)
    0 0
  37. I think I have found something of an answer - something I can understand at any rate.. http://pielkeclimatesci.wordpress.com/2009/07/03/roger-a-pielke-sr-comments-on-the-ncdc-talking-point-response-to-the-report-“is-the-us-surface-temperature-record-reliable”by-anthony-watts/
    0 0
    Response:

    Note that the blog post you link to, dated from July last year, is not responding to Menne 2010 but a report posted on the NCDC website.

  38. sbarron - I agree, looking at some of the temp charts the anomalies are so huge I cant believe they can be statistically significant. But I may be missing something. I hope I have an open mind too. But this is the skeptical skeptics site..
    0 0
  39. sbarron2000, mathematically (and i'd say logically) the choice of the baseline is totally irrelevant. It's hard for me to understand your surprise that there is "a lot of geospatial averaging". Isn't a global "geospatial average" exactly what we are looking for? It is described in details because, you know, it's a scientific paper and it's customary to describe the data processing. But, to reassure your "uninformed skepticism", other groups use different processing and the differences in the final results are minor. Beyond this, Menne et al. are comparing two different datasets and the most important thing is that they use the same method for both.
    0 0
  40. jpark, it's typical that people understand only what they want to understand. I hope that your understanding of that blog post allows you to understand the its bias (Pielke only quoted himself) and some of the more evident mistakes he made. If not, i should go back to my first sentence and think that you would not understand any rebuttal of his post.
    0 0
  41. Jpark, Sigh, any luck with those other global temp data yet? No? Thought so. The global SAT data are robust, deal with it. I, for one, am becoming quite tired of people using the "I am open minded" or that "I am here to learn" charade, all while simultaneously trying to obfuscate and derail the discussion. The content of your posts reveals your true intentions, and it is clearly not to understand the science. Riccardo @90 hit the nail on the head. The planet has been in a net energy imbalance since the fifties and consequently the atmosphere and oceans are warming, even at a time when solar forcing is decreasing and negative forcing from antrho aerosols is on the rise. The main culprits for the observed warming psot 1950 are GHGs. This is still very early days in this experiment, yet we can already see some disturbing signs (loss of Arctic ice, loss of ice on WAIS and greenland, and even the EAIS, worlwide retreat if glaciers, more flooding events, more heat waves in certain regions like Australia etc.). Also consider that we will easily surpass doubling of CO2 levels, in part, because of the actions of people like Pielke Jnr&Snr, D'Aleo, McIntyre, Watts and their cohorts-- their goal is to confuse and delay, sadly you and others are falling for their deception. The "arguments" of these self-proclaimed 'skeptics', when held to close scientific scrutiny are shown to be nothing more than beguiling. Finally, your "skeptisism" seems to be unidirectional-- which ivalidates claims of being a true "skeptic". So how about subjecting Watts et al. to your scrutiny?
    0 0
  42. Re Riccardo @89 "But, to reassure your "uninformed skepticism", other groups use different processing and the differences in the final results are minor." Correct. The results obtained by the NCDC, JMA, GISS and CRU are all in very good agreement despite treating the analysis and processing of the SAT data quite differently. Then again, they are all colluding don't you know-- as are those scientists overseeing the MSU data, radiosonde data, OHC data and sea ice data and....(please read with sarc). If only I had a dollar for every case of Dunning-Kruger and AGW I come across on the web...
    0 0
  43. Eureka! Thank you Albatross, your comment made me find the real reason why scientists are colluding so badly: it's not for money, it's not for power, it's just because they can do almost no work, they just confirm other's results. It's a shame, you lazy scientists ... N.B. Before being quoted out of context, IT'S JUST A JOKE! ;)
    0 0
  44. Unfortunatley having read this paper I am forced to come to the dissapointing solution that if this is the best we can do then we are in trouble. Our cause is crumbling people
    0 0
  45. On your updates. You say UHI is real, but don't say the same for microsite influences. And I guess the paper is refuting microsite influences. So placing thermostats over concrete has no affect? There is no need to rank stations because whatever you do to them seems to have no nett affect? The history of ranking stations by quality of station was all a waste of time? This one paper upsets what have been considered important practises for weather stations? On your second updates Watts has produced the following http://noconsensus.files.wordpress.com/2010/01/surface_temp1.pdf Obviously prepared before the Mennes 2010 paper and based on the surfacestation.org project so I guess we now have both sides of the argument. But much of this argument is about the quality of the data set as a whole rather than individual stations.
    0 0
  46. You want to know what's really hilarious, Albatross? One of the primary sources of satellite temperature data is the University of Alabama, Huntsville-home of the well-known Skeptic Dr Roy Spencer. Now, if there was some collusion going on, you'd expect Spencer's data to be way out of step with GISS, RSS & other sources of temperature data (maybe showing a cooling trend over the last 30 years). Yet in fact there is virtually no discrepancy at all-so much for the conspiracy theories of the Denialist Cult. As for scientists trying to get rich. Yeah right, I've been working as a micro/molecular biologist for almost a decade, & will probably have to work until I'm in my 70's if I want to have a comfortable retirement. I doubt your average climatologist gets paid much more than me. So the idea that scientists are somehow "getting rich" off global warming fears is errant nonsense. Now skeptics like Lindzen, who charge the fossil fuel industry $2,500 a day for consulting services, are probably getting rich quick-but by fostering skepticism!
    0 0
  47. Science is a wonderful thing if one does not have to earn one's living at it.<-i> -Albert Einstein
    0 0
  48. HumanityRules at 16:19 PM on 27 January, 2010 You still don't get it, do you? A thermometer could be placed in a frying pan and yet as long as it has dynamic range available it'll still be able to register a trend in temperature and that trend will be separable from the frying pan component. But I forgot: it's vital that you not understand this because Watts' hypothesis is a straw you've been grasping at for years. Watts' idea is dead. It was not even strictly necessary for Mennes to publish this paper, Watts' hypothesis can be falsified easily either by thought or experiment, without visiting a single sorry parking lot.
    0 0
  49. Marcus, Re #96. Oh I hear you. I'm an atmospheric scientist involved in R&D and land-atmosphere feedbacks-- I'm going to have to work until as long as they will keep me on. So much for a Phd in the sciences helping make me stinking rich. Yes, we scientists are rolling in money, and can't get enough so we have to fabricate lies and deception to put the fear of you know who in everyone so we can somehow get paid more money (sarc)? The mind boggles. It is a wonder anyone wants to be a climate scientist or work in a climate related field nowadays-- maybe that is their intention. The perks are not great-- death threats, libel and defamatory comments, harassment, nonstop attacks on your work from the peanut gallery, having your email and/or computers hacked, FOIAs up the yazoo, every denier or self-proclaimed "true skeptic or realist" claiming to have discovered the "truth"...on Google. What blows my mind is Watts et el. using pseudo science, deception and even lies to "refute" science conducted by NASA and NOAA and other reputable groups. Wonder if JPark has tracked down those long-term global temp. trends yet? Anyhow, so much rhetoric, so little substance from the contrarian camp. Seems to be the norm nowadays and, alas, Watts et al. and Fox news have the recipe down pat. I thought Lindzen claims that he has stopped that nasty habit (taking FF money) a while ago? Humanity Riules, re #95. Are you going for the record to see how many strawman arguments you can invoke in one post? I was woprried this would happen, you see Mennes et al's paper makes sense to those in the know, and most reasonable and well-adjusted people would accept their findings. Now Watts and his friend Pielke Snr. just cannot graciously accept defeat, "never capitulate men, never". So now he starts with more obfuscation and red herrings, all of which his (mostly ignorant) followers gobble up and then gleefully disseminate over the web without so much as a second thought or critique, thus spreading more misinformation and confusion. The internet is certainly a great tool for the denialists Humanity and you are helping their machine of misinformation. Congrats, Anthony will be proud. Humanity, the planet is warming b/c of it is in a positive energy imbalance and it has nothing to do with "fudged data" or the UHI or microclimate issues. Please explain to us why the RSS, RATPAC, GISS, CRU, NCDC all have very similar warming trends over the last 30 years...Also explain why, in the long term, the oceans are accumulating heat (no UHI going on there). Also, just why are those dratted ice sheets and glaciers in the middle of well, nowhere, losing ice at ever increasing rates? Now those are the important issues here, not the ramblings and rantings of Watts et al. on a BLOG. You honestly think that you know something that the scientists who have spent most of their careers working on this issue have miraculously missed or ignored? Err, NO. Watts does not understand the concept of an anomaly properly, yet you are determined to take his ramblings at face value while damning the work of the scientists? Uh huh. Oh well, I'm mostly OT here, so I'd better stop now before webmaster snips me (and I'm OK with that John).
    0 0
  50. doug_bostrom at 17:07 PM on 27 January, 2010 "A thermometer could be placed in a frying pan and yet as long as it has dynamic range available it'll still be able to register a trend in temperature and that trend will be separable from the frying pan component." I agree with this. However, is that the situation we have here with these poorly sited stations? I'm sure they all must have some dynamic range, but is that range consistant from one station to the next? Does it need to be? What if its not? Does that fact that the "bad" stations have an error range of >1 degreee C, >2 degree C, and >5 degree C play a role when measuring trends? Should these bad stations be lumped together when doing this analysis? Do you get different trend results when you separate out the different bad station catagories? Menne 2010 only tells us what it does, within the parameters it sets out. They do a lot of things that may or may not be the best way to answer these questions. Acting like rgis paper has settled the issue is putting the wagon before the horse. No one has even had a chance to respond yet. Heck, it took years for the hockey stick chart to get corrected. If you're open minded, should you be so quick to dismiss skeptical discussions of this paper? I don't see how.
    0 0

Prev  1  2  3  4  5  Next

You need to be logged in to post a comment. Login via the left margin or if you're new, register here.


The Consensus Project Website

THE ESCALATOR

(free to republish)


© Copyright 2024 John Cook
Home | Translations | About Us | Privacy | Contact Us