Climate Science Glossary

Term Lookup

Enter a term in the search box to find its definition.

Settings

Use the controls in the far right panel to increase or decrease the number of terms automatically displayed (or to completely turn that feature off).

Term Lookup

Settings


All IPCC definitions taken from Climate Change 2007: The Physical Science Basis. Working Group I Contribution to the Fourth Assessment Report of the Intergovernmental Panel on Climate Change, Annex I, Glossary, pp. 941-954. Cambridge University Press.

Home Arguments Software Resources Comments The Consensus Project Translations About Support

Bluesky Facebook LinkedIn Mastodon MeWe

Twitter YouTube RSS Posts RSS Comments Email Subscribe


Climate's changed before
It's the sun
It's not bad
There is no consensus
It's cooling
Models are unreliable
Temp record is unreliable
Animals and plants can adapt
It hasn't warmed since 1998
Antarctica is gaining ice
View All Arguments...


Username
Password
New? Register here
Forgot your password?

Latest Posts

Archives

On the reliability of the U.S. Surface Temperature Record

Posted on 22 January 2010 by John Cook

The website surfacestations.org enlisted an army of volunteers, travelling across the U.S. photographing weather stations. The point of this effort was to document cases of microsite influence - weather stations located near car parks, air conditioners and airport tarmacs and anything else that might impose a warming bias. While photos can be compelling, the only way to quantify any microsite influence is through analysis of the data. This has been done in On the reliability of the U.S. Surface Temperature Record (Menne 2010), published in the Journal of Geophysical Research. The trends from poorly sited weather stations are compared to well-sited stations. The results indicate that yes, there is a bias associated with poor exposure sites. However, the bias is not what you expect.

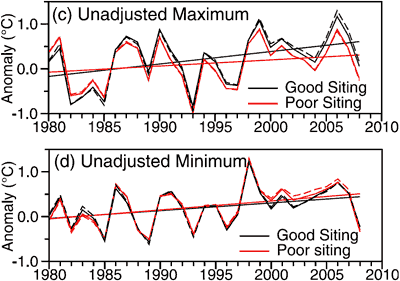
Weather stations are split into two categories: good (rating 1 or 2) and bad (ratings 3, 4 or 5). Each day, the minimum and maximum temperature are recorded. All temperature data goes through a process of homogenisation, removing non-climatic influences such as relocation of the weather station or change in the Time of Observation. In this analysis, both the raw, unadjusted data and homogenised, adjusted data are compared. Figure 1 shows the comparison of unadjusted temperature from the good and bad sites. The top figure (c) is the maximum temperature, the bottom figure (d) is the minimum temperature. The black line represents well sited weather stations with the red line representing poorly sited stations.
Maximum and Minimum Temperature Anomaly for good and bad sites
Figure 1. Annual average maximum and minimum unadjusted temperature change calculated using (c) maximum and (d) minimum temperatures from good and poor exposure sites (Menne 2010).

Poor sites show a cooler maximum temperature compared to good sites. For minimum temperature, the poor sites are slightly warmer. The net effect is a cool bias in poorly sited stations. Considering all the air-conditioners, BBQs, car parks and tarmacs, this result is somewhat a surprise. Why are poor sites showing a cooler trend than good sites?

The cool bias occurs primarily during the mid and late 1980s. Over this period, about 60% of USHCN sites converted from Cotton Region Shelters (CRS otherwise known as Stevenson Screens) to electronic Maximum/Minimum Temperature Systems (MMTS). MMTS sensors are attached by cable to an indoor readout device. Consequently, limited by cable length, they're often located closer to heated buildings, paved surfaces and other artificial sources of heat.

Investigations into the impact of the MMTS on temperature data have found that on average, MMTS sensors record lower daily maximums than their CRS counterparts, and, conversely, slightly higher daily minimums (Menne 2009). Only about 30% of the good sites currently have the newer MMTS-type sensors compared to about 75% of the poor exposure locations. Thus it's MMTS sensors that are responsible for the cool bias imposed on poor sites.

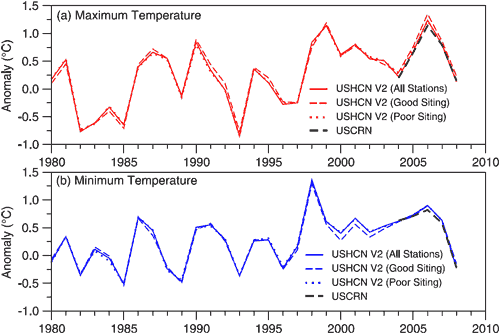
When the change from CRS to MMTS are taken into account, as well as other biases such as station relocation and Time of Observation, the trend from good sites show close agreement with poor sites.
Maximum and Minimum Temperature Anomaly for good and bad sites
Figure 2: Comparison of U.S. average annual (a) maximum and (b) minimum temperatures calculated using USHCN version 2 adjusted temperatures. Good and poor site ratings are based on surfacestations.org.

Does this latest analysis mean all the work at surfacestations.org has been a waste of time? On the contrary, the laborious task of rating each individual weather station enabled Menne 2010 to identify a cool bias in poor sites and isolate the cause. The role of surfacestations.org is recognised in the paper's acknowledgements in which they "wish to thank Anthony Watts and the many volunteers at surfacestations.org for their considerable efforts in documenting the current site characteristics of USHCN stations." A net cooling bias was perhaps not the result the surfacestations.org volunteers were hoping for but improving the quality of the surface temperature record is surely a result we should all appreciate.

UPDATE 24/1/2010: There seems to be some confusion in the comments mistaking Urban Heat Island and microsite influences which are two separate phenomenon. Urban Heat Island is the phenomenon where a metropolitan area in general is warmer than surrounding rural areas. This is a real phenomenon (see here for a discussion of how UHI affects warming trends). Microsite influences refer to the configuration of a specific weather station - whether there are any surrounding features that might impose a non-climatic bias.

UPDATE 24/1/2010: There has been no direct response from Anthony Watts re Menne 2010. However, there was one post yesterday featuring a photo of a weather station positioned near an air-conditioner along with the data series from that particular station showing a jump in temperature. The conclusion: "Who says pictures don’t matter?"

So the sequence of events is this. Surfacestations.org publishes photos and anecdotal evidence that microsite influences inflate the warming trend but no data analysis to determine whether there's any actual effect on the overall temperature record. Menne 2010 performs data analysis to determine whether there is a warming bias in poorly position weather stations and finds overall, there is actually a cooling bias. Watts responds with another photo and single piece of anecdotal evidence.

UPDATE 28/1/2010: Anthony Watts has posted a more direct response to Menne 2010 although he admits it's not complete, presumably keeping his powder dry for a more comprehensive peer reviewed response which we all eagerly anticipate. What does this response contain?

More photos, for starters. You can never have enough photos of dodgy weather stations. He then rehashes an old critique of a previous NOAA analysis criticising the use of homogenisation of data. This is curious considering Menne 2010 makes a point of using unadjusted, raw data and in fact, it is this data that reveals the cooling bias. I'm guessing he was so enamoured with the water pollution graphics, he couldn't resist reusing them (the man does recognise the persuasive power of a strong graphic).

0 0

Printable Version  |  Link to this page

Comments

Prev  1  2  3  4  5  

Comments 201 to 214 out of 214:

  1. jpark, please notice that some comments by people responding to you also have been deleted, for similar reasons. John Cook is trying to keep the tone of his site well above the level of most other sites. Otherwise the slope would be too slippery, and an ongoing discussion that was "allowed" to be "slightly" in violation would "suddenly" and "arbitrarily" have some comments removed, with the resulting appearance of bias by the moderator. ("Why did you delete my comment and not so-and-so's?") One of the things that is prohibited is attribution of ill motives to people--not just to people posting comments, but to scientists who've written journal articles, and anybody else. I've certainly had my own comments deleted--even when they were funny. Even a single violation in an otherwise excellent comment will get the entire comment deleted. That's too bad, but I imagine John does not have time (let alone the patience) to edit out just the offending portion. If you keep a copy of your comment before submitting it, you can later resubmit it without the offending part.
    0 0
  2. Read this: "But at face value, this plot seems to indicate that the rapid decrease in the number of stations included in the GHCN database in recent years has not caused a spurious warming trend in the Jones dataset — at least not since 1986." It's not on siting issue or UHI, but some people have problems with the decreasing number of stations in the last decades. And the quote does not come from someone from CRU, GISS or other "consensus scientist", it comes from Roy Spencer. I hope that this will slow down a bit some chattering.
    0 0
  3. Excellent write up. I accept the argument as presented and it has changed my opinion on the subject. I now agree with the premis that Heat Islands are not responsable for recording increased temperatures. What about the criticizim that their has been a reduction in temperature stations over time, and that the ones being excluded are sites that have been historically recording "cooler" temperatures than the average. It seams it would be easy to prove or disprove that one.
    0 0
  4. TruthSeeker, much easier indeed. Stations at high latitude have shown on average a lareger increase in temperature. The effect of removing those stations would be a reduced anomaly. Remember, anomaly is not absolute temperature. Also read my comment just before your if you prefer the opinion and the "massaging" of the data of an old time skeptic.
    0 0
  5. The professional statistician Tamino has proven two skeptic claims to be false: "1st, that the dramatic reduction in the number of reporting stations around 1990 introduced a false warming trend; 2nd, that the adjustments applied to station data also introduce a false warming trend." Tamino made those proofs by...analyzing the actual data! What a concept! The skeptics have had access to the same data, but have not bothered to do the analyses, only to make the claims.
    0 0
  6. Tom, agreed. Following on from there here are fascinating posts and discussion. http://rankexploits.com/musings/2010/bump-new-thread-for-station-drop-out-analyses/ http://rankexploits.com/musings/2010/a-simple-model-for-spatially-weighted-temp-analysis/
    0 0
  7. Love that (US) data! Not an answer to Tamino but in the same ball park
    0 0
  8. For a while Watts et al. were saying the problem was the decline in numbers of rural stations, or high-latitude stations. When it became clear that neither of these affects the temperature trend, I began noticing more and more contrarians saying that it's all because of airports. Now, Clear Climate Code has done a nice analysis showing no real difference in trend between airport and non-airport sites -- or, insofar as there is a difference, airport sites have had less warming than non-airports. So, once again, Watts etc have been quick to jump to conclusions with no evidence, and then were proved wrong when somebody actually bothered to sit down and do a quantitative analysis. It's, like, deja vu all over again!
    0 0
  9. As of five days ago, Watts himself said during an interview on the Australian ABC's Counterpoint program "we are very close to finishing [the surface stations paper], literally within days". I guess that means he will have submitted about now... Or will he change his mind and hold off until he has sampled 150% of the stations?
    0 0
  10. In cold climates those reverse-cyle ACs actually blow out cold air, so maybe that's why the poor-sited readings are often lower?
    0 0
  11. It has been over a year now since Menne's paper came out. Any news yet from Watts?
    0 0
  12. Actually, Watts did recently have a somewhat bizarre post where he analyzed data from Australian weather stations. He divided them into "rural" and "not rural", and then showed that they had different temperature trends over the last 100 years. What was interesting was his classification of stations. The Ceduna station was classified as "not rural". Here is a pic of the weather station It looks even better in Google Maps According to a post there: "The issue is not whether a site is “rural” or “urban”. The issue is whether the land use in the nearby area has changed over the last 100 years. A site out of town, but by the international airport, is not “rural” for climate purposes. No matter how few people live nearby. The UHI effects are what matter, not the population. Do try to keep up with the actual issues. The pretence that because a site not inside a town means it is “rural” is a key feature in the inflated land temperature values we get from GISS etc." Another commenter said: "Oodnadatta is clasified as non-rural, it has a scattered population of 280, it is in the middle of the Simpson desert, has Finke, an Aboriginal township 130 miles (8 hours) to the north, Coober Pedy, a mining town 130 miles (5 hours) to the southwest, Birdsville 450 miles (2 days if you are lucky) to the east and Kalbarri 1100 miles (5 days) to the west. If that isn’t rural I don’t know what is." Which met with: "Mike Jonas says: February 22, 2011 at 10:42 am old44 : It might seem odd that a little remote place like Oodnadatta is classified non-rural, but Station 17043 is Oodnadatta AIRPORT. The weather station there appears to be right alongside where the planes taxi in and out (see the Google Maps link). The test isn’t whether the place is a major urban centre, but whether the temperature record there is likely to be contaminated by development." Of course if WUWT is correct, we'll be seeing a steadily increasing discrepancy between satellite and land based temperature records. However this does not appear to have been happening in Australia.
    0 0
  13. Hmm. Google maps link didn't work. Another try:
    View Larger Map
    0 0
  14. Am I right in thinking these people don't know the difference between an airport and a landing strip? I think I've just discovered that Orroroo "airport" would have a major impact on the climate record for the southern Flinders Ranges. Presumably Wilpena Pound Airstrip with all the tourist joyrides would have an even more direct effect. (I doubt Orroroo averages too many landings per month.) Must write to the BOM, they need to keep up to date. Glad to keep learning new things every day.
    0 0

Prev  1  2  3  4  5  

You need to be logged in to post a comment. Login via the left margin or if you're new, register here.


The Consensus Project Website

THE ESCALATOR

(free to republish)


© Copyright 2024 John Cook
Home | Translations | About Us | Privacy | Contact Us