Climate Science Glossary

Term Lookup

Enter a term in the search box to find its definition.

Settings

Use the controls in the far right panel to increase or decrease the number of terms automatically displayed (or to completely turn that feature off).

Term Lookup

Settings


All IPCC definitions taken from Climate Change 2007: The Physical Science Basis. Working Group I Contribution to the Fourth Assessment Report of the Intergovernmental Panel on Climate Change, Annex I, Glossary, pp. 941-954. Cambridge University Press.

Home Arguments Software Resources Comments The Consensus Project Translations About Support

Bluesky Facebook LinkedIn Mastodon MeWe

Twitter YouTube RSS Posts RSS Comments Email Subscribe


Climate's changed before
It's the sun
It's not bad
There is no consensus
It's cooling
Models are unreliable
Temp record is unreliable
Animals and plants can adapt
It hasn't warmed since 1998
Antarctica is gaining ice
View All Arguments...


Username
Password
New? Register here
Forgot your password?

Latest Posts

Archives

NASA Mission Takes Stock of Earth's Melting Land Ice

Posted on 10 February 2012 by John Hartz

This article is a reprint of a news release posted by the US Jet Propulsion Laboratory on  Feb 8, 2012

In the first comprehensive satellite study of its kind, a University of Colorado at Boulder-led team used NASA data to calculate how much Earth's melting land ice is adding to global sea level rise.

Using satellite measurements from the NASA/German Aerospace Center Gravity Recovery and Climate Experiment (GRACE), the researchers measured ice loss in all of Earth's land ice between 2003 and 2010, with particular emphasis on glaciers and ice caps outside of Greenland and Antarctica.

The total global ice mass lost from Greenland, Antarctica and Earth's glaciers and ice caps during the study period was about 4.3 trillion tons (1,000 cubic miles), adding about 0.5 inches (12 millimeters) to global sea level. That's enough ice to cover the United States 1.5 feet (0.5 meters) deep.

"Earth is losing a huge amount of ice to the ocean annually, and these new results will help us answer important questions in terms of both sea rise and how the planet's cold regions are responding to global change," said University of Colorado Boulder physics professor John Wahr, who helped lead the study. "The strength of GRACE is it sees all the mass in the system, even though its resolution is not high enough to allow us to determine separate contributions from each individual glacier."
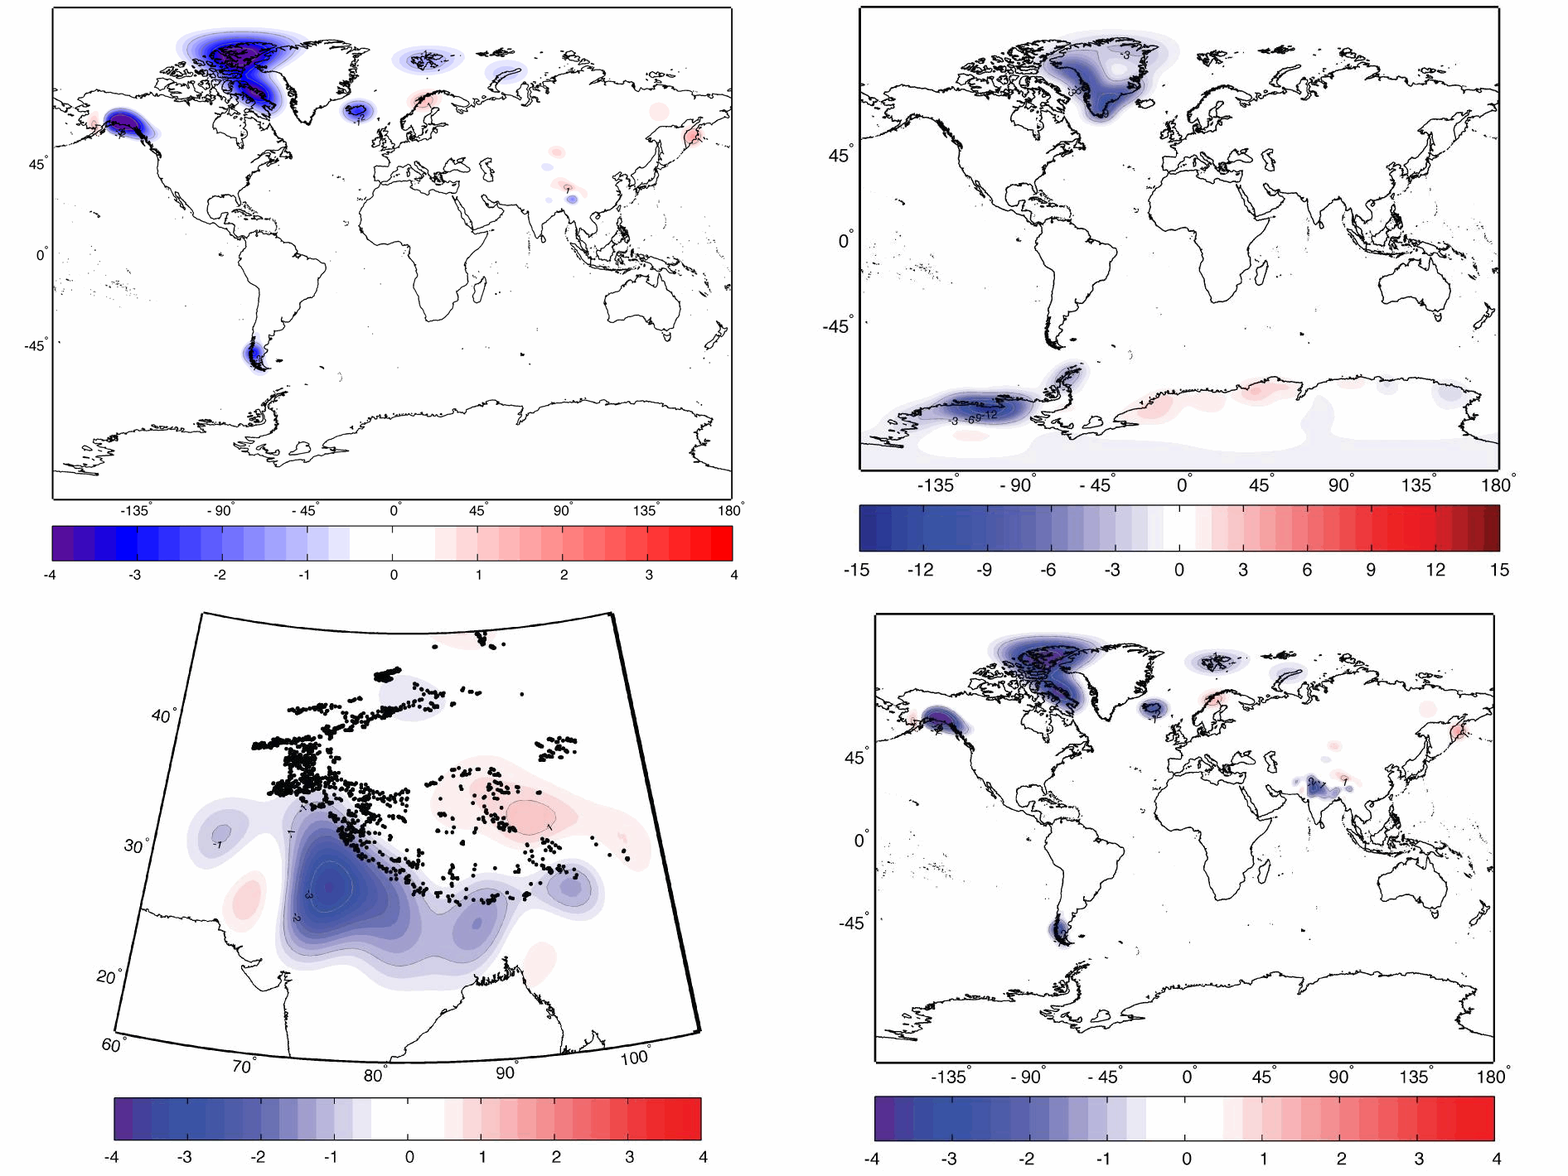
NASA GIF

Average yearly change in mass, in centimeters of water, during 2003-2010, as measured by NASA’s Gravity Recovery and Climate Experiment (GRACE) satellites, for Greenland and Antarctica and their peripheral glaciers and ice caps, all the world’s glaciers and ice caps (excluding Greenland and Antarctica), for the Indian subcontinent, and changes in ice thickness (in centimeters per year) averaged over each of the world's ice caps and glacier systems outside of Greenland and Antarctica. Blue represents ice mass loss, while red represents ice mass gain.

About a quarter of the average annual ice loss came from glaciers and ice caps outside of Greenland and Antarctica (roughly 148 billion tons, or 39 cubic miles). Ice loss from Greenland and Antarctica and their peripheral ice caps and glaciers averaged 385 billion tons (100 cubic miles) a year. Results of the study will be published online Feb. 8 in the journal Nature.

Traditional estimates of Earth's ice caps and glaciers have been made using ground measurements from relatively few glaciers to infer what all the world's unmonitored glaciers were doing. Only a few hundred of the roughly 200,000 glaciers worldwide have been monitored for longer than a decade.

One unexpected study result from GRACE was that the estimated ice loss from high Asian mountain ranges like the Himalaya, the Pamir and the Tien Shan was only about 4 billion tons of ice annually. Some previous ground-based estimates of ice loss in these high Asian mountains have ranged up to 50 billion tons annually.

"The GRACE results in this region really were a surprise," said Wahr, who is also a fellow at the University of Colorado-headquartered Cooperative Institute for Research in Environmental Sciences. "One possible explanation is that previous estimates were based on measurements taken primarily from some of the lower, more accessible glaciers in Asia and extrapolated to infer the behavior of higher glaciers. But unlike the lower glaciers, most of the high glaciers are located in very cold environments and require greater amounts of atmospheric warming before local temperatures rise enough to cause significant melting. This makes it difficult to use low-elevation, ground-based measurements to estimate results from the entire system."

"This study finds that the world's small glaciers and ice caps in places like Alaska, South America and the Himalayas contribute about 0.02 inches per year to sea level rise," said Tom Wagner, cryosphere program scientist at NASA Headquarters in Washington. "While this is lower than previous estimates, it confirms that ice is being lost from around the globe, with just a few areas in precarious balance. The results sharpen our view of land-ice melting, which poses the biggest, most threatening factor in future sea level rise."  

The twin GRACE satellites track changes in Earth's gravity field by noting minute changes in gravitational pull caused by regional variations in Earth's mass, which for periods of months to years is typically because of movements of water on Earth's surface. It does this by measuring changes in the distance between its two identical spacecraft to one-hundredth the width of a human hair.

The GRACE spacecraft, developed by NASA's Jet Propulsion Laboratory, Pasadena, Calif., and launched in 2002, are in the same orbit approximately 137 miles (220 kilometers) apart.  The California Institute of Technology manages JPL for NASA.

For more on GRACE, visit: http://www.csr.utexas.edu/grace and http://grace.jpl.nasa.gov .

For more information about NASA and agency programs, visit: http://www.nasa.gov .

JPL is managed for NASA by the California Institute of Technology in Pasadena.

0 0

Printable Version  |  Link to this page

Comments

1  2  Next

Comments 1 to 50 out of 67:

  1. Is the time period between 2003-2010 6 years? Under the image, it indicates during 2003-2010 which would indicate 8 years. Which set of years is correct?
    0 0
  2. Sadly, and predictably, this was cherrypicked and turned into a bunfight about the Himalayas. Even The Guardian is guilty of this. This doesn't seem to fit well with experience on the ground and The Guardian's own reporting of it! It's clearly incongruous, at least if it's simplistically reported as 'the Himalayas have lost no ice in the last 10 years'; it will be interesting to see how the discussion pans out
    0 0
  3. Bill, one of the SkS authors is putting together a post on this too. Needless to say, the accumulation of snow in the high Asian mountains is likely under conditions, such as the recent La Nina-dominant period, where a much warmer western tropical Pacific intensifies the Asian Monsoon, and dumps more snow on the high plateau. None of which changes the rapid loss of ice at lower elevations, being much warmer, or the rapid global loss of ice already underway.
    0 0
  4. Bill - ".......and The Guardian's own reporting of it! It's clearly incongruous, at least if it's simplistically reported as 'the Himalayas have lost no ice in the last 10 years" Yes, strange how when it involves global warming the all-important context is missing. Imagine what would have happened if, when that asteroid last year was hurtling toward Earth, the media conveniently neglected to mention that it was going narrowly avoid a collision with Earth. They remembered the context then, why not now?
    0 0
  5. bill@2: How would they get 10 years from this article? It appears to be either 6 years or 8 years. Unless Britian has developed a different parameter concerning time, a year is still a year.
    0 0
    Moderator Response: [DB] Bill refers to a separate news article.
  6. I was a little surprised not to see the name 'Fred Pearce' in there, frankly! ;-) What annoys me is that while, yes, this is all you could expect from the Daily Mail or WSJ, now The Guardian - and it really does know better - has done its bit to ensure the public will now remember the result as 'but they said the glaciers weren't melting after all'!
    0 0
  7. Re Camburn: While I was referring to another article, it is notable that The Guardian is reporting for 'the last 10 years' even though they refer to 8 years of results in the body of the text! And now there's even a Live Q&A What does the Himalaya glacier study mean for climate change?
    Asia's highest peaks have not lost ice over the past decade, according to new research. Glaciologist Prof Jonathan Bamber answers your questions.
    Well, here's question one:
    Professor Bamber - as a result of these findings is the scientific community concerned that people might start to believe some of the other things that Jeremy Clarkson says?
    Then there are questions about whether the rest of the cryosphere is actually melting after all, even though the report clearly states that it is, which is why the result in the Himalayas was an anomaly! It's like a text book study on how not to report something! [sigh]
    0 0
  8. Here is a cross post on some ideas on this that I posted on Deltoid. I think that there may be a problem with the Nature paper. Anyone who researches what is going on in that area will have found that the most immediate problem there is the quickly growing glacial lakes which threaten to flood villages down the valley if they burst. Some of these lakes are huge. The Nature paper is based on GRACE data which measures gravity difference over time. If ice is melting but is being damned up in glacial lakes could this be another interpretation of the GRACE data. i.e. the glaciers are melting but the water is not moving to any significant extent but is staying close to where it melted thus making it seem as if the glaciers had not in fact melted. Here is a link to an article about these growing glacial lakes. I'm no expert in this area but it does seem another explanation for the GRACE data. Any one care to comment?
    0 0
  9. Ian@8: A similiar mention should be made about Greenland as more mass is lost per year by fresh water leaving than is by ice calfing. In Greenland's case, no one on the continent is in peril because of this.
    0 0
  10. Ian F: "If ice is melting but is being damned up in glacial lakes could this be another interpretation of the GRACE data." Why would ponding glacial meltwater produce such a large mass difference? From your link: Mountain regions from the Andes to the Himalayas are warming faster than the global average under climate change. Ice turns to water; glaciers are slowly reduced to lakes. Camburn#9: "more mass is lost per year by fresh water leaving than is by ice calfing." Do you have a source for this? Where is the fresh water coming from, if not melting ice? Are you seriously questioning the observations that Greenland ice is melting? It is not just GRACE data that support this.
    0 0
  11. muoncounter@10: The water comes from melted snow/ice on Greenland. When the ice/snow turns to water and runs off, it is gone. I will try and find the paper that I read concerning this. Whether it is glacial calfing or running water isn't important to the mass. Once gone, it is gone. No, I am not questioning that Greenland is loosing mass. I am not even questioning that it is loosing mass at a greater rate per year for the past 20 years. IF you were talking about pure ice calfing, that changes the dynamics of the discussion. Note in my comment that I indicated "mass is lost".
    0 0
  12. muoncounter@10: This doesn't give the percentages, but it does talk about the melting acceleration. Accelerating Greenland Mass Loss 2011 If I run accross the paper that gave values to ice and meltwater, I will post it.
    0 0
  13. The Guardian has a table from the study here. Skip the silly intro by Leo Hickman, and just check out the table: Land-based ice has been lost at the rate of 536 (+/-93) billion tons per year over the period 2003-2010, and added 1.48 (+/-0.26) mm per year to sea level rise.
    0 0
  14. What a horrible graphic! I don't understand what the maps mean, and I don't like the way they change before you can look at them properly. Why can't we have four separate maps with their own descriptions?
    0 0
  15. @8,The study does not deal with ice areas of less than 100km2.
    0 0
  16. Camburn, Your article cites 30 cm sea level rise due to melting of Greenland and Antarctic by 2050, 38 years from today. You say "no one on the continent is in peril because of this." How many million farmers in Bangladesh will be displaced in only 37 years from this sea level rise? Miami will lose close to 20% of their storm water drainage, are they "in peril" due to greater flooding? In addition, your article says that the sea level rise from the ice sheets is greater than expected from the models. Perhaps it will rise more than 30 cm as now expected. If you ignore the data it is easy to say "no one on the continent is in peril because of this." Think of the people who live near the sea.
    0 0
  17. GRACE has demonstrated itself to be quite sensitive to glacier and ice sheet mass change and has been validated in several regions. The recent paper is an ambitious step assessing all of the worlds ice covered areas. GRACE has problems with small glaciers and has not been validated in such areas. The results from the Himalaya do not appear robust, when compared to the very extensive inventories that have documented the changes in extent of thousands of glaciers in the region and have found significant changes in areal extent across all ranges except the Karakoram. The glacier by glacier mapping completed by GLIMS or ICIMOD for example tell a different and better verified story, from Kyrgyzstan to Bhutan and Afghanistan
    0 0
  18. What's with the large area of mass loss south of the Himalaya? Soil moisture loss? Top soil loss?
    0 0
  19. From the paper this is aquifer withdrawal. Scary enough for me.
    0 0
  20. Thanks, Yvan. I agree, if that is a real measure of aquifer drawdown then it is very worrying indeed.
    0 0
  21. From the article "The total global ice mass lost from Greenland, Antarctica and Earth's glaciers and ice caps during the study period was about 4.3 trillion tons (1,000 cubic miles), adding about 0.5 inches (12 millimeters) to global sea level. That's enough ice to cover the United States 1.5 feet (0.5 meters) deep." One problem is that even if the ice melting halted the oceans would continue to rise at about the same rate. The result of irrigation pulling water from aquifiers that had the water locked away and now going into the surface water balance. "Of the total irrigated area worldwide 38% is equipped for irrigation with groundwater, especially in India (39 million ha), China (19 million ha) and the United States of America (17 million ha).[9] Total consumptive groundwater use for irrigation is estimated as 545 km3/year. Groundwater use in irrigation leads in places to exploitation of groundwater at rates above groundwater recharge and depletion of groundwater reservoirs." source of quote. 545 km3/year equals 5.35 x 10^11 tons of water a year. cubic kilometers to tons conversion calculator. In the 7 year period of the Grace study you would have extracted 3.745 trillion tons of water from groundwater sources that are not being recharged by surface water so this basically will add this much water to the surface (at least for many years). So the water added to the system via irrigation is fairly close to the amount of water added by melting ice. Meaning the sea water will continue to rise regardless if the ice melting stops and the problems of the future will still remain.
    0 0
  22. @michael sweet, I may be mistaken, but I believe Camburn was, in this case, referring solely to people living on Greenland. Those occupying coastal areas over the rest of the world are a different, and altogether more serious, concern. Absolutely incredible, and terrifying, the sheer scale of the ice loss per year
    0 0
  23. Norman - Looking at the amount of water used is not very informative without also looking at the amount of water retained, the input to irrigation. From Chao et al 2008 - "By reconstructing the history of water impoundment in the world's artificial reservoirs, we show that a total of ∼10,800 cubic kilometers of water has been impounded on land to date, reducing the magnitude of global sea level (GSL) rise by –30.0 millimeters, at an average rate of –0.55 millimeters per year during the past half century." (emphasis added) Your assertion that there is significant sea level rise from irrigation is, in fact, incorrect.
    0 0
  24. KR @23 I think we are not on the same page. Water impoundment is not the same concept as adding water to the surface water system from groundwater sources. The number you give is for the total amount of water that has been impounded by mankind to date. The number I gave is a yearly extraction of groundwater sources and a lot of that is depleting the ground water supply at a much faster rate than entering it. This means the water is being added to the surface system. Some will be impounded, some will end in the sea. The impounded water is a static amount that will change only if new lakes are made. The irrigation is a every increasing amount. Also irrigation rates are going up so more water is being extracted. Groundwater use for irrigation - a global inventory.
    0 0
  25. Norman - It does matter in terms of sea level rise (SLR). Groundwater depletion is a serious ecological issue, reducing the carrying capacity of many regions. But the total amount of water making it's way to the oceans is what matters in terms of SLR. You have to add up all the sources and sinks of terrestrial water to see what's going on. A more recent (and complete than Chao) reference is Milly et al 2010 - Terrestrial Water-Storage Contributions to Sea-Level Rise and Variability. Considering groundwater depletion, irrigation, impoundment, etc., they state: "When we consider only those processes ... in which we place medium to high confidence, we obtain a zero net trend in sea level. This is consistent with the most likely range of ≈0 to 0.3 mm/year deduced [from external constraints] ... for the past two decades ..." (emphasis added)
    0 0
  26. Norman @21, you make the assumption that extracted groundwater is not being replaced. That is not correct. Although groundwater is not being replaced at the rate at which it is being extracted in many aquifers, surface water is still making its way underground. Therefore simply taking the figure of the consumptive use of ground water as being the net addition to surface waters is inaccurate.
    0 0
  27. Norman#24: "water is being added to the surface system. Some will be impounded, some will end in the sea." And some will end in the atmosphere. Per the USGS, ... of the water used for irrigation, only about one-half is reusable. The rest is lost by evaporation into the air, evapotranspiration from plants, or is lost in transit, by a leaking pipe, for example. Sounds like there is a high level of uncertainty in the fraction of groundwater that reaches the ocean. You neglect, as well, the fact that groundwater depletion is a major factor in land subsidence, exacerbating coastal sea level rise. This is an argument so thin as to be transparent.
    0 0
  28. But muoncounter, what goes up by evaporation comes down as precipitation, and depending on the location, some of that will end up in the ocean.
    0 0
  29. and, Jim, some won't. Some will fall on land. And some of that will run off into streams and eventually reach the sea, and some will soak into the soil, and some will eventually make back into deep aquifers... ...so you can't look at this by pretending that one small portion of the water cycle is everything. Taking the number that represents the removal for irrigation and expecting that it all ends up raising sea level is wrong.
    0 0
  30. Bob, I didn't say anything at all about irrigation or sea level, I just pointed out that the nice neat divisions are not so nice and neat, as you just did as well.
    0 0
  31. Tom Curtis @26 The rate of replacement of underground water storage depends upon location. In wet areas the groundwater removed it easily replaced. In dry areas this is not the case and the drier areas are the ones pumping up most of the the deep ground water (that is not being replaced). In wet areas irrigation is not a highly needed activity. Here is a short article that describes the situation. In Texas a chart in this document Ogallala Aquifier. it shows the rate of pumping out of the large aquifier is 6.22, while the recharge rate is 0.3. The rate of pumping water out of the Ogallala is 21 times greater than the recharge rate. This means that the water pumped out of this aquifier will indeed add to the surface water amount. Yes it will add to the surface storage, the atmosphere and yes the ocean as well.
    0 0
  32. muoncounter - The chapter from Milly et al 2010 notes that "water content of the global atmosphere (≈25 mm water equivalent) is tightly constrained thermodynamically", and therefore they consider the remaining water to either be on/in the land surfaces or in the ocean. Norman - My initial comment on this thread was in response to your mistaken statement that "...the water added to the system via irrigation is fairly close to the amount of water added by melting ice. Meaning the sea water will continue to rise regardless if the ice melting stops and the problems of the future will still remain." I believe I have referenced sufficient data to indicate that is incorrect - that our water usage (despite climate effects on local water availability) is not having any significant effect on SLR, that you are only looking at one side of the equation. Unless you have relevant comments and references indicating that Milly, Chao, and others, and their data, are somehow wrong, unless you can demonstrate that we have increased net flow to the oceans and hence affected SLR, I fail to see the point of chasing that particular red herring. And that includes external constraints on our net water flow - the contributions from thermal, haline, and ice melt to SLR severely limit the range of any additional anthro contribution. I believe the remainder of the discussion on aquifers versus physical impoundment versus redistribution of terrestrial water supplies is off topic in this thread. Perhaps you can take this to one of the discussions on climate change related droughts?
    0 0
  33. KR @25 From the article you linked to. "Gornitz (2001) compiled estimates of mining rates for specific countries from various sources; those explicitly reported rates totaled about 61 km3/year (or 0.17 mm/year sea-level rise) both for recent years and for the last half-century. Gornitz extrapolated that value by assuming that the ratio of mining to total groundwater withdrawal was similar globally to what it was in the studied regions. Depending on the details of the extrapolation, this approach led to a wide range of estimates of 0.17–0.77 mm/year for the gross effect of groundwater mining on sea-level rise." The problem is the report I linked to (which does not seem to work now) states the deep ground water use for irrigation is 545 cubic kilometers of water a year (and rising) Try it here again. Groundwater use in irrigation -a global inventory. In your link it states that 61 km^3 is equivalent to a 0.17 mm/year sea rise. If the more correct figure for the acutal global amount of deep water being used for irrigation is 545 km^3 (and much of this irrigation is in arid regions with slow recharge rates for the aquifiers which is described in the link), that comes out to 8.93 times more than 61. If 61 is responsible for a 0.17 mm sea level rise per year, 8.93 times this amount would be equal to a sea level rise of 1.52 mm/year. Multiply this by 7,for the GRACE study years that gave melting ice as responsible for 12 mm rise in sea level and the deep water withdrawal (with very slow recharge rates), and you have an equivalent of 10.63 mm of total sea level rise from pulling water from aquifiers.
    0 0
  34. Norman @31, yes, but it will add to surface waters at a rate of 5.92 units* per annum, not 6.22. By not quoting the net change you are distorting the picture. How much you may be distorting the picture is shown if we see past your cherry picking of the aquifer with the worst ratio of recharge rates to pump rates from your source. Looking at all Texas aquifers, the 1995 pump rates were 9.16 units per annum, while the recharge rate was 3.92 units per annum, for a net difference of 5.24 units per annum discharged from aquifers to the surface. The relevant ratio is 2.34 to 1, compared to your cherry picked 21 to 1. The point here is not that the Texas total can be scaled to the global figures. It is far too small a sample for that. The point is that unless you provide the figures for both discharge and recharge of aquifers, which you have failed to do, then you cannot determine the net effect on global sea levels. Some of the water will also be retained as increased surface soil moisture, increased moisture content in vegetation and increased humidity in the area of irrigation, but I assume that that is trivial in comparison. But you cannot make the assumption of triviality with regard to recharge rates. Note that I do not know the recharge rates. Globally they may also be trivial. But you need to either cite them to establish that, or to cite a peer reviewed source to that effect. Finally, a cherry pick which shifts the determined ration by almost an order of magnitude (8.9:1) is particularly egregious, and demands some explanation and, IMO, apology. It may be OK to knowingly publish misleading information at WUWT, but it is not acceptable here. * units not given in source.
    0 0
  35. Norman - You are cherry-picking a single item from the article, and not considering the complete work. The conclusions you then draw from that practice are guaranteed to be incorrect. I strongly suggest that you look at Milly et al 2010 - Table 8.2, where they summarize all the data they present, not just single pieces, and from that conclude a net zero contribution. As well as Table 8.1, where they summarize the external constraints that limit any possible water use contribution to somewhere between 0.0 and 0.3 mm/yr, or a central value <1/20th observed sea level rise. Consider all the data.
    0 0
  36. Norman @33, from Siebert et al 2010 (linked by you):
    "While the rising importance of groundwater withdrawals in global freshwater supply is well established, there is still a large uncertainty on the volumes and spatial distribution of both groundwater recharge and withdrawals. Using a global hydrological model, mean annual direct groundwater recharge was estimated at 12,600 km3 yr−1 which is about one third of the total renewable freshwater resources (Doll, 2009). However, this global estimate explicitly ¨ excludes indirect recharge resulting from runoff events and transmission losses. These indirect recharge processes are dominant in semi-arid and arid countries where interior or coastal alluvial plains receive high volumes of runoff from surrounding mountain fronts (Scanlon et al., 2007). The Tihama and Batinah coastal plains in Yemen and Oman are prime examples. Total groundwater withdrawals are estimated to be in the range 600–1100 km3yr−1or between one fifth and one third of the total global freshwater withdrawals (Doll, 2009; Shah et al., 2007; Zektser and Everett, 2004)."
    (Emphasis added) So your own source indicates that discharge of ground water is from half to equal recharge of groundwater. That would indicate that changes in total groundwater inventory globally is either reducing the sea level, or having no effect. Granted that these figures have a "large uncertainty", so it is entirely possible that the net effect is actually to increase Sea Level, but you have not presented relevant evidence to that effect. You have only seemed to do so by presenting half the story. Your comment that "much of this irrigation is in arid regions with slow recharge rates for the aquifers" is irrelevant as we are discussing global, not regional balances. Aquifers can store more water over time, as well as less. Indeed, if recharge exceeds discharge, which on the evidence of your source it probably does, some aquifers must be increasing their storage.
    0 0
  37. Jim Eager#28: Norman's preposterous claim is that all water taken from the ground ends up in the ocean on the 8 year time frame of this post. This is an assumption on his part that has been shown to be false. And he has successfully distracted this thread with this utter red herring.
    0 0
  38. Hansen's Figure 14 "Current Contributions to Sea Level Change" in Earth's Energy Imbalance and Implcations shows his latest assessment of the literature which is just prior to the publication of the Jacob, Wahr, Pfeffer and Swenson Nature paper under discussion. If you add the Hansen Greenland and Antarctica middle of the error bar values (0.85 mm/yr) and compare to Jacob et.al. data (1.06 mm/yr) for those areas you see that one thing Jacob et.al. discovered is that more ice may be melting in the places where most of the ice on land on the planet is than a type like Hansen thought. Hansen commented on the error bars in his Figure 14 by referring to sea level data, i.e. his Figure 12 saying "the recent measured sea level rise favors the lower estimates of ice sheet melt". So if you add up his "lower estimates" for Greenland and Antarctica from Figure 14 you get an even lower total, 0.44 mm/yr in comparison to Jacob et.al.'s 1.06 mm/yr. A wild headline could have read "Ice sheet disintegration doubles at poles - scientists stunned!" which might have as much basis in reality as some of the headlines on articles about the Jacob et.al. paper. All of Hansen's low estimates add up to a low estimate for total global ice on land melt contribution to sea level which equals 1.27 mm/yr. The Jacob et.al paper finds the total to be 1.48 mm/yr. Pfeffer, in his Nye Lecture presentation to this years AGU commented that observation of glaciers has tended to be in areas that are easy to get to, as opposed to a representative or comprehensive set of glaciers someone knowledgeable might choose for a dataset.
    0 0
  39. Tom @34 You provide a good challenge "Note that I do not know the recharge rates. Globally they may also be trivial. But you need to either cite them to establish that, or to cite a peer reviewed source to that effect." I did some research into this and found this Nonsustainable grounwater sustaining irrigation: a global assessment. I did sight the 545 km^3 from deep water mining from the other link. I have not found a correct current amount of nonsustainable water mining (fossil aquifiers) so I am not sure what it is in 2012. In 2000 it was found to be 234 km^3 (from the link above). From the abstract: "Results also show that globally, this contribution more than tripled from 75 to 234 km3 yr−1 over the period 1960–2000." Nonsustainable water mining tripled from 1960 to 2000. In 2000 it was estimated to be 234 km^3/year. In 2012 if may be higher than 2000 but probably not as high as the 545 km^3 given in the other article. Nonsustainable means the this water is being removed and not replenished. Here is the general description of aquifier types: "There are two types of aquifers: replenishable and nonreplenishable (or fossil) aquifers. Most of the aquifers in India and the shallow aquifer under the North China Plain are replenishable. When these are depleted, the maximum rate of pumping is automatically reduced to the rate of recharge. For fossil aquifers—such as the vast U.S. Ogallala aquifer, the deep aquifer under the North China Plain, or the Saudi aquifer—depletion brings pumping to an end. Farmers who lose their irrigation water have the option of returning to lower-yield dryland farming if rainfall permits. In more arid regions, however, such as in the southwestern United States or the Middle East, the loss of irrigation water means the end of agriculture." source. Here is another describing fossil water water 75,000 years old in Libyan aquifier.
    0 0
  40. 0 0
  41. KR @35 Your link does state that ground water mining will result in a positive increase in SLR of 0.25 mm/year. My problem is with the huge difference in calculating the amount of unsustainable water removal from deep aquifiers. The listed total amount of deep water used in irrigation is 545 km^3 per year. As Tom Curtis pointed out, this amount does not indicate a recharge rate of even the deep water wells. I did find another source that points out that of this amount above, 234 km^3 (in the year 2000) is unsustainable meaning it is not going back into the deep aquafier storage but being removed and added to the total surface water amount. Section 8.4.3 in your linked article are what I question. How are their numbers so much lower than other sited sources? If you use the other value of 234 km^3(which was a 2000 number and may be higher today with expansion of deep water mining) instead of 61 km^3/year that your link uses, the amount of SLR due to deep water mining of fossil aquifiers is closer to 1/5 of the total amount and is a valid player in the SLR equation.
    0 0
  42. Norman@41: AT the rate of depletion of fixed aquifiers, the problem will come to an end in approx 18 years based on the latest information I read. Not a very comforting thought at all.
    0 0
  43. KR and Tom Curtis Here is another report which gives even a higher figure for unsustainable water use (being withdrawn at higher rates than replenished meaning it will increase the surface amount by that volume since it is no longer present in the location it had been). Fresh Water Chapter 7. In this book you can scroll down to page 175 and view Table 7.4 In this table they give the World non-sustainable water use. Ranges from 391-830 km^3/year (Note Tom Curtis, even replenishable aquifiers can be pumped at rates exceeding their recharge rates). If you use the highest value for non-sustainable water use it would be a very significant player in SLR. (830/61=13.6)....(13.6 x 0.17 mm SLR for 61 km^3 H2O=2.31 mm). Current SLR rate is 3.4 mm/year so this water use could account for over 50% of the current rate of SLR if the higher figure is used. I am not saying this would be valid. I brought it up to make a point that you should not discount water mining as one possible source of SLR, it may be larger than you currently accept.
    0 0
  44. Norman - There are two separate conversations going on here, and a certain lack of recognition of that issue. First: Deep aquifers are being depleted at high rates in many ares. This is definitely bad - leading to numerous agricultural issues and relocation costs. Current practices will not be sustainable in many areas. But the best data available indicates that a roughly equivalent amount of water is being sequestered elsewhere, changing the current availability of said water in considerable detail without affecting total runoff. While I don't want to minimize this very important issue, it's not the center of this thread. This thread is on the climate change effects on the cryosphere, on ice melt in areas >100km^2 as measured by GRACE. It is very useful, however, that the GRACE data also supplies some information about aquifer changes. Second: Sea level rise due to anthropogenic is not greatly affected by terrestrial/anthropogenic usage. Milly et al 2010 shows that in considerable detail (with numerous reference of their own). --- So: Aquifer level changes, recharge rates, etc. - all of those are off topic here. Assertions that anthro water usage affect sea level are not supported by the full set of data, your cherry-picking of single numbers from Milly 2010 notwithstanding. Moderators - Perhaps side topics such as aquifer changes need to go elsewhere?
    0 0
  45. GRACE provides a good indication of the magnitude and area of ice loss but, because it has difficulty in detecting smaller areas where loss is occurring, it should be regarded as providing an understatement of land ice loss. For example, physical inspection shows that glaciers of the Sierra Nevada are in retreat. Similarly glaciers in Glacier National Park are mostly in retreat, yet neither of these is detected by GRACE - or are they detected but the data is not used to show these losses? The reason I ask is because 2009 data provided by GRACE did show depletion of groundwater in the Central Valley of California over a 6 year period but now it purportedly shows nothing – or at least nothing it reported in respect of this area. Nor is anything reported on the state of glaciers in the numerous Russian mountain ranges, thought many are known to be in retreat. GRACE detects gravity changes arising from the movement of water whether in the form of ice, snow or liquid. If glacier ice melts in the Himalaya mountains and is stored as natural lakes, then GRACE will show no loss since there has been no change in gravity. GRACE can not measure the different forms water is present in an area, only the extent to which it has moved into or out of that area. Rob Painting makes the valid point that … “under conditions, such as the recent La Nina-dominant period … a much warmer western tropical Pacific intensifies the Asian Monsoon, and dumps more snow on the high plateau.” This does not appear to have occurred during the reporting period, though it may have occurred more recently. Had it done so, GRACE would have recorded the resulting change in gravity – unless of course increased precipitation was largely balanced by loss of water from the region. What is clear is that if GRACE shows net loss of 500 gigatonnes/annum, there is only one place most of it has gone – the oceans. It puts me in mind of James Hansens prediction of decadal doubling in the rate land ice loss throughout this century. Anyone who thinks that will have no effect on RSL needs to give cogent reasons for their thinking.
    0 0
  46. Agnostic - in regard to the Asian High Mountains - 2010-2011 saw hundreds of billions of tons extra snowfall. If the study had not included those years it would have shown a dramatic loss of ice. What it shows is that, rather than being stable, as erroneously reported elsewhere, even the high plateau is warm enough to sheds lots of ice annually. Are they likely to get such snowfalls in the future? There are decades of warming yet to come, how will that affect the region?
    0 0
  47. Norman @39, you say I provided a good challenge, and then you do not take it up. The challenge was to show both global figures for groundwater recharge and withdrawals. You point to a paper which provides both of those figures, but you only discuss the differential in basins in which withdrawal exceeds recharge. For what it is worth, the paper you link to estimates a global recharge rate of 15,200 km^3 per annum, and a withdrawal (abstraction) rate of 734 km^3 per annum. So withdrawal is only 5% of recharge globally, according to this paper. So, despite your continued cherry picking of the data, you have still not shown evidence that supports your claims, let alone establishes them. If you wish to discuss the depletion rates of aquifers used for irrigation, than regional data confined to those parts of the Earth suffering from depletion is relevant, but your entire discussion is then off topic in this thread. If we want to discuss the effect of the global water balance for aquifers on sea levels, then discuss the global effects, and stop this transparent cherry picking. Finally, I notice that you have neither explained nor apologized for your blatant cherry picking as detailed at 34 above. In view of this there is no point in further conversation with you until you do. Somebody capable of unapologetic cherry picking in so blatant a manner is not interested in rational conversation, or in finding the truth of things. They are only interested in deceiving people with half truths. Such people should be exposed, not debated with, and your continued cherry picking has certainly exposed your intentions.
    0 0
  48. Tom Curtis @34 My point is off topic for this thread so I will quit but before ending you ask me to apologize and blame me for "cherry picking". In the 31 post you refer to I was not "cherry picking" the worst recharge rate to form a global conclusion or even support my original post of 21. It was a side point directed at you to show the difference in aquifiers. Some recharge quickly, others not so quickly. It was a side point only and its use was as a demonstration of difference. I did include Global amounts in other posts. So I can apologize for a misunderstanding in what the post's objective was. Does that help? The 8.93 to 1 figure was in a post 33 to KR. I was contrasting his paper with others that indicate the amount of water released form water mining is much greater than what this study showed. In your final post of 47 you would seem to support my assertion that KR's report has greatly undereported how much water is being removed from underwater storage. You have the point withdrawl is only 5% of recharge rate. Sounds small but look at the number you posted 734 km^3/year. This is more than the 545 km^3 I used to show 8.9:1 vs KR's paper. The 545 was just water used for irrigation, other uses have made the number larger to 734 km^3/year. Does this explanation help? My posts may be in direct response to someone's post and not be part of an overall (which is what post 31 to you was about).
    0 0
  49. Norman @48, you evidently do not get it. In your post 31 you referenced a document which had details for six separate aquifers, details for the aggregate of the other aquifers in the state not specifically mentioned, and details for the states total. That is eight separate sets of figures you could have chosen from. Somehow, entirely by accident according to you, you just happened to choose the figures with the lowest recharge rate relative to withdrawals. Not only that, you managed to choose the figures with a ration of withdrawals to recharge that was 8.9 times higher than the ratio for the total for the state, and 10.9 times greater than for any other single aquifer. And you managed, quite by accident apparently, to choose the only aquifer with a ratio that suggested the issue of recharge was trivial, and could be neglected. And indeed, you then continued to neglect it in following posts, persistently. Consequently, your explanation does not wash. You were cherry picking. And saying you were not does not make it so. Given this episode, and Norman's apparent inability to understand basic integrity in data reporting, reader would be well advised to ignore anything he has to offer in future, for it will not be based on a full examination of the evidence, but only on that evidence which suites whichever case he is making.
    0 0
  50. The snowline in 2011 was not particularly low in the Himalaya as seen on Milam Glacier, India or Petrov Glacier, Altai
    0 0

1  2  Next

You need to be logged in to post a comment. Login via the left margin or if you're new, register here.


The Consensus Project Website

THE ESCALATOR

(free to republish)


© Copyright 2024 John Cook
Home | Translations | About Us | Privacy | Contact Us