Scafetta's Widget Problems
Posted on 24 February 2012 by dana1981, Dikran Marsupial
We have previously examined the work of Nicola Scafetta, a climate "skeptic" and solar-climate researcher at Duke University. Scafetta's pet hypothesis is that astronomical cycles are somehow responsible for most of the observed global warming over the past century; a concept we have termed "climastrology," because Scafetta has proposed no plausible physical mechanism through which the orbital cycles of various planets should exert so much influence over the climate on Earth.
In recent papers, Scafetta has put forth predictions as to how the average global surface temperature will change in the future. He has also now created a widget to compare his prediction to the IPCC projections and the monthly observed global surface temperatures. However, as we will discuss here, there are problems with both the widget itself, and the research on which it is based.
Extreme Curve Fitting
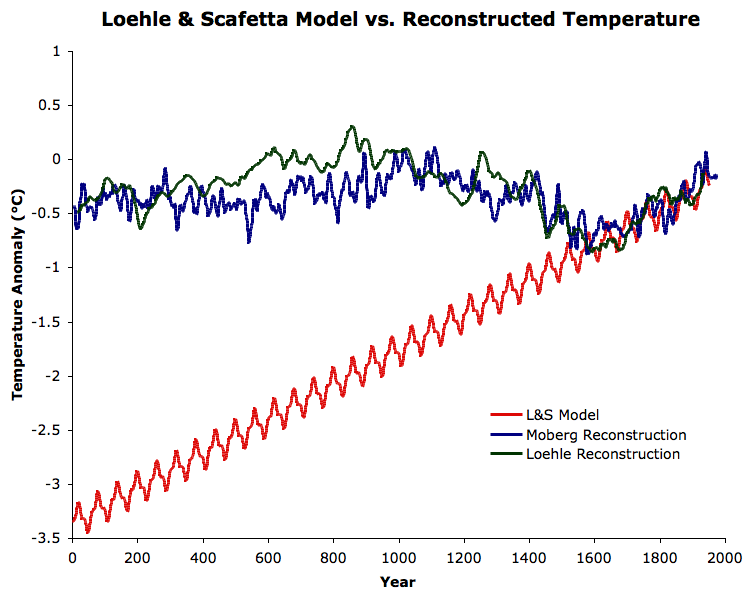
The widget is based on Scafetta (2011), which is very similar to a paper we previously examined, Loehle and Scafetta 2011 (LS11). The latter created a very simple climate model using two cycles (of 60- and 20-year periods) plus a linear warming trend, and adjusted the parameters in their model to fit the observed temperature data. As we showed, this simple model does not accurately hindcast past temperature changes (Figure 1), and thus there is little reason to expect it to accurately predict future temperature changes. It was merely an excercise in curve fitting, matching up a model with the temperature data without any physical constraints.
Figure 1: The LS11 Case 2 model projected backwards in time (red), compared to the Moberg et al. (2005) millennial northern hemisphere temperature reconstruction (blue) and the Loehle (2008) millennial global temperature reconstruction (green).
In his newer paper, Scafetta has taken this curve fitting process several steps further yet. As in LS11 he uses a model with 60- and 20-year cycles and a linear warming trend, but now he has also added a 10.44- and 9.07-year cycle, as well as a quadratic term.
With so many parameters in his model (each astronomical cycle has a time and amplitude variable, in addition to the quadratic, linear, and constant parameters), we're reminded of Barry Bickmore's examination of Roy Spencer's efforts to attribute global warming to internal natural cycles. Bickmore referenced a quotation from the famous mathematician, John von Neumann (h/t Tim Lambert).
With four parameters I can fit an elephant, and with five I can make him wiggle his trunk.
With so many parameters to work with, it's not surprising that Scafetta is able to match his model well with the temperature record. However, as with LS11, Scafetta (2011) has no hindcasting power. It is specifically fit to the 1850-2011 temperature record, and thus is not intended to apply to past temperatures. But if it can't hindcast past temperatures, then why should we expect it to accurately forecast future temperatures?
In fact, not even Scafetta expects his model to create accurate temperature predictions. He applies a different formula to predict post-2000 temperatures than he does to fit the 1850-2000 temperatures. His argument for changing the model is essentially that solar and volcanic effects contributed to his quadratic and linear warming trends during the 1850-2000 period, and he does not expect those contributions to continue into the future. Thus for the post-2000 period, he rather arbitrarily eliminates the quadratic term, and simly models a small linear warming trend of approximately 0.09°C per decade into the future, or approximately 0.9°C warming from 2000 to 2100.
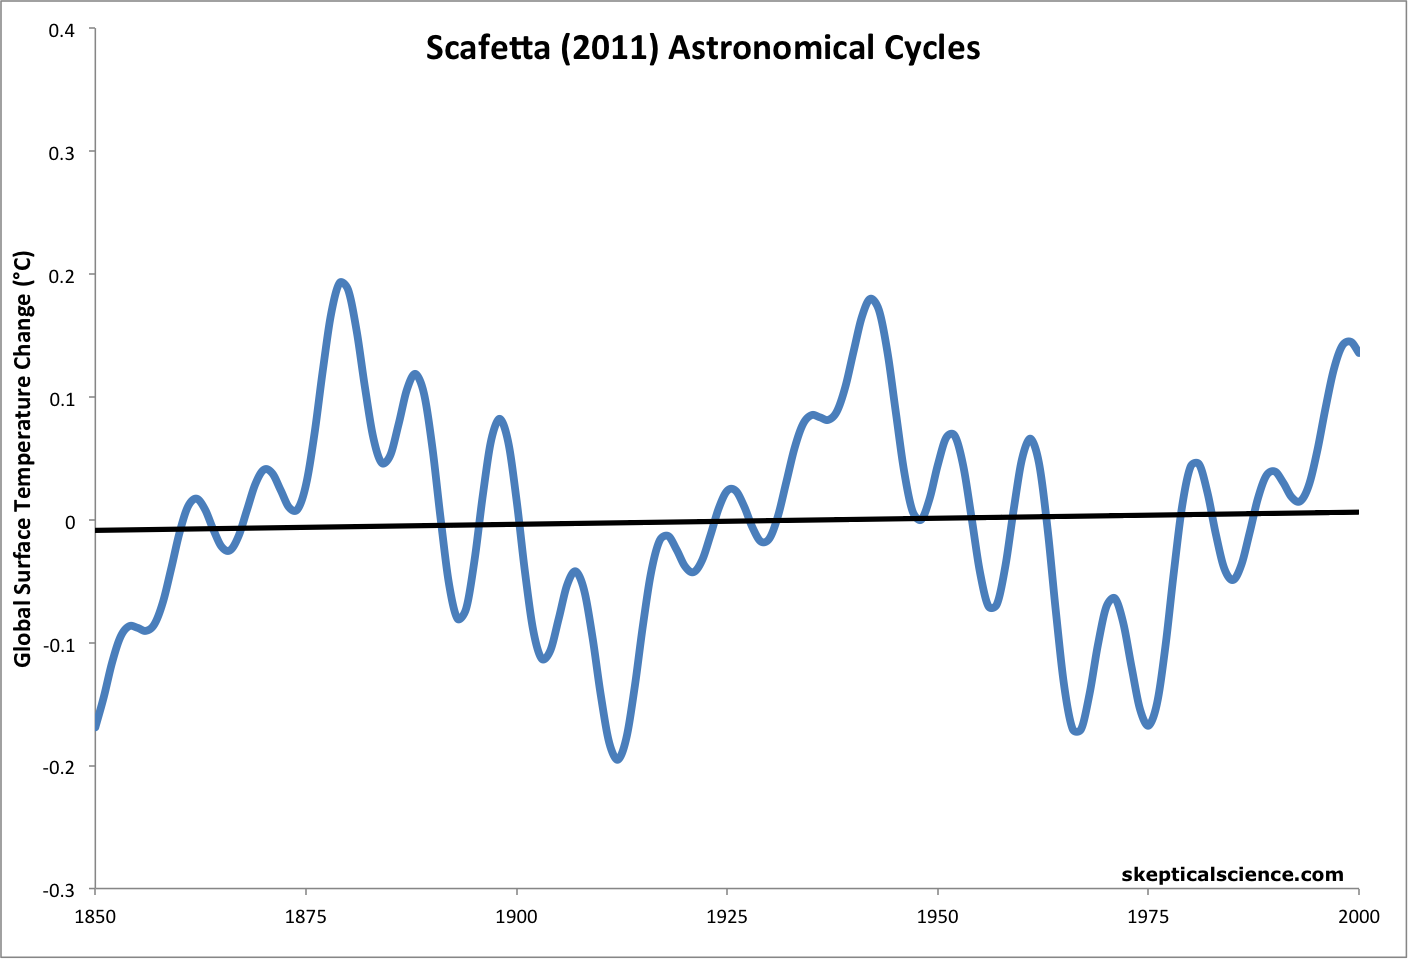
However, there is little purpose in creating a model if we simply discard its predictions and replace them with our own rather arbitrary adjustments. Scafetta's astronomical cycles do not explain the warming trend from 1850-2000, because they are cyclical. This is illustrated in Figure 2, which removes the quadratic and linear terms from Scafetta's model. The influence of the remaining cycles results in nearly zero long-term temperature trend.
Figure 2: Running the Scafetta (2011) model with the quadratic and linear warming factors removed, leaving just the astronomical cycles.
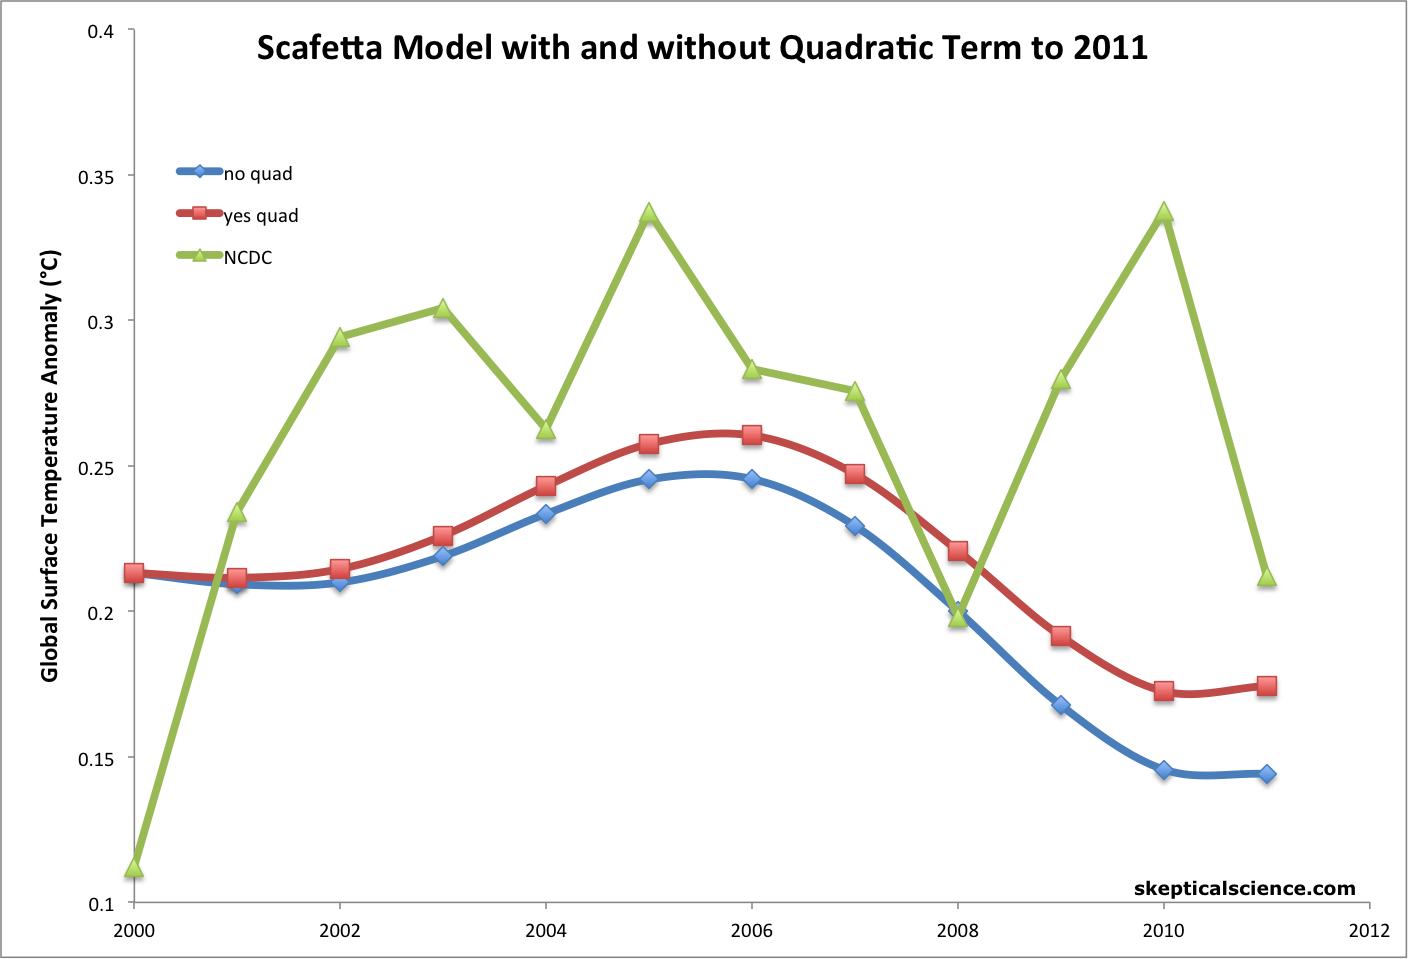
In short, the quadratic and linear terms explain virtually all of the warming trend, and at most the astronomical cycles could explain the temperature variations. Additionally, Scafetta's model without the quadtraic term is not a better fit to the data than when the quadratic term retained post-2000 (Figure 3).
Figure 3: Scafetta model with (red) and without (blue) the quadratic term vs. NCDC annual surface temperature (green) from 2000 to 2011.
Since Scafetta's 1850-2000 model fits the data better than his post-2000 adjustment, he has no justification for making this adjustment. Running the 1850-2000 model to 2100 nearly doubles the surface warming prediction from 0.9 to 1.6°C between 2000 and 2100.
Climastrology
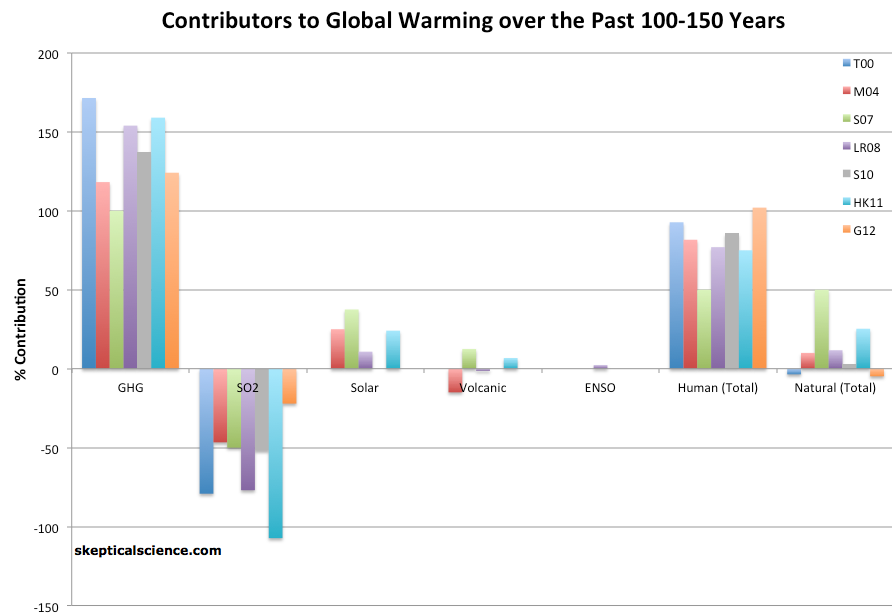
The quadratic and linear terms in Scafetta's model must be associated with an external radiative forcing, and as we have previously shown, greenhouse gases are the dominant contributors to that radiative forcing and thus the consequent temperature change (Figure 4).
Figure 4: Percent contributions of various effects to the observed global surface warming over the past 100-150 years according to Tett et al. 2000 (T00, dark blue), Meehl et al. 2004 (M04, red), Stone et al. 2007 (S07, green), Lean and Rind 2008 (LR08, purple), Stott et al. 2010 (S10, gray), Huber and Knutti 2011 (HR11, light blue), and Gillett et al. 2012 (G12, orange).
Scafetta tries to downplay the role of greenhouse gases by making passing comments about galactic cosmic rays and other effects which he asserts climate scientists have underestimated. However, Scafetta has not supported these assertions in his research. All he has done is create a simple model in which short-term temperature variations are attributed to various cycles and the long-term global warming trend is attributed to quadratic and linear terms. Based on the body of scientific evidence, these two terms are mainly due to greenhouse gases (Figure 4).
Scafetta also attributes his two new hypothesized cycles to Jupiter-Saturn and Sun-Moon tidal cycles, respectively, but as in his previous paper with Loehle (in which the 60- and 20-year cycles are also attributed to Saturn and Jupiter), he does not propose a physical mechanism through which these cycles could impact temperatures on Earth. Thus we are again forced to describe this hypothesis as "climastrology," and since these cycles only explain temperature variability (not long-term trends), they give us no reason to doubt the anthropogenic global warming theory.
Since he has diregarded his own model in predicting post-2000 temperature changes, we have little reason to believe that prediction will be accurate. Scafetta gives a range of possible surface warming trends from 2000 to 2100 (0.66 to 1.3°C), but does not explain how greenhouse gas emissions changes will play into this range. The IPCC issues temperature projections based on specific emissions scenarios, but because Scafetta's model has no physical basis, he cannot do the same. Thus his prediction is based on little more than his interpretation of the body of climate science literature (i.e. overemphasizing the role of cosmic rays on climate), and his reading of the scientific literature is itself quite problematic.
Selective Reading
Since Scafetta's hypothesized astronomical cycles have no impact on the long-term warming trend, his prediction that future global warming will be minimal is based entirely on his interpretation of the scientific literature. For example, he twice mentions that galactic cosmic rays may play a significant role in influencing global temperatures, but fails to mention any of the dozens of papers which have found little if any correlation between cosmic rays and cloud cover on Earth. Scafetta also fails to mention that solar magnetic field, which influences the amount of cosmic rays reaching Earth, has no long-term trend over the past ~60 years, nor does cosmic ray flux on Earth. Thus how can cosmic rays possibly explain the rapid warming over that period? This question remains unanswered.
Additionally, Scafetta references a number of papers which have received peer-reviewed responses, without even mentioning any of those papers:
- Response to Douglass et al. (2007) by Santer et al. (2008)
- Response to McKitrick & Michaels (2007) by Schmidt (2009)
- Response to Scafetta and West (2007) by Benestad and Schmidt (2009)
- Response to Scafetta & Wilson (2009) by Krivova, Solanki and Wenzler (2009)
- Response to Lindzen and Choi (2011) by Dessler (2011)
- Response to Spencer and Braswell (2011) by Trenberth, Fasullo and Abraham (2011) and Dessler (2011), and the publication of the paper led to the resignation of the editor of the journal
Scafetta (2011) was published in a solar rather than climate journal (the Journal of Atmospheric and Solar-Terrestrial Physics), so perhaps the reviewers were unfamiliar with the body of climate science literature and thus allowed this selective reading to pass, but if so, the lack of reviewers informed about the body of climate science literature is itself a problem. Regardless, Scafetta's justification in predicting a small amount of global warming over the next century is based on little more than this selective reading and disregarding of most of the body of climate science literature.
The Widget and IPCC
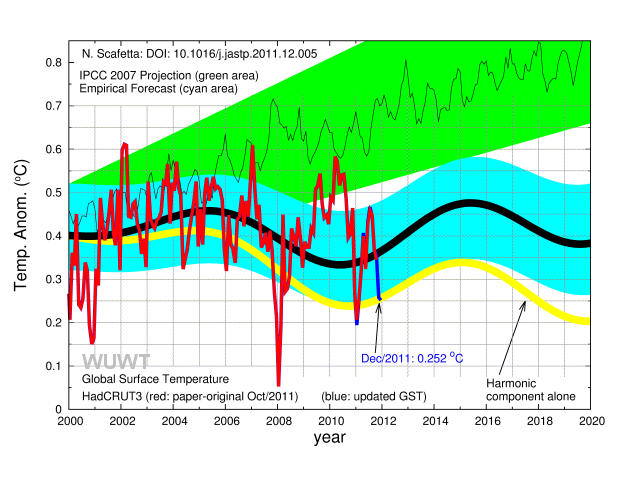
Scafetta has taken a graphic from his 2011 paper comparing his prediction and IPCC projections to the observational temperature data to create a 'widget' which can be updated to see which is closer to the data at any given time (Figure 5).
Figure 5: Scafetta's Widget.
However, aside from the issues with Scafetta (2011) discussed above, this widget has some problems of its own. First, the IPCC projections come from this figure, which only depicts the 1-sigma uncertainty range. Most readers would interpret the green area in Scafetta's widget to be a region that the IPCC would confidently expect to contain observations, which isn't really captured by a 1-sigma interval, which would only cover 68.2% of the data (assuming a Gaussian distribution). A 2-sigma envelope would cover about 95% of the observations, and if the observations lay outside that larger region it would be substantial cause for concern. Thus it would be a more appropriate choice for Scafetta's green envelope.
Second, while the IPCC envelope (Scafetta's green) is based on annual data, in his widget Scafetta plots monthly data, which has greater variability and thus is much more likely to fall outside of the envelope.
Third, Scafetta has used HadCRUT3 data, which has a known cool bias and which will shortly be replaced by HadCRUT4.
Fourth, although the widget itself only shows post-2000 data, Scafetta has used a 1900-2000 baseline. The choice of baseline is not an important issue when discussing trends, which are independent of the baseline choice. However, when only comparing the data graphically, as Scafetta's widget does, the choice of baselines can deceive the eye. For example, if Scafetta's widget were to use the 1980-1999 baseline (as in the IPCC report), the apparent discrepancy between the data and green envelope would be reduced. If Scafetta wants to use the 1900-2000 baseline, an argument can certainly be made to do so, but he should also update the uncertainty of the model projections to account for the change in baseline (which was not done, and as a result likely further biases the test against the IPCC models). If a longer baseline is used, this will necessarily increase the variance in the 1980–1999 period, making the uncertainty envelope wider in 2000 than depicted using the original baseline.
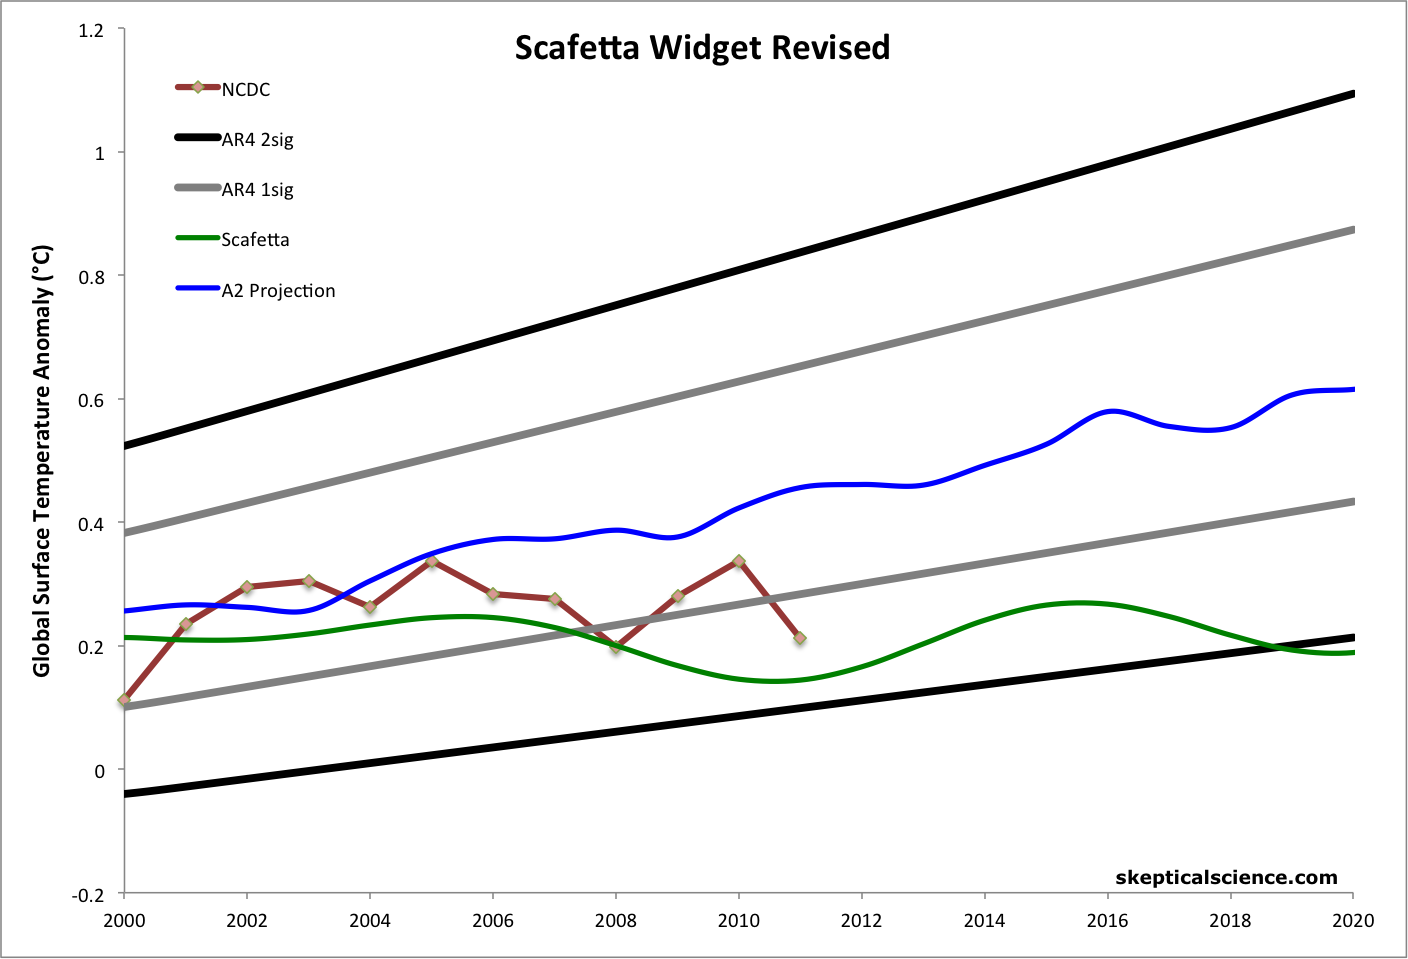
We have made these adjustments to Scafetta's widget in Figure 6, showing both 1-sigma and 2-sigma IPCC uncertainties, using annual NCDC temperature data, and using the 1980-1999 baseline on which the IPCC projections are based.
Figure 6: IPCC AR4 envelope of model runs with 1-sigma (grey) and 2-sigma (black) uncertainty range, NCDC annual surface temperature (red), Scafetta (2011) prediction (green), and multi-model mean for IPCC Scenario A2 (blue).
As Figure 6 shows, while the NCDC data falls outside the 1-sigma envelope in 2008 and 2011, it has not fallen outside the 2-sigma envelope. Thus there is no evidence of a significant inconsistency between the IPCC models and the observations.
Wonky Widget
In summary, the basis of Scafetta's widget (Scafetta 2011) has a number of flaws. Scafetta's model is little more than an extreme example of curve fitting without a sound physical basis. The proposed astronomical cycles only explain the variability in the temperature data, not the long-term trend. The trend is explained by quadratic and linear terms, which he arbitrarily adjusts starting in 2000, based on a very selective reading of the climate science literature. And his model does not fit the post-2000 data any better with the arbitrary adjustment.
The widget itself is similarly problematic. It only displays the IPCC 1-sigma uncertainty range when a 2-sigma range would be more appropriate. It uses monthly data, which has more variability than the annual data in the IPCC figure. It also uses HadCRUT3 data, which is biased low and will soon be superceded with HadCRUT4. And the choice of baseline in the figure exaggerates the visual difference between the data and IPCC projections.
While it is commendable that Scafetta is putting his money where his mouth is with this specific temperature prediction, there is little if any reason to expect the prediction to have any accuracy, and the widget itself should be revised to address the issues discussed above, as in Figure 6.


 Arguments




[DB] ...
DNFTT, people.
[DB] Off-topic dissembling and evasion snipped.
It has been a decade since Scafetta’s 2011 projections were made, so it is time to update the temperature data to compare it to his projections.
In the figure below I have updated his graph by adding the global surface temperature yearly
average anomalies from NOAA/GISS. I’d say the IPCC models are pretty good, especially since the last few years have been La Nina years.
Scafetta projection, the black wavy line, misses the temperature change over the decade by a third of a degree. Recent temperatures of 2015 to 2022 are already comparable to his projection for 2100.
(The NOAA/GISS data is referenced to the 1900-1999 average so I adjusted it to the 1960-1999 reference that Scafetta used. The NOAA/GISS data average for 1960-1999 is 0.135, so I
subtracted that from the data before plotting it as the black dots.)
[PS] If you want to put an image into a comment, you need to first put the image into some suitable image server (eg imgur) and then insert a link. SkS doesnt have ability to host images despite the illusion of it doing so.
photos.app.goo.gl/9y372EWor6C9ExJi9
[PS] if you use a image service that just serves the image, then you can use insert image, make sure width is constrained to 500, and the image will display in the comment. google photos is bad for this as links are to the photo viewer, not the image.
Here is the update to Scafetta's Widget.
[PS] I have updated comment to the actual image, and removed failed attempts You again linked to a page, rather than the image in that page. You want link that has .png, .jpg etc in it.
Additional information on adding image or html to a comment can be found on the comments policy page (at the bottom). The link to the comment policy is just under the comment editor.
sailingfree @68,
Note that the data for global temperatre you plot is NOAA data but not GISS (LOTI) data. Both use the same raw data but process them differently. Thus in NOAA 2015 is warmer than 2017 by +0.02ºC while in GISS 2015 is cooler than 2017 by -0.02ºC.
And both have published the 2022 figure which slots into the record above 2021, although not by much in NOAA.
As you rightly say, the present La Niña is depressing the global average SAT, a La Niña which is expected to end through the coming year, and expected to end a lot more suddenly than previous strong La Niñas (like 1988, 1999 & 2008 which were more sudden transitioning into La Niña and more gradual transitioning out).
MA Roger @69,
Thanks for clarification of the data. And thank you moderator [PS] for fixing the mess I made with the URL.
[PS] You are welcome. Thanks for your work