Prediction: New Surface Temperature Record in 2013
Posted on 13 March 2012 by dana1981
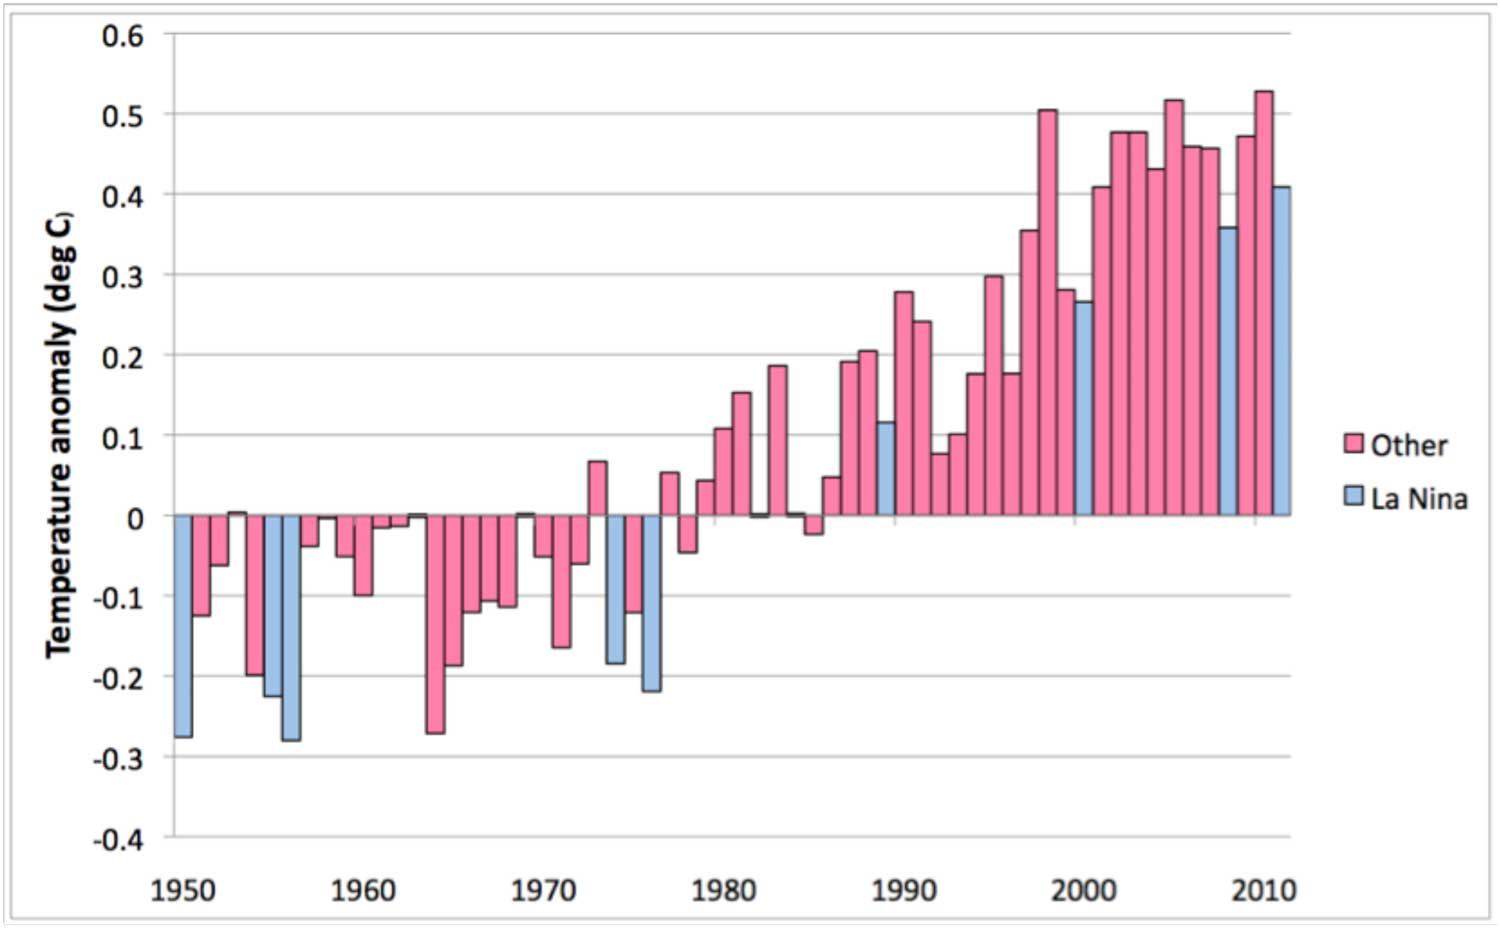
2005 and 2010 are statistically tied as the hottest years in the surface temperature record (according to NASA GISS and NOAA NCDC, and likely according to HadCRUT4, once the update is released). 2011 was a relatively cool year due to the cooling influence of a strong La Niña event. In fact, 2011 was impacted by the 5th-largest La Niña influence of any given year since 1950, and the largest since 1974. Nevertheless, it was the 10th-hottest year on record, and the hottest La Niña year on record (Figure 1).
Figure 1: Average of NOAA, GISS, and HadCRUT annual global surface temperature anomalies. Blue bars indicate years influenced by La Niña events. 2011 is the warmest La Niña-influenced year on record (Source: WMO)
Predicting Near-Term Temperatures
It's an interesting, although inherently difficult exercise to predict how short-term temperatures will change, because short-term temperature influences like solar and volcanic activity and the El Niño Southern Oscillation (ENSO) are each rather unpredictable themselves. Nevertheless, scientists are getting better at predicting future total solar irradiance (TSI) and ENSO changes, which are two of the largest natural short-term surface temperature influences.
Foster & Rahmstorf (2011) (FR11) utilized a statistical multiple linear regression approach to estimate the influence of these three natural factors on global surface temperatures. We can thus use their results and predictions of future TSI and ENSO changes to estimate how surface tempertures will change in the near future.
For example, the Multivariate ENSO Index (MEI) has a 2 to 4 month lag before its changes are reflected in global surface temperatures, and multiplying the MEI value by approximately 0.075 provides an estimate of its influence on global surface temperatures, according to FR11. Changes in TSI or sunspot number have a 1 month lag, and multiplying a change in TSI by roughly 0.07 provides an estimate of its surface temperature influence. And of course we expect CO2 to be causing approximately 0.02°C surface warming per year.
We can then compare these influences in recent years (starting in 2000), compared to actual observed temperature changes (Table 1). The predictions for each year in Table 1 apply the temperature influences to the observed temperature (from NASA GISS) from the previous year.
Table 1: Temperature Influences (°C) and Predicted vs. Observed Temps
| Year |
ENSO | TSI | CO2 |
Predicted T | Observed T |
| 2000 | -0.055 | 0.035 | -- | -- | 0.35 |
| 2001 | -0.020 | 0.038 | 0.02 | 0.41 | 0.48 |
| 2002 | 0.015 | 0.012 | 0.04 | 0.51 | 0.56 |
| 2003 | 0.047 | -0.003 | 0.06 | 0.60 | 0.55 |
| 2004 | 0.027 | -0.033 | 0.08 | 0.52 |
0.48 |
| 2005 | 0.044 | -0.049 | 0.10 | 0.50 | 0.62 |
| 2006 | -0.008 | -0.063 | 0.12 | 0.57 |
0.55 |
| 2007 | 0.028 | -0.070 | 0.14 | 0.58 | 0.58 |
| 2008 | -0.064 | -0.070 | 0.16 | 0.51 |
0.44 |
| 2009 | -0.003 | -0.070 | 0.18 | 0.52 | 0.57 |
| 2010 | 0.036 | -0.060 | 0.20 | 0.64 | 0.63 |
| 2011 | -0.092 | -0.056 | 0.22 | 0.53 |
0.51 |
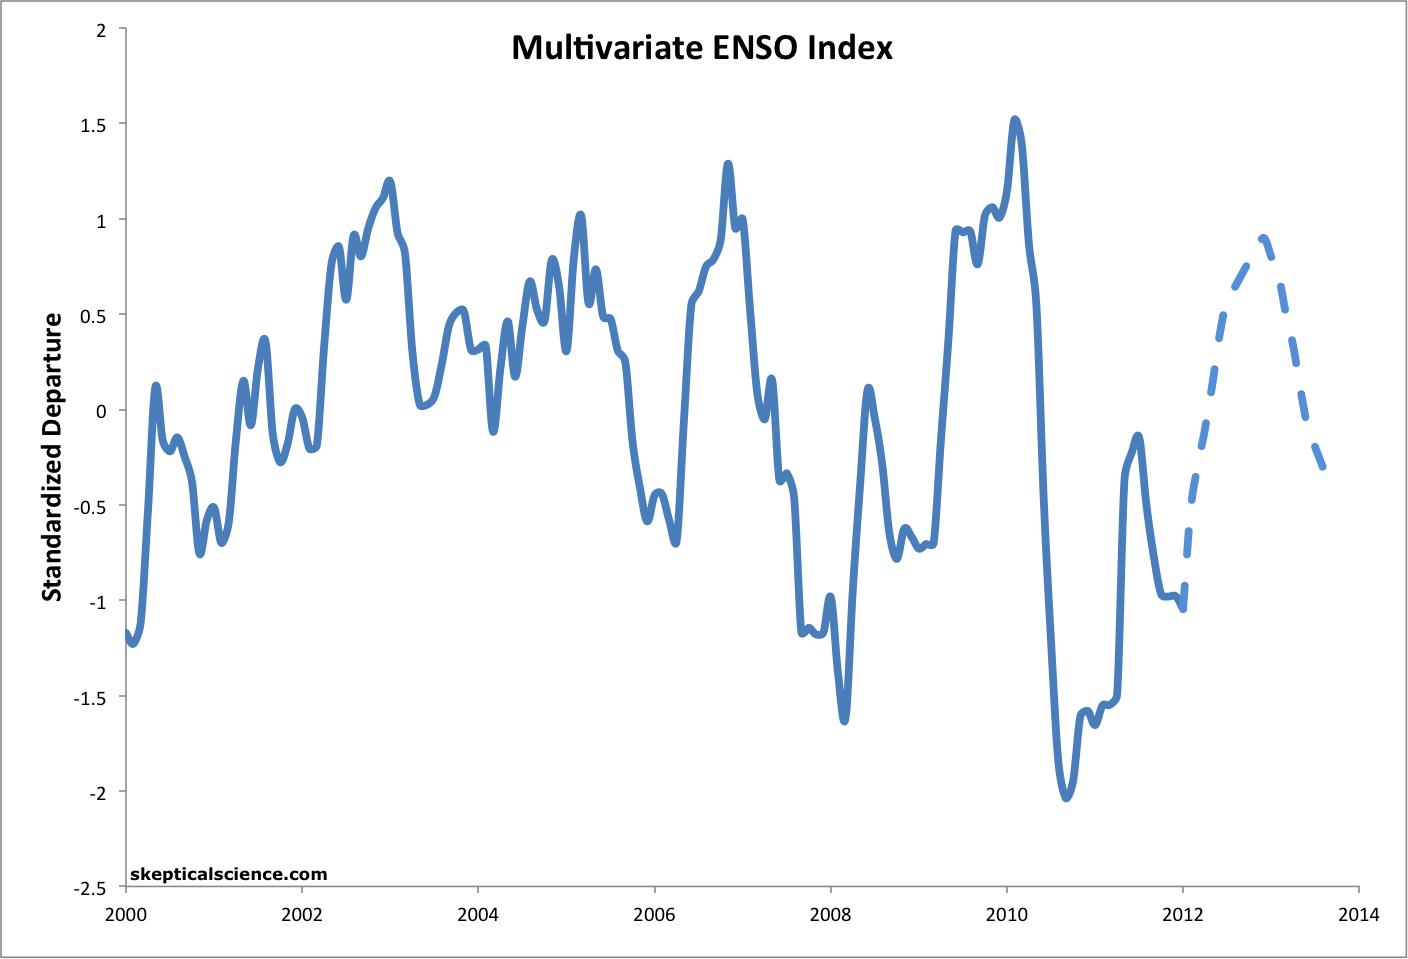
So this model does reasonably well, usually predicting the year-to-year GISS surface temperature anomaly within 0.07°C, though it tends to underestimate large changes. We can then apply it to predict the anomalies for 2012 and 2013, given TSI and ENSO predictions. TSI is expected to peak around 2013, though as a relatively weak solar cycle. ENSO is expected to enter neutral conditions in the next couple of months, and then transition into a moderate El Niño cycle through the end of 2012. ENSO predictions don't extend into 2013, so we'll take a guess that the El Niño cycle will phase out, and 2013 will average a weak positive ENSO temperature influence (Figure 2).
Figure 2: MEI observed (solid, NOAA) and predicted (dashed, NOAA through 2012, guesstimate thereafter).
The resulting predictions are shown in Table 2.
Table 2: Temperature Influences (°C) and Predicted GISS Anomalies
| Year |
ENSO |
TSI | CO2 |
Temp Anomaly |
| 2010 | 0.036 | -0.060 | -- | 0.63 |
| 2011 | -0.092 | -0.056 | 0.02 | 0.51 |
| 2012 | -0.024 | -0.015 | 0.04 | 0.65 |
| 2013 | 0.030 | 0.025 | 0.06 | 0.76 |
As Table 1 shows, 2012 may break the temperature record, though the prediction is well within the margin of error. Thus if the El Niño doesn't form as soon or as strong as expected, or if solar cycle 24 stalls, or if one of the factors not included in this simple analysis (such as aerosols or clouds or other ocean cycles) acts in the cooling direction, 2012 will probably not break the record.
However, all three of the major temperature influences will be in the warming direction in 2012 as compared to 2011, assuming the El Niño develops as predicted. All three may also be in the warming direction in 2013 as compared to 2012, again with ENSO being the main question mark. Thus it appears quite likely that 2013 will break the surface temperature record, and quite possibly by a large margin, with a solar cycle peak and possible El Niño year. There is also a reasonable chance that both 2012 and 2013 will break the surface temperature record.
These predictions are of course nullified if there is a significant volcanic eruption in either 2012 or 2013, as they operate under the assumption that the volcanic influence will be roughly zero. They also do not consider the human aerosol influence. With China's economy growing, but the nation becoming more and more conscious of both air quality and global warming concerns, human aerosol emissions changes are very difficult to predict.
Summary
This exercise provides a very rough estimate for 2012 and 2013 annual average surface temperatures, with a number of caveats. If solar cycle 24 continues to develop as expected, and and if an El Niño cycle develops as expected, and if there are no major volcanoes or other major changes in aerosol emissions, then this method projects a possible annual temperature record in 2012, and a likely record in 2013. In fact, because we can be confident that 2013 will be at or near a solar cycle peak, and we know the CO2-caused warming will continue upwards, 2013 will probably break the surface temperature record even if it's a moderate La Niña year (again, assuming there are no volcanic eruptions or other significant unaccounted-for effects).
Note that Arthur Smith has done a similar analysis with very similar results, predicting a possible record in 2012 (also 0.65°C) and a likely record in 2013 (at 0.73°C without considering the ENSO influence).
Also note that this is my [Dana Nuccitelli - dana1981] personal prediction and is not representative of Skeptical Science as a whole. So, what's your prediction?


 Arguments


 0
0  0
0


Comments