Climate Science Glossary

Term Lookup

Enter a term in the search box to find its definition.

Settings

Use the controls in the far right panel to increase or decrease the number of terms automatically displayed (or to completely turn that feature off).

Term Lookup

Settings


All IPCC definitions taken from Climate Change 2007: The Physical Science Basis. Working Group I Contribution to the Fourth Assessment Report of the Intergovernmental Panel on Climate Change, Annex I, Glossary, pp. 941-954. Cambridge University Press.

Home Arguments Software Resources Comments The Consensus Project Translations About Support

Bluesky Facebook LinkedIn Mastodon MeWe

Twitter YouTube RSS Posts RSS Comments Email Subscribe


Climate's changed before
It's the sun
It's not bad
There is no consensus
It's cooling
Models are unreliable
Temp record is unreliable
Animals and plants can adapt
It hasn't warmed since 1998
Antarctica is gaining ice
View All Arguments...


Username
Password
New? Register here
Forgot your password?

Latest Posts

Archives

Did Phil Jones really say global warming ended in 1995?

Posted on 16 February 2010 by John Cook

A headline in the Daily Mail has spread like wildfire, claiming that Phil Jones, ex-director of the University of East Anglia’s Climatic Research Unit, said "there has been no global warming since 1995". Not only did Phil Jones not say these words, this interpretation shows a poor understanding of the scientific concepts behind his words. To fully understand what Phil Jones was saying, one needs to read his actual words and understand the science discussed. Here is the relevant excerpt from the BBC interview:

BBC: Do you agree that from 1995 to the present there has been no statistically-significant global warming

Phil Jones: Yes, but only just. I also calculated the trend for the period 1995 to 2009. This trend (0.12C per decade) is positive, but not significant at the 95% significance level. The positive trend is quite close to the significance level. Achieving statistical significance in scientific terms is much more likely for longer periods, and much less likely for shorter periods.

BBC: How confident are you that warming has taken place and that humans are mainly responsible?

Phil Jones: I'm 100% confident that the climate has warmed. As to the second question, I would go along with IPCC Chapter 9 - there's evidence that most of the warming since the 1950s is due to human activity.

Phil Jones is saying there is a warming trend but it's not statistically significant. He's not talking about whether warming is actually happening. He's discussing our ability to detect that warming trend in a noisy signal over a short period. To demonstrate this, look at the HadCRUT temperature record from 1995 to 2009. The linear trend is that of warming. However, the temperature record is very noisy with lots of short term variability. The noisy signal means that over a short period, the uncertainty of the warming trend is almost as large as the actual trend. Hence it's considered statistically insignificant. Over longer time periods, the uncertainty is less and the trend is more statistically significant. 
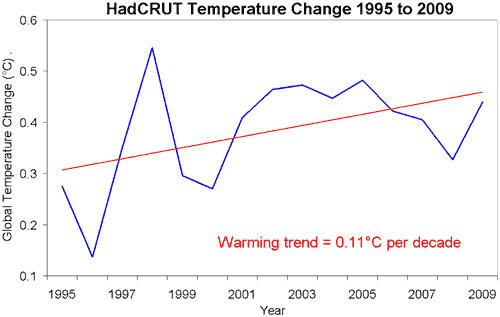
HadCRUT global temperature 1995 to 2009
Figure 1: HadCRUT global temperature change in degrees Celsius. Blue is yearly average. Red is linear trend (HadCRUT).

It bears remembering that the HadCRUT record only covers around 80% of the globe. Analysis by European Centre for Medium-Range Weather Forecasts (ECMWF) and NASA GISS (Hansen 2006) find that the areas omitted by HadCRUT are some of the fastest warming regions in the world. Consequently, the HadCRUT record underestimates the warming trend, as demonstrated by the NASA GISS record which covers the whole globe:
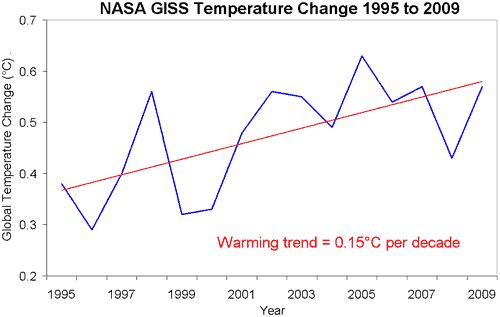
NASA GISS global temperature 1995 to 2009
Figure 2: NASA GISS Global temperature change in degrees Celsius. Blue is yearly average. Red is linear trend (NASA GISS).

However, even this doesn't give you the full picture. Surface temperature is only a small fraction of our climate with most of global warming going into the oceans. When all the heat accumulating in the oceans, warming the land and atmosphere and melting ice is tallied up, we see that global warming is still happening.
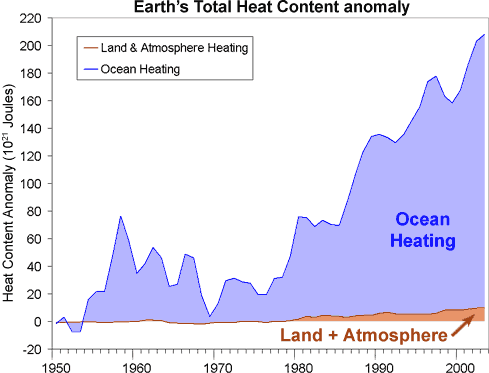

Figure 3: Change in total Earth heat content from 1950 (Murphy 2009).

0 0

Printable Version  |  Link to this page

Comments

Prev  1  2  3  Next

Comments 51 to 100 out of 104:

  1. suibhne @44 I think I'm right in saying that the CRU have pointed out that they do not generate any original data (records)-- that is, they don't go off to the South Pole, or wherever, to gather readings -- so if Jones said he is not very good at keeping records, it doesn't necessarily mean that he's lost original data, or not know where the original data exists. As I said -- in effect -- earlier, he's a dolphin that's found himself in a pool of sharks. He might be more intelligent and knowledgeable than they are, but his teeth are seriously inadequate.
    0 0
  2. Tom Dayton,John Russell Read the Nature interview very revealing!..... and a reply from Keenan, D. J. underneath article. Energy & Environment, 18, 985-995 (2007).
    0 0
  3. There seems to be a bit of confusion about "statistical significance". Statistical significance is given usually as a p-value which is the probability that the data occurred by chance alone. If an hypothesis has a low enough p-value, we tend to accept it because the evidence (data) is therefore unlikely to be by chance alone. Ronald Fisher, who introduced p-values, set 5% and 1% as threshold values for significant *"highly significant" results. But there is an element of subjectivity about p-values. Suppose your p-value is 0.0505? Is that significant? Some practitioners suggest just publishing the p-value and then deciding. Jones did not publish his p-value but it must have been less that 10%, or quite close to 5%. The null hypothesis in this case is that the slope of the fitted trend line through the points = 0. If the 95% confidence interval for the slope contained 0,then the null hypothesis would be accepted.
    0 0
  4. There is another way we can look at this borrowed from quality assurance methods. It is a bit crude, but it looks to me like 8 of the last 9 points in Figures 1 and 2 are above the mean of all the points (which seems to be about 0.35). If we set the probability of being above the mean to be 0.5, then it just an application of the Binomial Theorem - the probability of that happening is 9^0.5^8*0.5^1 = 0.0178, which makes it significant at the 5% level. The deduction is that there is an "upward shift in the mean" between the start of the sequence of points and the end. In QA, this is called a "run above the mean". If you take all the points, 9 are above the mean & 6 below, which has a 0.1527 probability.
    0 0
  5. Oops, Binomial formula should be 9*0.5^8*0.5^1=0.0178
    0 0
  6. Re: TobyJoyce in #55 -- it's good for you to provide a basic summary (and I look forward to the one John Cook promised in #19). However, I'd like to take issue with your last statement that "the null hypothesis would be accepted." As D.Marsupial says in #24, one fails to reject the null hypothesis; one doesn't accept the null hypothesis. This sort of terminology is adopted because the null hypothesis (hypothesis of no difference) may be statistically indistinguishable from the alternate hypothesis if the effect size and sample size are small relative to the noise in the system.
    0 0
  7. The important question about trends is not about statistical significance, which is very much dependent on the methods used, but of stability. Starting with the latest records, and extending the observation period backwards, does the trend coefficient stabilize in a reasonable time, and on what? Trends for shorter periods may very well be statistically significant - that is mostly a question of fluctuation, noise, level. But are they stable? The 1995-2009 GISS trend of ca 0.15 degC/decade seems to be a relatively stable figure. To get much higher values, you have to cherry-pick observational series, and likewise, to get much lower values, you have to omit a lot. Interestingly, the GISS and UAH trends are very close to each other. Of course, there is really no scientific significance associated with the 0.05 level, it's just one practical about reporting and one formal about what we, by convention, may report. Only great fools would disregard a result at the 0.06 level because "it is not significant" - after all, it's 94% chance there is something there. Likewise, as you would get a 5% significant result by chance one in out of 20 trials, you really can't "trust" a randomly chosen 5% result. It's all about looking at the whole picture of information. And when we can get results as significant as we like just by extending the observation period a little, any talk about "null hypothesis acceptance" her may be utterly misleading. The rank viewpoint may be useful, but I think it should be used carefully in simplistic statistical modeling: If, for instance, all the last 10 years are among the top 30 on record (I haven't checked that, just an illustration, but it's not too far off), it's far too early to talk about "cooling", even if we may have entered into a new period, with new trends. We just have to await the further development.
    0 0
  8. When Steve L wrote "if the effect size and sample size are small relative to the noise in the system," he was referring to statistical power.
    0 0
  9. Steve L. @#59 "As D.Marsupial says in #24, one fails to reject the null hypothesis; one doesn't accept the null hypothesis" Yes, you are right; that is the way I should have put it.
    0 0
  10. Again, Arkadiusz Semczyszak, you are mistaken. If you take a look at the GISS data, you'll see there is a very good relationship between the apex & nadir of each solar cycle & the warmest & coolest years within that cycle. Even if that were not so, the 2000-2009 portion of the current cycle was by no means normal-its the deepest solar minimum in over a century-& it lasted around 4 years-yet still temperatures moved generally upwards. Lastly, it doesn't alter the fact that, beyond the normal cycles, solar activity has been trending downward for the last 30 years, yet temperatures have been trending upwards over this same time period. I've seen several papers which conclude that the correlation between solar activity & deltaT ceased at least as early as 1979 & possibly as far back as 1950.
    0 0
  11. I just realized what the correct rebuttal is to people who choose short recent time periods and say things like "you can't reject the null hypothesis, so there's no statistically significant warming". Here's the thing. The upward linear trend since the mid 70s (30+ years) is known and is easily shown to be statistically significant. So the null hypothesis for short time periods near present is "that rate of warming continues". And guess what? There is no cherry pick that will allow anyone to reject *that* null hypothesis. We can easily quantify what it would take to reject continued warming. When that condition is met (and I'm not expecting it) then climatology would have some 'splaining to do. But only then, and it sure isn't likely.
    0 0
  12. That's a very good point, GFW. Perhaps Phil Jones, in his reply, should have said "there is no statistically significant change from the previously established warming trend". Easy to second-guess in hindsight, though, isn't it?
    0 0
  13. As Joe Romm puts it the problem is in the question, something like asking "are you still beating your wife?". If you by instinct answer "no, of course" you're admitting that once you did. Tamino gives another example. You have been measuring a child's height for years to follow his growth. If asked if you can prove that there has been a stistically significant growth in the last week you have to say no, so the child is not growing any more. What i want to say is that there is no meaningfull answer to a meaningless qustion but reformulating it.
    0 0
  14. argh ... "statistically significant growth"
    0 0
  15. Tobjoyce@53 says: "Statistical significance is given usually as a p-value which is the probability that the data occurred by chance alone." no! The p-value is the probability of observing a statistic as extreme as that observed, assuming the null hypothesis is true, by chance in a large number of independent replications of the experiment. That is not the same as the probability that *this* data occurred by chance (as that would be the probability that the null hypothesis is true). Indeed frequentist approaches fundamentally can't answer such questions, they can only make statements about things like the proportion of events of a particular nature in a large number of replications of an experiment. There is nothing wrong with that per-se, but it is important to view the result of the test within the statistical framework in which was conducted, or misunderstandings will arise. JonMoseley (3) made essentially just that error, treating the lack of statistical significance as demonstrating the null hypothesis to be true (or at least highly likely to be true), and then mistakenly claiming that the models were wrong for not also supporting the null hypothesis (not that he was right about that either). Anyway, don't listen to me, I am a Bayesian so I may have strong prior beliefs about frequentist significacnce testing! ;o)
    0 0
  16. Tamino on OpenMind did a post on how much time was needed to establish a trend from GISS data. Tamino really knows his stuff! http://tamino.wordpress.com/2009/12/15/how-long/
    0 0
  17. theendisfar, please follow the comment policy: "No off topic comments. Stick to the subject at hand. If you have something to say about an unrelated topic, use the Search form in the left margin to find the appropriate page."
    0 0
  18. In comparing data, article states: "the areas omitted by HadCRUT are some of the fastest warming regions in the world" If this is about detecting "global" warming, why does regional warming even enter into the equation? If taking "proxy" CO2 measurements from a volcano in Hawaii makes sense, why not apply the same idea for measuring temperature? PS Addressing JonMoseley's comment "To be valid science, one must state that a measurement that is not statistically significant is equivalent to ZERO." Agreed. And personally, with all these spots on communication blunders, one notices that its the reader or audience that is always portrayed as at fault for not understanding or misinterpreting explanations.
    0 0
  19. RSVP, it is called global warming becasue it is, well, global. This means the any region of the planet counts proportionally to its area; if it's large it will have a relatively large effect, if it's small it will be small. As easy as the definition of average. If the Earth was like Venus the temperature would have been "well mixed" like CO2 and we could have implemented just one station at Mauna Loa or anywhere else. Unfortunately (or maybe luckly ;)) it is not, so the tempeature at one single point tells nothing about the global average.
    0 0
  20. RSVP, obviously CO2 and temperatures are different things and behave in different ways. For CO2 what is being measured is effectively the 'baseline' CO2 level... there are actually higher levels of CO2 downwind of industrial centers all over the world, but by the time winds would carry that CO2 to Mauna Loa (or any of the other remote measuring stations) the CO2 has diffused throughout the atmosphere and you are looking at effectively the MINIMUM value worldwide... which is why the different stations get matching values. For temperatures on the other hand there is no 'global minimum' which can be consistently detected at specific points. Instead, the global temperature values we get are 'averages' computed by taking readings at thousands of sites around the world and applying them geographically. In theory CO2 levels could similarly be computed as a global average in the same way that temperature is. This would result in values slightly higher than the baseline figures currently used. However, it would also require alot more monitoring stations and be subject to greater potential for error.
    0 0
  21. RSVP (69) Jon Moseley's comment demonstrated a common fallacy in interpreting the result of a frequentist hypothesis test. Being unable to reject the null hypothesis is not the same as showing the null hypothesis to be true. Absence of (compelling) evidence is not (compelling) evidence of absence. Here are some musings on the way this misunderstanding arises: The way published research should proceed is very much the same way a good chess player plays chess. A weak chess player will simply play the most promising move he sees, without really considering his opponents reply. A good chess player on the other hand plays the strongest move he can find that his opponent can't counter. Likewise a good scientific paper doesn't advance a strong claim that is not solidly supported by the data. In this way the paper is likely to result in scientific progress as it can't be easily refuted. A good scientist therefore makes the strongest claim that he considers to be irrefutable, rather than the strongest claim that merely *could* be supportable given the evidence. So like chess it is a min-max game. Thus we are INITIALLY taught to treat statistically insignificant results as "being equivalent to ZERO" as a guard against making any claim based on statistically insignificant evidence (and indeed Jones does not). As a first approximation, that is reasonable, however once your education progresses to the point where the principles of hypothesis testing, rather than simply the practice, are better understood, it becomes clear that this is just an approximation, and the meaning of the p-value is actually rather subtle (and doesn't really answer the question you thought you were asking, at least that is the Bayesian position). However that is how we should treat the evidence for OUR claims, not how we should treat the evidence for the claims of OTHERS we would like to REFUTE, as it is a min-max game for both sides. So while "is equivalent to ZERO" is a reasonable maxim if we apply it to our own claims, it is a very poor maxim for refuting the claims of others as instead of the difference between maxim and truth being a useful safeguard, it becomes a fallacy. The reason that the reader or audience is portrayed as being at fault for not understanding or misinterpreting explanations is because of the Dunning-Kruger effect discussed on a previous thread sadly means it is often true. The impression is given by posters and/or journalists that make strong claims, quite obviously on the basis of a very shaky understanding of the facts. Were they to post questions asking for explanations of claims, rather than make easily refuted counter claims, and be open to the responses, the portrayal would not have resonance that it currently does.
    0 0
  22. RSVP: [i]PS Addressing JonMoseley's comment "To be valid science, one must state that a measurement that is not statistically significant is equivalent to ZERO." Agreed. And personally, with all these spots on communication blunders, one notices that its the reader or audience that is always portrayed as at fault for not understanding or misinterpreting explanations. [/i] By that logic, we would have "science" declaring the trend is zero one month, and, for example, 0.15 the next month, because the trend persisted, but p-value moved from 0.0505 to 0.0490. Of course that is not the way we work in science, and I don't really understand where you have got these notions from. Except for them fitting very well in a denialist "paradigm". When we look at temperature trends, for example in the UAH series, we extend it backwards till we eventually can get some stability (we do), and then, using it as a raw estimate, check for significance. With the current level of fluctuations, we typically need more than 15 years to be sure. The stability is essential, otherwise we could talk about "significant cooling" every winter. It surely is significant where I live, but that has got nothing to do with climate. I have no problems accepting the possibility of global cooling, if you present stable and sigificant cooling trends for me. But it seems to be vary hard for many self-declared "skeptics" to accept the possibility of global warming, in spite of very stable warming trends. That's the difference between skepticism and denialism. I also wonder if a number of people are somewhat logically challenged, as they tend to take over-estimations of warming as "proof" that warming doesn't happen. Or failure of models to correctly predict the processes going on as "refutations of AGW". You can die from a gunshot regardless of the people involved in the incident having a correct understanding of the trigger mechanism or not.
    0 0
  23. CBDunkerson Sometimes it takes questions like this to realize how differently people can be thinking. My thinking is that since energy can't be destroyed, heat from warmer regions (cities for instance) makes its way around the planet contributing to an overall global warming effect. This explains my question about why not sample temperatures as is done for CO2. There is of course the upward IR ratiative cooling path to consider. If this path dominates, and basically "shorcircuits" any convective heating, local temperature increases wouldnt represent global warming at all, but instead isolated regional warming which would be completely dependent on the amount of energy discharged locally. It would seem therefore, that the only global warming that really matters, is that which is associated with measurements in locations that are far from human populations. The problem of course is that when making historical comparisons, a lot of the data has likely been taken from areas that have since become part urban sprawl.
    0 0
  24. SNRatio "Of course that is not the way we work in science, and I don't really understand where you have got these notions from." Answer. Maybe engineering. People who build the equipment you guy use.
    0 0
  25. Wow this site is getting loads of comments these days. Deservedly so. The only significance of the question was how transparently, carefully, chosen it was to provide the answer required. But Prof Jones answered correctly, even if it was a bit of a trap. Those with more than one brain cell to rub together will appreciate the "significance" of his full answer.
    0 0
  26. Mr John Cook: Could you show the RSS and UAH lower troposphere data to compare it with the hadCRU and GISSTEMP data? And also show the MONTLY and 12-month moving average of all of them? Seeing the trends and variability of all our surface temperature metrics will be a great thing. Specially the LOWER TROPOSPHERE vs. SURFACE temperature trends!
    0 0
  27. This is a great article. I am glad Phil Jones is getting some answers into print. Actually I think he chose his words very carefully and well. The tone of his points is right - being a scientist means having doubts and being skeptical. While some of the things might be seized on by whatever camp it is good for science to show what is known and what is not.
    0 0
  28. RSVP, the energy generated by a city is absolutely minuscule in comparison to the energy of the solar radiation hitting that city... and the entire rest of the planet. Further, cities are not 'warmer regions' of the planet. They often (not always) tend to be slightly warmer than their immediate local surroundings due to lower albedo of asphalt and other factors, but this is nothing compared to places like Death Valley or the Gobi Desert. Thus, viewing cities as the 'source of heat' spreading around the planet, as with CO2, is incorrect. The heat contribution from cities directly is tiny compared to solar energy, greenhouse effects, and hydrological effects (i.e. heat going into or coming out of the oceans due to weather). With CO2 isolated sites like Mauna Loa, American Samoa, Barrow Alaska, and the South Pole all show the same results... but temperature series taken at those locations would be completely different.
    0 0
  29. From Peru @ 77 woodfortrees.org is a great site for generating plots for yourself, just the way you want them. For instance, here is the HADCRUT data from 1979 onwards, including the monthly data, 12 year running mean and the 1979-present trend. http://tinyurl.com/yf8729r The trends for RSS, HadCrut and GISSTemp are all very similar, the UAH one a bit less, but basically the surface trends look like they are in reasonable agreement with the satelite trends. A woodfortrees plot is available here, I have alterered the baselines to make the difference in trends easier to see (but the trends themselves are unaffected by the baseline) http://tinyurl.com/yh2vn4n woodfortrees is a great site, I recommend anyone interested in climate science to use it to test out what they read on the blogs. HTH
    0 0
  30. 75, RSVP "SNRatio "Of course that is not the way we work in science, and I don't really understand where you have got these notions from." Answer. Maybe engineering. People who build the equipment you guy use. " So then, when there is a 94% chance a part is faulty, you say "no fault" because the null hypothesis of "ok" can not be rejected? That may actually explain a lot, but most engineers know better, and work mostly with confidence intervals when presented with estimation problems of the type we discuss here. And when they do tests, they care about the power. You are insisting on methods that cannot detect a 0.12 degC/decade warming trend. In a climatic context, that's insisting on blindness. But it is a strategy used to conceal facts: Running tests with too low power to detect effects, and with experiment repetitions that, like short time temperature series, tend to go both ways. "There is no effect."
    0 0
  31. CBDunkerson "the energy generated by a city is absolutely minuscule in comparison to the energy of the solar radiation hitting that city... and the entire rest of the planet. Further, cities are not 'warmer regions' of the planet. They often (not always) tend to be slightly warmer than their immediate local surroundings due to lower albedo of asphalt and other factors, but this is nothing compared to places like Death Valley or the Gobi Desert. " The only source of global warming of concern (I thought) is that which precisely comes from humans. That of Death Valley or Gobi Desert have been around for ever and are not considered incremental. What you just referred to as lower albedo due to asphalt is precisely manmade solar energy being trapped that would otherwise not exist. Conbustion energy is also man-made. For these reasons cities are warmer.
    0 0
  32. RSVP said:
    What you just referred to as lower albedo due to asphalt is precisely manmade solar energy being trapped that would otherwise not exist. Conbustion (sic) energy is also man-made. For these reasons cities are warmer.
    Please go and read the Dunning Kruger thread. What you have just posted is absolute nonsense and shows that you know next to nothing about AGW.
    0 0
  33. RSVP, the amount of energy which is received by Earth-from the Sun-every year is 3.8 million *exajoules*. The total amount of energy generated from *all* human sources in a year is about 600 exajoules. So you see that your claim that our piddling thermal contribution is significant enough to warm the entire planet is like me saying that-if I pee in the ocean, it will turn yellow. No, where humans are impacting on global temperatures is on how quickly & easily *all* the planet's outgoing radiation can be re-emitted back out to space. In that regard, our contribution is *very significant*.
    0 0
  34. Wow, #82 by RSVP really does show a complete lack of background knowledge. It's like when you enter 'chat' in some online video game and then suddenly realize the other person must be 13 or so. For the record RSVP, laying asphalt and emitting CO2 have the following similarity - both trap more of the incoming energy from the sun, increasing surface temperature. But the asphalt only does so over the area it is laid. The CO2 does it over the whole planet, and is the greater total effect by far. Your phrase "manmade solar energy being trapped that would otherwise not exist" is completely mixed up. (Is English your main language?) The correct thing to say about asphalt is "natural solar energy being trapped that would otherwise have been reflected back into space" Read the wikipedia article on urban heat islands. It's very clear that albedo, both in terms of the dark surfaces, and the geometry of the surface "urban caynon effect" is the main driver of UHI. Direct heating from human use of energy is less important. In other words, if you did an experiment where all the inhabitants of New York left the city for a year, it would still be an urban heat island while they were gone. As impressive as the UHI effect can be, not enough of the planet's surface is affected for UHI to make any noticeable contribution to global warming. Only truly global changes (like CO2) can cause that.
    0 0
  35. Another point, RSVP, is that though base temperatures of cities might be warmer than their surrounding rural environments (by anywhere up to 1 degree C), there is absolutely *no sign* that cities are warming any faster-above that base-than the surrounding rural area. Indeed, if urban heat were the primary source of global warming, then the inversion layer/urban heat island should ensure that urban areas warm significantly faster than their surrounds. Yet this is clearly *not* the case. Many remote, rural areas are warming significantly faster than the nearest cities, which suggests a much less localized source of warming.
    0 0
  36. One last comment on statistical significance, a more frequentist colleague kindly let me borrow his copy of "Statistical Inference" by Garthwaite, Joliffe and Jones (ISBN 0-13-847260-2), which says on page 72: "A related point is that rejection of H0 [the null hypothesis] implies a degree of disbelief in H0, but 'acceptance' of H0 simply means that there is little evidence against H0 and does not rule out other hypotheses. 'Failure to reject' is a better term than 'acceptance'" Of course if you cherry pick the start date then the hypothesis test is invalid in the first place as you have already looked at the data to select a period where the data don't supply sufficient evidence to reject the null hypothesis. Most of the "global cooling since X" or "lack of warming since X" are based on such cherry picking, for instance X is often 1998 or 2002, but not 2000. The reason why is fairly obvious. I suspect that 1995 was chosen as it is the earliest start date for which there is insufficient evidence to reject the null hypothesis; in which case it is in the same category. Phil Jones should be applauded for giving a straight scientific answer to the question without a trace of spin; that was left to the journalists to supply ;o)
    0 0
  37. Ian Forrester at 10:14 AM on 18 February, 2010 "What you have just posted is absolute nonsense and shows that you know next to nothing about AGW." Why are you so selective about what is causing global warming? Are you saying that an asphalt parking lot laid on a green pasture is helping cool the earth? What about all the water vapor that comes from combustion? When burning methane for instance, you get twice as much water vapor as CO2. Even if you assume a shorter lifetime of water vapor as compared to CO2, the immediate presence of the extra water vapor must be factoring into the current temperature readings, in which case, CO2 is having less impact than is assumed.
    0 0
  38. Marcus "the amount of energy which is received by Earth-from the Sun-every year is 3.8 million *exajoules*." Please see this article... http://www.skepticalscience.com/CO2-is-not-the-only-driver-of-climate.html There is no vector that takes into account the absolute amount of solar radiation. Not sure why you are making this comparison. From my understanding, AGW is only due to imbalances set up by humans.
    0 0
  39. RSVP, 89: "What about all the water vapor that comes from combustion? When burning methane for instance, you get twice as much water vapor as CO2. Even if you assume a shorter lifetime of water vapor as compared to CO2, the immediate presence of the extra water vapor must be factoring into the current temperature readings, in which case, CO2 is having less impact than is assumed. " Perhaps you should look at and compare the long-time effects on atmospheric concentrations of water vapor and CO2 released at the surface. You might learn why treating water vapor so differently from CO2, though they have overlapping effects, is not such a hopeless idea after all. But if you had objected to the way water vapor is treated in climate modeling today, I might tend to agree with you.
    0 0
  40. RSVP @ 90 The reason there is so much focus on CO2 is that it is a factor that is actually under our full control and because it is a long-lasting greenhouse gas. If we were to stop fossil fuel use tomorrow the effects of any associated water vapour would only last a matter of a few days, whereas the (elevated levels of) CO2 would be around for at least 50-250 years. The climatologists do know water vapour is a GHG, their knowledge of its interaction with other forcings and feedbacks is still rather uncertain, hence the variation in elements of climate sensitivity. But the projections made by the modellers do include such factors (even if they are only a work in progress). Ultimately the fact that so much of the discussion revolves around CO2 is not because it is the only forcing worth talking about and the others can be ignored. It is because it is the forcing of the greatest practical importance.
    0 0
  41. Wow, RSVP, way to sidestep the entire point of my previous comment. My *point*, if you were paying any attention, is that the amount of direct energy from the sun utterly dwarfs the very minuscule energy produced directly by human activity. Similarly, the amount of water vapor generated by human activity is utterly dwarfed by the amount of water vapor traveling through the atmosphere due to evapo-transpiration. Lastly, the quantity of water vapor required to enhance the greenhouse effect is more than 10 times greater than the quantity of CO2 needed to enhance the greenhouse effect by the same degree (& methane is 8 times more potent than CO2, so turning methane into CO2 & water has a net *negative* impact on radiative forcing). As much as you try & squirm, RSVP, the reality is that the only thing we're adding significantly to is atmospheric concentrations of CO2, NO2 & methane-all potent trappers of long-wave radiation & all capable of increasing the energy imbalance within our atmosphere. To try & shift the blame to our absolutely minuscule direct heat signature really displays an amazing lack of knowledge of the underlying science of energy budgets, radiative forcing & the like. I'm certainly no expert, but I suspect I'm more up-to-date than yourself!
    0 0
  42. RSVP ... "What about all the water vapor that comes from combustion? When burning methane for instance, you get twice as much water vapor as CO2. Even if you assume a shorter lifetime of water vapor as compared to CO2, the immediate presence of the extra water vapor must be factoring into the current temperature readings, in which case, CO2 is having less impact than is assumed." Do you have any idea how miniscule an amount this additional water vapor is? Tropical air can contain up to 30,000 ppm water molecules in the form of water vapor. CO2 is around 380 ppm. A quick look in google would seem to indicate that air over dense urban areas can contain an extra 20-40 or so ppm CO2 (there's one reference that talks about a 100 ppm bump but that's right next to a heavily-used freeway in Dallas). The number of H2O molecules from combustion of gasoline is almost exactly the same as the number of CO2 molecules. Miniscule. As far as heat from combustion, mechanical friction in machines driven by combustion, etc ... it's computable. It's been looked at. Science is by its very nature anal. It's an extremely tiny fraction of the forcing that results from the CO2 emissions associated with that combustion, though I'm not in the mood to google it *again* (this question gets asked a lot) .
    0 0
  43. It seems the more interesting question the BBC asked Jones about the recent (i.e., 150 years) global record: Question: "Do you agree that according to the global temperature record used by the IPCC, the rates of global warming from 1860-1880, 1910-1940 and 1975-1998 were identical?" Jones: "An initial point to make is that in the responses to these questions I’ve assumed that when you talk about the global temperature record, you mean the record that combines the estimates from land regions with those from the marine regions of the world. CRU produces the land component, with the Met Office Hadley Centre producing the marine component. Temperature data for the period 1860-1880 are more uncertain, because of sparser coverage, than for later periods in the 20th Century. The 1860-1880 period is also only 21 years in length. As for the two periods 1910-40 and 1975-1998 the warming rates are not statistically significantly different (see numbers below). I have also included the trend over the period 1975 to 2009, which has a very similar trend to the period 1975-1998. So, in answer to the question, the warming rates for all 4 periods are similar and not statistically significantly different from each other." In other words, Phil Jones (who strongly believes in the AGW hypothesis) thinks there is nothing unusual about the recent warming. It is not statistically different from two earlier modern periods of warming. Since these warming periods were before the modern rise in CO2, greenhouse gases cannot have been responsible for those rises. This raises the more important question: where is the warming anomaly? Jones' answer is -- there is NO unusual warming. There is no anomaly. There is nothing strange or out of the ordinary about the recent warming. It is in no way distinguishable from earlier periods of warming, periods that we know were not due to rising CO2. There is nothing in the record that is in any way different from the centuries-long natural fluctuations in the global climate. SOURCES: CET: http://hadobs.metoffice.com/hadcet/data/download.html ARMAGH: http://www.arm.ac.uk/preprints/445.pdf ADJUSTMENTS TO THE CET: http://www.anenglishmanscastle.com/archives/004482.html JONES BBC INTERVIEW: http://news.bbc.co.uk/2/hi/science/nature/8511670.stm Jones also makes the interesting argument in the interview that the reason he believes that recent warming is anthropogenic (human-caused) is because climate models CANNOT replicate it. In other words, he seems to be admitting that he has absolutely no evidence at all, he just has the undeniable fact that our current crop of climate models can’t model the climate. All this is just one climate scientist's assessment, but given Dr. Jones's stature, he can't easily be ignored.
    0 0
  44. libertarianromanticideal, the fact that the 1910-1940 temperature increase is similar in magninute to the 1975- warming does not mean it is not unusual in the cause. Indeed, any climate scientist would aknowledge that a good part of the early 20th warming is not due to GHG. Your claim is highly misleading and you should not put your words in Jones mouth. You are making (unwillingly, i guess) the case for scientists not to talk with interviewers, a really bad thing to do. The language is different and words sometimes have different meaning; we need to put some effort into understanding it. Whenever we do not have direct access to a physical quantity (almost always indeed) we need to model the relation between that physical quantity and something we can measure. Even to measure temperature with a mercury thermometer we need to model thermal expansion and then measure a distance. Like it or not, physics IS a model of the real world. With this premise, a model is, for example, that the sun warms the earth through EM radiation and the average temperature of our planet is given (roughly) by its thermal equilibrium. A quite crude model, indeed. Then, of course, you might want to take all the other factors affecting earth's climate into account. By doing this we can confidently rule out natural contrubution to warming as the leading factor from about the '70s on. Do we now what the futture will be? No of course, no one can prove that, say, the sun will not abnormally increase or decrease its radiance overwhelming any anthropogenic contribution. But no one can prove the opposite as well. So we should, as humanity always did, stick to our "model of the real world", aka known physics.
    0 0
  45. The causes of warming in the early 20th C are pretty well understood. Part of the warming then was also due to fossil fuels, but a significantly smaller part than modern warming. There was also a small contribution from increasing solar irradiance (as opposed to the past couple of decades when TSI has been decreasing) and from a temporary lack of volcanic forcings. I think most climate models handle the pre-1940s warming pretty well. It's rather silly to point to previous episodes of warming climate and say "See, it's warmed before, so the current warming must be natural!" That's an obvious logical fallacy, like saying that since some fires are caused by lightning no fires must be caused by arson. There's really no way to explain the past 3-4 decades of warming without CO2 and other GHGs. More importantly, unless we start moving towards a non-carbon-centric energy infrastructure, there's going to be a lot more warming over the 21st C.
    0 0
  46. libertarianromanticideal @ 93 says: "In other words, Phil Jones (who strongly believes in the AGW hypothesis) thinks there is nothing unusual about the recent warming." No, that is not correct, there is nothing unusual about the magnitude of the trend, but that doesn't mean there is nothing unusual about the warming. For a start there is the fact that solar and volcanic forcing cannot explain the recent warming, unlike the other periods mentioned. This sort of thing is a good example of why scientists are on a hiding to nothing discussing science in the media. In this case Jones has answered every question in an admirably scientific manner, with no spin and happy to discuss the uncertainties involved. However that leaves room for his words to me manipulated, misquoted and misinterpreted. If on the other hand they use less scientific language that puts across the message, then they are criticized for undue certainty, and spin! "It is not statistically different from two earlier modern periods of warming. Since these warming periods were before the modern rise in CO2, greenhouse gases cannot have been responsible for those rises." However it would be a fallacy to suggest that just because the previous episodes of warming were not due to CO2 then the current one can't be due to CO2 either. "This raises the more important question: where is the warming anomaly?" Clearly displayed on temperature records, see e.g. woodfortrees.org "Jones' answer is -- there is NO unusual warming. There is no anomaly. There is nothing strange or out of the ordinary about the recent warming." He said nothing of the sort. "It is in no way distinguishable from earlier periods of warming, periods that we know were not due to rising CO2." There is a way to distinguish them, the previous episodes accompanied changes in solar and volcanic forcing. "There is nothing in the record that is in any way different from the centuries-long natural fluctuations in the global climate." That would only be true if we only had records of temperatures, and no records of volcanic and solar activity, and other sources of external forcing. "Jones also makes the interesting argument in the interview that the reason he believes that recent warming is anthropogenic (human-caused) is because climate models CANNOT replicate it. " That is not correct, he made no mention of models, he did mention chapter 9 of the IPCC report ("understanding and attributing climate change"), which does involve models, but is also based on a wide range of other evidence. "In other words, he seems to be admitting that he has absolutely no evidence at all, he just has the undeniable fact that our current crop of climate models can’t model the climate." Again, he said nothing of the sort. He did mention volcanic and solar forcing would suggest a cooling over the period considered, but you don't need a computer model to tell you that, just an understanding of the physics built into those models. If solar activity has not been increasing, you don't need to be Einstein to draw the conclusion it probably isn't the cause of rising temperatures. CO2 on the other hand is known to be a greenhouse gas, something that was known before electronic computers capable of running climate simulations were invented. "All this is just one climate scientist's assessment, but given Dr. Jones's stature, he can't easily be ignored." the irony! Phil gave a perfect example of how a scientist should answer questions, directly and without spin. If only the climate debate in general could be conducted in that manner!
    0 0
  47. Can I try and clarify for the non-statisticians the importance, or otherwise, of statistical significance. Statistical significance, in the current context, means that 95% of the time we can be satisfied that our trend is valid. The uncertainty lies in the fact that we are not looking at all possible data, either because we do not have it, or because we are choosing a subset. As Jones says, the longer the period we are looking at data, the more certain we can be that trend is meaningful, and the less stringent the significance level has to be. Lack of statistical significance can be overcome by choosing a lower significance level. For example, at the 90% level, we can say that trend is valid 90% of the time. Obviously, lower values of trend will meet this weaker test. So, statistical significance is a statistical artifice, a means of measuring uncertainty. Lack of it does not mean a physical relationship does not exist, in this case rising trend, just that it does not pass the chosen test level. This is a major weakness of statistical relationships, particularly over a short period of time.
    0 0
  48. There seems to be a number of mistakes journalists make in reporting on this issue. 1. Understanding that 'no statistical difference' can reflect on either the data available or the underlying phenomena ... and Phil Jones made it clear that it is due to the limited amount of data available. 2. Understanding that science is never 'settled', it is always conditional (as Mike Hulme is particularly keen to argue). 3. Having a good appreciation of what constitutes good evidence for / against climate change. 4. Understanding the way major scientific debates are conducted & the strong emotions it can evoke (e.g. as Darwin's ideas did in the 1860s) In Canada, the journalist, Margaret Wente makes a number of these mistakes (IMHO) in this article in the Globe and Mail http://www.theglobeandmail.com/news/opinions/the-science-isnt-settled-now-what/article1469050/
    0 0
  49. George Will is at it again. Ugh. "Global warming skeptics, too, have erred. They have said there has been no statistically significant warming for 10 years. Phil Jones, former director of Britain's Climatic Research Unit, source of the leaked documents, admits it has been 15 years. " http://www.washingtonpost.com/wp-dyn/content/article/2010/02/19/AR2010021903046.html
    0 0
  50. Dude, This is the worst argument that you have ever made. First, the significance of Jones statement is that you cannot, scientificly, make the conclusion that there has been heating from 95-2009. That is scientific fact. This is in direct conflict with the fact that CO2 rates have continued to rise in that same time frame. Second, what is with this Heat Content argument? It is nothing more than a distraction. The orginal premis of the whole global warming "problem" is based on temperatures that will continue to rise, and this is not the same as heat content rising. If I have a pot of cold water, and supply it with a temperature of 101 C. the pots heat content will continue to rise, but the applied temperature stays the same.
    0 0
    Response: I have to disagree with you there - I've made worse arguments on several occasions (finding those instances I leave as an exercise to the reader).

    I go into more detail about why heat content is a more appropriate metric for measuring global warming than surface temperature on the global cooling page. The land and atmosphere are only one small fraction of the Earth's climate (albeit the part we inhabit). Global warming is by definition global. The entire planet is accumulating heat due to an energy imbalance. The atmosphere is warming. Oceans are accumulating energy. Land absorbs energy and ice absorbs heat to melt. To get the full picture on global warming, you need to view the Earth's entire heat content.

    That's not to say surface temperature is unimportant. But by looking at surface temperature in proper context, you can see why it shows so much variability - it is a small part of a climate which exchanges heat between its various components such as the ocean exchanging heat with the atmosphere. We mustn't forget that global warming isn't just about graphs and statistics - it's the physical reality of the planet steadily accumulating heat due to an energy imbalance.

Prev  1  2  3  Next

You need to be logged in to post a comment. Login via the left margin or if you're new, register here.


The Consensus Project Website

THE ESCALATOR

(free to republish)


© Copyright 2024 John Cook
Home | Translations | About Us | Privacy | Contact Us