Climate Science Glossary

Term Lookup

Enter a term in the search box to find its definition.

Settings

Use the controls in the far right panel to increase or decrease the number of terms automatically displayed (or to completely turn that feature off).

Term Lookup

Settings


All IPCC definitions taken from Climate Change 2007: The Physical Science Basis. Working Group I Contribution to the Fourth Assessment Report of the Intergovernmental Panel on Climate Change, Annex I, Glossary, pp. 941-954. Cambridge University Press.

Home Arguments Software Resources Comments The Consensus Project Translations About Support

Bluesky Facebook LinkedIn Mastodon MeWe

Twitter YouTube RSS Posts RSS Comments Email Subscribe


Climate's changed before
It's the sun
It's not bad
There is no consensus
It's cooling
Models are unreliable
Temp record is unreliable
Animals and plants can adapt
It hasn't warmed since 1998
Antarctica is gaining ice
View All Arguments...


Username
Password
New? Register here
Forgot your password?

Latest Posts

Archives

What would happen if the sun fell to Maunder Minimum levels?

Posted on 19 February 2010 by John Cook

The sun's output is not static - it varies over a 11 year cycle and also shows long term changes. Currently, the sun is beginning to come out of a prolonged and deep solar minimum. This has led some to speculate that the sun might be entering a period of low solar activity similar to the Maunder Minimum in the late 17th century. At that time, the planet experienced markedly lower temperatures, particularly in the Northern Hemisphere. How would the Earth's climate respond if the sun did enter another Maunder Minimum? This answer is explored in a new paper On the Effect of a New Grand Minimum of Solar Activity on the Future Climate on Earth (Feulner & Rahmstorf 2010).
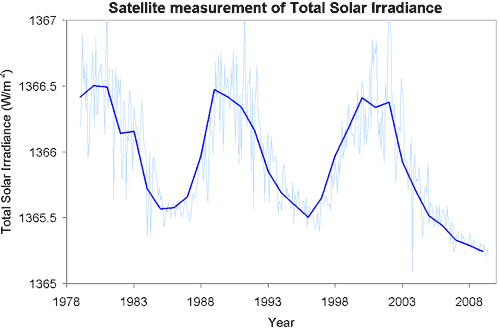
Total Solar Irradiance measured by satellite, PMOD reconstruction
Figure 1: Satellite measurements of Total Solar Irradiance (TSI), reconstructed by PMOD. Light blue thin line shows monthly values, dark blue thick line shows yearly averages.

The paper uses a fully coupled climate model to simulate what would happen if the sun fell to Maunder Minimum levels in the 21st Century. To include the effect of greenhouse gas emissions, they assume either A1B or A2 scenarios (IPCC TAR). A1B is a more optimistic scenario where carbon dioxide emissions continue to rise in the early 21st Century, stabilise mid-century then fall in the latter-21st Century. A2 is somewhat more pessimistic, projecting carbon dioxide emissions to continue growing throughout the 21st Century. To factor in the influence of volcanoes, 20th Century eruptions are randomly distributed over the 21st Century. This is necessary to avoid artificial drift of the model from an unnatural lack of volcanic forcing.

Two methods are used to determine how low total solar irradiance (TSI) fell during the Maunder Minimum. Ice core measurements of beryllium indicate a less variable TSI while modelling from solar magnetic flux show a greater decrease in TSI during the Maunder Minimum. To check whether the climate model accurately responds to solar forcing, global temperature was modelled over past periods of Grand Minima such as the Maunder and Dalton Minima. The TSI reconstruction with lower variation shows excellent agreement with reconstructed past temperatures while the model results from the more variable TSI give cooler results. This suggests the TSI reconstruction with less variability is more accurate although both reconstructions are still used.

Three solar scenarios are modelled. One repeats the last 11-year solar cycle until 2100 (eg - no long term change in solar activity). The other scenarios involve the sun entering a new Grand Minimum using the TSI reconstructions with less and greater variation. The results are shown in Figure 2. The magenta lines are for the A2 emission scenario, the red line for the A1B scenario. The important feature is the comparison between the solid line (with no solar change) to the dotted and dashed lines (the two Maunder Minimum scenarios).
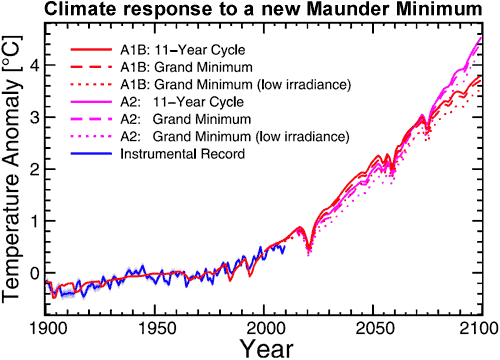

Figure 2: Global mean temperature anomalies 1900 to 2100 relative to the period 1961 to 1990 for the A1B (red lines) and A2 (magenta lines) scenarios and for three different solar forcings corresponding to a typical 11-year cycle (solid line) and to a new Grand Minimum with solar irradiance corresponding to recent reconstructions of Maunder-minimum irradiance (dashed line) and a lower irradiance (dotted line), respectively. Observed temperatures from NASA GISS until 2009 are also shown (blue line) (
Feulner 2010).

For both the A1B and A2 emission scenario, the effect of a Maunder Minimum on global temperature is minimal. The TSI reconstruction with lesser variation shows a decrease in global temperature of around 0.09°C while the stronger variation in solar forcing shows a difference of around 0.3°C. Compare this to global warming between 3.7°C (A1B scenario) to 4.5°C (A2 scenario). Considering the less variable solar reconstruction shows such strong agreement with past temperature, the authors conclude the most likely impact of a Maunder Minimum by 2100 would be a decrease in global temperature of 0.1°C . With all uncertainties taken into account, the estimated maximum decrease in global temperature is 0.3°C.

To understand why solar influence is so small, it's helpful to compare the radiative forcing from a cooling sun to the radiative forcing from anthropogenic greenhouse gases. The solid green cycle shows solar forcing with no long term change. The dashed green line is the change in solar forcing if we fall to Maunder Minimum levels using the TSI reconstruction with smaller variation. The dotted green line shows Maunder Minimum forcing from the TSI reconstruction with greater variation. The red and magenta lines show the forcing from anthropogenic greenhouse gases for the two different emission scenarios.
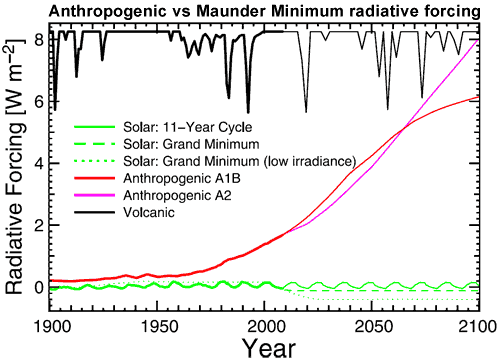

Figure 3: Radiative forcings used in the simulation experiments, with observed values until 2008 marked by thick lines. Volcanic radiative forcing (the downward spikes at the top of the graph) has been shifted by +8:25 W/m2 for clarity (Feulner 2010).

Both solar reconstructions show the weak forcing from solar changes compared to the forcing from anthropogenic greenhouse gases. It also bears reminding that any offset from a solar Grand Minimum would be temporary as past minima only lasted a few decades to a century. This means the impending ice age is still postponed indefinitely

0 0

Printable Version  |  Link to this page

Comments

Prev  1  2  3  Next

Comments 51 to 100 out of 108:

  1. I've just figured it out. It'll be a randomly placed volcano.
    0 0
  2. #0 Posted by John Cook at 14:14 PM "it's helpful to compare the radiative forcing from a cooling sun to the radiative forcing from anthropogenic greenhouse gases" No, it is not. The very concept of "forcing" is flawed. Different kinds of "forcings" act on different parts of the climate system, so they are NOT interchangeable (even if they happen to have the same number as expressed in W/m2). CO2 makes stratosphere colder, increased solar activity (20% more UV) makes it hot. Forget about forcing as a unified concept, please. Also, it does not make much sense to use models to predict the long term effect of some input variable if those very models are proven lacking in postdiction. Also, recent "global warming" is a myth. To illustrate this proposition, consider the following graph: http://kign.org/Northern_hemisphere_temperature_anomaly.jpg I have pulled global land surface data from ftp://ftp.ncdc.noaa.gov/pub/data/ghcn/v2/ and did some rather obvious things to it. Anyone can replicate. 1. selected northern hemisphere stations (82% of all) 2. considered temperature data for each month separately 3. used only uninterrupted series at least 20 years long, with no data missing 4. computed least square linear fit for all such 20 years interval 5. assigned slope to mid-year of 20 years run 6. averaged slopes for each (year;month) pair over set of stations 7. integrated slopes backwards in time, getting temperature anomalies relative to present Findings: 1. No warming for summer since mid thirties of last century. In fact, there is a 0.2°C/century cooling trend. 2. No warming for July. In this case the cooling is 0.6°C/century. 3. Springtime warming stopped in mid eighties 4. Only winters are getting consistently warmer, even this trend is flatting out recently (since 1995) 5. Otherwise annually averaged temperature anomaly trend looks like advertised The findings are robust. 1. Have not made any adjustment for UHI (Urban Heat Island) effect. Warming is overestimated. 2. Gregorian calendar effect is not corrected for. Since 1900 spring equinox is moving to ever earlier dates which introduces a spurious springtime warming trend. It will be reset only in year 2100 with no 29 February in that year. If anything, northern hemisphere climate is getting milder during last century, winters less cold, summers cooler. Exactly the pattern leading to long term ice sheet buildup, new glacial period coming. GHCN data go back to mid eighteenth century. It is not shown on graph (more cranky, wider margins of error), but looks like winters were even colder back then (up to 3°C) while there is no trend in summer temperatures. Little ice age was not uniformly colder, perhaps. At he end of 1820s summer temperatures were just as warm as they are today, winters much colder. How do models replicate this pattern for reduced solar activity?
    0 0
  3. Ned 26# I raised the point of regional nature of solar affects because I've seen this used to dismiss the impact of other climate processes. I agree with you on the CO2 pattern of warming, if it exists. I guess this argument can be ignored in the future as all climate change has a regional nature? Marcus #32 Graphs tend to show the MM spanning 50years within a period of 100+years of low sunspot activity rather than the 300years you suggest. There also doesn't appear to be 250years between the end of this minima period and today. Whatever the time periods are you suggesting that the LIA produced 1.5oC of cooling (given a recovery of 25*0.06)? Because even this seems higher than the modelling would allow. GFW 34 On volcanos do you have a reference for that work? I found this review which lists volcanos from 1500 on ward with DVI greater than 500. There are 3 in 1500's, 7 in 1600's, 7 in 1700's and 7 in 1800's. Given that 1750 is about the time when this cold period was ending it seems there wasn't any significany drop off in volcanic activity after this period to allow warming. Interestingly they only list 3 for 1900's, although you mention several more after the publication date, seems if you are looking for unusually low levels of volcanic activity look to the 20th C. Volcanoes and climate: recent volcanological perspectives. D. K. Chester (1988) Progress in Physical Geography 12, 1-35
    0 0
  4. @Berényi Péter:
    and did some rather obvious things to it. Anyone can replicate. 1. selected northern hemisphere stations (82% of all) 2. considered temperature data for each month separately 3. used only uninterrupted series at least 20 years long, with no data missing 4. computed least square linear fit for all such 20 years interval 5. assigned slope to mid-year of 20 years run 6. averaged slopes for each (year;month) pair over set of stations 7. integrated slopes backwards in time, getting temperature anomalies relative to present
    That's not obvious at all. How do you get temperature anomalies by "integrating slopes backwards" and what's the rationale? Isn't it easier to subtract a baseline from the mean temperature? Your claim to have found no warming trend is extraordinary, and I'm willing to bet your calculations are mistaken.
    0 0
  5. Berényi Péter @ 52 says: "The very concept of "forcing" is flawed. Different kinds of "forcings" act on different parts of the climate system, so they are NOT interchangeable (even if they happen to have the same number as expressed in W/m2). CO2 makes stratosphere colder, increased solar activity (20% more UV) makes it hot. Forget about forcing as a unified concept, please." The fact that the forcings act differently on the stratosphere does not mean that a direct comparison of the forcings is unreasonable in judging the effects at the surface (if only as a first order approximation). "Also, it does not make much sense to use models to predict the long term effect of some input variable if those very models are proven lacking in postdiction." As GEP Box said, "all models are wrong, but some are useful"; the models have shown useful skill at hindcasting, see chapter 8 of the IPCC WG1 report and here: http://www.skepticalscience.com/climate-models.htm "Also, recent "global warming" is a myth." Can you explain the trend in the UAH satelite data then, which shows a clear warming trend over the last 30 years? http://woodfortrees.org/plot/uah/plot/uah/mean:13/plot/uah/trend "I have pulled global land surface data from ftp://ftp.ncdc.noaa.gov/pub/data/ghcn/v2/ and did some rather obvious things to it. Anyone can replicate. 1. selected northern hemisphere stations (82% of all) 2. considered temperature data for each month separately 3. used only uninterrupted series at least 20 years long, with no data missing 4. computed least square linear fit for all such 20 years interval 5. assigned slope to mid-year of 20 years run 6. averaged slopes for each (year;month) pair over set of stations 7. integrated slopes backwards in time, getting temperature anomalies relative to present" It is not at all obvious that this is a sound methodology: 2. Considering temperatures separately by month introduces quite a lot of extra variability into the analysis, especially as the data are temporally correlated, and separate analysis by months ignores that correlation. 6. Simple averaging of the trends will introduce a bias into the trends as the stations are not uniformly distributed around the Northern Hemisphere. An area weighted averaging (as used in the standard datasets) is required to get a real picture of the NH temperatures. 7. Integrating the slopes backward in time to get a temperature timeseries is not likely to be a robust procedure, as it will be very sensitive to any bias in the computation of the trends. There is a good reason why the standard datasets don't use this methodology, and I suspect that is it. A simple way to see this is to consider the error bars on the reconstruction, you are adding a new term for each step back, assuming the error bars are independent for each estimate of the trend, the error bars are the sum of the error bars on each trend estimate, which will get wider and wider the further back you go. "The findings are robust" Not making an adjustment for UHI makes the results less robust not more as you have not corrected for a known bias. Also robustness implies that you have analyzed the results to make sure they are sane, e.g. by checking that the average error between your reconstruction and the original data is the same at the start as it is at the end. "If anything, northern hemisphere climate is getting milder during last century, winters less cold, summers cooler. Exactly the pattern leading to long term ice sheet buildup, new glacial period coming." rather at odds with the satellite observations of arctic ice cover which show a significant decline in the arctic ice-sheet. Science requires self-skepticism (such as looking at the data to see if it is inline with your theories). It also takes a lot of hard study, which is why we have climatologists that have made it their lifes work to understand issues such as this. Having said which, I am no expert on time-series, you'd be better off asking tamino for his views on your reconstruction; he obviously does have a good grasp of time-series analysis. http://tamino.wordpress.com/
    0 0
  6. BP writes: Also, recent "global warming" is a myth. To illustrate this proposition, consider the following graph: [ snip lengthy description of DIY analysis ] Rather strange that satellites, surface stations, and measurements of ocean heat content (link 1, link 2)all perpetuate this same "myth". It's also strange that sea level continues to rise (link) due in large part to thermal expansion. Maybe you should inform the ocean that "global warming is a myth"? These are just a few examples of evidence that global warming is non-mythical. John put together a longer list back in December:
      What happened to the evidence for man-made global warming?
    • Our planet is suffering an energy imbalance and is steadily accumulating heat (Hansen 2005, Murphy 2009, von Schuckmann 2009, Trenberth 2009)
    • Animal and plant species are responding to earlier springs. Eg - earlier frog breeding, bird nesting, earlier flowering, earlier migration of birds and butterflies (Parmeson 2003)
    • The distribution of tree lines, plants, birds, mammals, insects, fish, reptiles, marine invertebrates are shifting towards the poles (Parmeson 2003)
    • Arctic permafrost is degrading (Anisimov 2006) plus warming at greater depths in the permafrost (Stieglitz 2003)
    • Global sea level rise is accelerating (Church 2006)
    • Antarctic ice loss is accelerating (Velicogna 2009), even from East Antarctica which was previously thought to be too stable to lose ice mass (Chen 2009)
    • Greenland ice loss is accelerating (Velicogna 2009, van den Broeke et al 2009)
    • Glaciers are shrinking globally at an accelerating rate (WGMS 2008)
    • Arctic sea-ice loss is accelerating with the loss rate exceeding model forecasts by around a factor of 3 (Stroeve 2007).
    • The height of the tropopause is increasing (Santer 2003, press release)
    • Jet streams are moving poleward (Archer 2008, Seidel 2007, Fu 2006)
    • The tropical belt is widening (Seidel 2007, Fu 2006)
    • There is an increasing trend in record hot days versus record cold temperatures with currently twice as many record hot days than record cold temperatures (Meehle 2009, see press release).
    • A shift towards earlier seasons (Stine 2009)
    • Lake and river ice cover throughout the Northern Hemisphere are freezing later and breaking up earlier (Magnuson 2000, Hodgkins 2005)
    • Changes to physical and biological systems across the globe are consistent with warming temperatures (Rosenzweig 2008)
    • Cooling and contraction of the upper atmosphere consistent with predicted effects of increasing greenhouse gases (Lastovicka 2008)
    • Pitcher-plant mosquitoes are genetically evolving to adapt to shifting seasons (Bradshaw 2001)
    • Distribution of plants are shifting to higher elevations (Lenoir 2008)
    See John's post for the links.
    0 0
  7. Mike Lockwood has just published a pertinent paper that discusses this subject in detail (along with some interesting comments on Internet-sourced confusion!). I think this paper is freely downloadable: M. Lockwood (2010) Solar change and climate: an update in the light of the current exceptional solar minimum Proc. Roy. Soc. A 466, 303-329 Lockwood Proc Roy Soc 2010
    0 0
  8. Thanks for the heads-up on that paper, Chris. It is freely downloadable, and it's very readable. I would encourage anyone with an interest in solar/climate connections to peruse this paper.
    0 0
  9. According to my plotting of global July Temperatures from 1979-2009 (RSS data for Mid-Troposphere temperatures), there has been a warming trend of +0.17 degrees per decade for July alone. For the June-August period, the warming trend has been +0.16 degrees per decade. So I'd love to know how Beranyi has gotten his figures.
    0 0
  10. Marcus, I tried that as well -- but I used lower-troposphere temperatures, and I looked at July data in the northern hemisphere only (since that is what Berényi Péter says he did). He claimed "No warming for July. In this case the cooling is 0.6°C/century." Like you, I found +1.65°C/century warming for July in the northern hemisphere, using the RSS lower troposphere data for the whole period of record (1979-present). Given the very, very close match between satellite and surface temperatures, I am confident that the surface records would give similar results. It seems pretty obvious that BP has mixed something up somewhere.
    0 0
  11. Occam's Razor would suggest that BP has made an error. I think more detail is required on exactly what calculations have produced that 0.6ºC/century cooling rate, so that others can check it, as such a result is contrary to considerable other evidence & scientific publications. Extraordinary claims require extraordinary proof, as Carl Sagan once said.
    0 0
  12. What Berényi Péter did is a sort of smoothing under the assumption of linearity of the 20 years period. This assumption is clearly not supported overall by the data and so his smothing procedure is flawed. Why not use standard smoothing filters?
    0 0
  13. First, thanks a lot, John, for your work on this site, it is a great resource and your writing is clear, accessible and objective. I have to say that I see a very worrying feature in this prediction of the global temperature anomaly. In all cases there is a brief rise and then a considerable decline in the global temperature over the next decade. After that (from around 2020) the global temperature climbs very rapidly. This is presumably because natural climate variation/cycles first hold back the global warming trend, then after 2020, combine to reinforce it. I realise that climate models don't predict these relatively short term trends very well, but if this temporary reversal of the warming trend actually happens in this decade, it will make it a lot more difficult to convince politicians and the public that global warming is a serious problem that requires radical changes to the way we generate and use energy (and resources). How terribly ironic if such a temperature decline actually happens just at the time when a concerted effort to reduce GHG emissions is most vital! It will truly test humanities faith in science and reason.
    0 0
  14. AndrewY, assuming that you are referring to Figure 2... it should be understood that the sharp dip shown 'coming up' is the result of a randomly placed major volcanic eruption (as can be seen by the corresponding downward spike in the black line at the top of Figure 3). Thus, while a volcanic eruption could happen in that time frame and have that sort of short term cooling impact, there is no scientific data suggesting that this WILL happen... our ability to predict volcanoes is extremely limited. The random eruptions were included only to show that they have little impact on the long term trends. That said, your observation about short term fluctuations testing "faith in science and reason" is very much what we've been living through this past decade of only mild warming. If it, and the accompanying denial, continued we could very well miss our chance to stop GHG emissions from reaching dangerous levels. However, that seems unlikely to be the case... predictions for the current year suggest that it is going to have a high temperature anomaly. Indeed, last month was the hottest January ever recorded and the third highest anomaly month (after two in 1998) in the UAH records. February looks on track to be similarly high. If predictions for 2010 hold out then it is likely that carefully constrained 'no statistically significant warming since 1995' bit will go poof.
    0 0
  15. HumanityRules My comment is a little late, but ... - Warming, e.g. in the Older Peron - was global, but higher in NH. The current warming is also greater for NH. Responsible for changes in the THC - North Atlantic deep - below the shelf - narrows the "bottleneck" ... The spectacular example - most of Antarctica, over the past 35 years, is cooled (http://www.sciencedaily.com/images/2008/05/080507132855-large.jpg), which is typical for the Millennium cycles, although the reasons may be Miscellaneous (e.g.: "A doubling in snow accumulation in the western Antarctic Peninsula since 1850." E.R. Thomas et. al., Geophysical Research Letters, VOL. 35, L01706, doi: 10.1029/2007GL032529, 2008).
    0 0
  16. CBDunkerson, thanks for pointing that out, I had missed the timing of the volcanic eruption event shown in Figure 3 (I should have guessed given that the temperature dip is such a sharp/strong feature). That's actually a relief, it means that in reality the dip in temperature is unlikely to happen at just that time (as I said, I had imagined it may have been due to some more predictable natural climate cycle, it would have been terrible timing). Strangely, I find myself happy at the news it is shaping up to be a really hot year (and that's not just because I live in the UK :o)
    0 0
  17. In terms of the little ice age, would Milankovitch forcing have played a major role in why it got cold? I have always thought that we should be entering a stadial like conditions at this point of the Holocene.
    0 0
  18. Is it not true that... "The longest minimum on record, the Maunder Minimum of 1645-1715, lasted an incredible 70 years. Sunspots were rarely observed and the solar cycle seemed to have broken down completely. The period of quiet coincided with the Little Ice Age, a series of extraordinarily bitter winters in Earth's northern hemisphere. Many researchers are convinced that low solar activity, acting in concert with increased volcanism and possible changes in ocean current patterns, played a role in that 17th century cooling." http://science.nasa.gov/headlines/y2008/11jul_solarcycleupdate.htm
    0 0
  19. Cowboy, the part of that quote that makes it consistent with this Skeptical Science post is "...in concert with increased volcanism and possible changes in ocean current patterns."
    0 0
  20. But isn't the theory of "greenhouse gases" that solar energy is absorbed by gases in the atmosphere? Is particulate matter in the atmosphere generally not as reflective as the globe, or is it somehow less capable of energy transference? Doesn't global climate envelope all ocean currents, regardless of their paths and speed? I mean, I can understand that a local condition (by Milankovitch forcing?) could cause a local change in atmospheric water vapor which could be spread and/or transferred to other locations. But wouldn't such events be "averaged" over just several decades, much less 70 years? After all, the quote I referenced said "possible changes" in ocean current patterns anyway. I don't claim to be any form of climatologist, but formal training as an engineer does teach one how to analyze scientific data. And I see things such as a desert in Arizona where there used to be a sea, and that change, along with similar changes, happened long before industrialization and man-generated CO2 (leaving aside the exhaling thing). What I get from your comment (no disrespect intended) and wording like "POSSIBLE changes in ocean current patterns" is that there are still far too many potentially related variables and unknowns to even think about trusting long-term climate modeling, particularly on a global scale. I am personally in favor of keeping an eye on the big picture history and events until there is actual evidence that models produce more accurate results. Particularly with recent events that have caused question with respect to the reliability of data used in who-knows-how-many models. Incidently, with an understanding (?) that Maunder is related (second cousins, I think) to "greenhouse gases" with respect to climate, I was looking for graphs I have seen that showed historic atmospheric CO2 level increases lagging global temperature increases. Do you know the current thinking with respect to that data?
    0 0
  21. Sorry to double-up on posting (I'm not a spammer), but with respect to the few posts above, I just found this at NOAA... "While middle tropospheric temperatures reveal an increasing trend over the last three decades, stratospheric temperatures (14 to 22 km / 9 to 14 miles above the surface) have been below average since the warming effects from the 1991 Mt. Pinatubo eruption dissipated in 1993. January - December 2008 was the 16th consecutive year with below-average temperatures (an anomaly of -0.62°C/-1.12°F), the second coolest year behind 1996 which had an anomaly of -0.64°C/-1.15°F. The below-average stratospheric temperatures are consistent with the depletion of ozone in the lower stratosphere and the effects of increasing greenhouse gas concentrations. The large temperature increase in 1982 is attributed to the volcanic eruption of El Chichon, and the increase in 1991 was associated with the eruption of Mt. Pinatubo in the Philippines." http://www.ncdc.noaa.gov/sotc/index.php?report=global&year=2008&month=ann In my understanding of the above, NOAA is saying that volcanic activity INCREASES WARMING, so if there was increased volcanic activity during the Little Ice Age, according to them it would have counteracted the cooling during that period...
    0 0
  22. Cowboy asks: "But isn't the theory of "greenhouse gases" that solar energy is absorbed by gases in the atmosphere? " I think it would be more correct to say that greenhouse gasses absorb the long wave radiation (i.e. heat) leaving the Earths surface, rather than the incoming short-wave solar radiation (light). w.r.t. CO2 lagging temperatures, a change of concentrations of about 100ppm (as we have seen over the last 200 years) happens at the start start of an interglacial period. This results from a temperature change of about 6 degrees or more, so you could argue there is a sensitivity of about 20 ppm per degree. There simply hasn't been a temperature change in the last few thousand years that could explain a rise of 100 ppm, so for that theory to work, you would need to find a reason why the carbon cycle is 6-10 times more sensitive to temperature now than it has been for the last 800,000 years (looking at the Vostok ice core data). Since the industrial revolution, CO2 levels have been rising at a fairly constant fraction (about 45%) of human emissions (fossil fuel + land use), which is prettty good evidence that the cause of the rise is not a lagged response to previous warming, but is the result fo human activity.
    0 0
  23. Cowboy, many questions are addressed in the list of "Arguments" you see at the top left of this page (the ones next to the thermometer). See, for example, CO2 lags temperature. Also handy for finding the relevant arguments and posts is the Search field at the very top left.
    0 0
  24. Cowboy, your quote of NOAA is specifically about stratospheric temperatures, not the rest of the atmosphere nor the average of the atmosphere. Volcanoes emit both CO2 and aerosols (some reflective and some not). The precise effects on temperature vary over time for a given volcano, and vary across volcanoes, because of variation in the amounts and rates of those emitted substances, and how high in the atmosphere they go (and even the height changes over time). For more, see the Scientific American note How Do Volcanoes Affect World Climate? If you have more comments about volcanoes, you should post them on a thread about volcanoes, such as Volcanoes emit more CO2 than humans. Our host, John Cook, is trying to keep each thread on topic, so often he deletes off-topic comments.
    0 0
  25. Cowboy, you wrote "...until there is actual evidence that models produce more accurate results." See the argument "Models Are Unreliable". You wrote "...recent events that have caused question with respect to the reliability of data used in who-knows-how-many models." The "events" I think you are referring to do not involve data that go into models, but only data that are observations against which the models are tested. Just as importantly, those "events" have zero implications for even those data. See "CRU emails suggest climate conspiracy". Also "On the reliability of the U.S. Surface Temperature Record". And "Can you make a hockey stick without tree rings?" Finally, your questions and comments have covered a wide enough range that I think you would enjoy and benefit from an initial overview of global warming instead of diving straight into answers to individual questions. Subsequently you might come back with some even better questions. Try cce's "The Global Warming Debate".
    0 0
  26. To Tom Dayton's pointer to materials for further study, let me add Spencer Weart's history of climate research, The Discovery of Global Warming, a very readable, fascinating and informative work no matter your perspective on this topic. The book is available in print but Dr. Weart has also kindly made it available in HTML form, at the link.
    0 0
  27. "Since the industrial revolution, CO2 levels have been rising at a fairly constant fraction (about 45%) of human emissions (fossil fuel + land use), which is prettty good evidence that the cause of the rise is not a lagged response to previous warming, but is the result fo human activity. " Understood. But the data I was referencing went back to the BEGINNING of the IR. I think I need to find that data ... But thx for your response.
    0 0
  28. "Cowboy, many questions are addressed in the list of "Arguments" you see at the top left of this page (the ones next to the thermometer). See, for example, CO2 lags temperature." Thx. I'll take a look at that.
    0 0
  29. To avoid creating a list of back-to-back posts, I'll just say 'Thanks' for the responses. Frankly, with what (I believe) I know, I don't buy into "man-made" global warming" allegedly being settled science. But I wouldn't be being honest to myself if I assumed that I must be right. Let's be honest, when you read emails that say that if empirical data does not match model outputs then the the data must be wrong, and emails that clearly say that 'inconsistent' data has been intentionally deleted, you have to question how agenda may have influenced accuracy of science, or to be more accurate, how the science gets reported. That makes it, from an honest and practical point of view, impossible to entirely separate science from politics (at risk here of being considered off-topic). On the other hand, I know that to damn the science because a piece of it may have been, to some as of yet unknown extent, compromised would essentially be an ad hominem fallacy.
    0 0
  30. Cowboy, data on CO2 emissions from fossil fuel use and land use changes can be download from here http://cdiac.ornl.gov/ "Frankly, with what (I believe) I know, I don't buy into "man-made" global warming" allegedly being settled science." neither does e.g. Phil Jones (from his interview for the BBC http://news.bbc.co.uk/1/hi/sci/tech/8511670.stm) "N - When scientists say "the debate on climate change is over", what exactly do they mean - and what don't they mean? It would be supposition on my behalf to know whether all scientists who say the debate is over are saying that for the same reason. I don't believe the vast majority of climate scientists think this. This is not my view. There is still much that needs to be undertaken to reduce uncertainties, not just for the future, but for the instrumental (and especially the palaeoclimatic) past as well. " I don't think "the science is settled" is anything most climatologists would say. There are some things known with certainty, e.g. the rise in CO2 is anthropogenic, however there are large uncertainties regarding many elements of the theory, and the scientists involved are quite happy to talk about them (their papers are often filled with such caveats). Politicians and journalists on the other hand...
    0 0
  31. "There are some things known with certainty, e.g. the rise in CO2 is anthropogenic..." Yet there were times in the past when CO2 levels were significantly higher. Correlation does not prove cause and effect.
    0 0
    Response: Both your statements are correct. However, a proper understanding of the implications requires a deeper look at the science:

    CO2 has been higher in the past

    There’s no correlation between CO2 and temperature
  32. Cowboy, correlation is necessary to demonstrate causation--just not sufficient. No climatologist relies purely on the correlation between CO2 and temperature. Indeed, the observations of temperature increase came many decades after the predictions of increase (in the 1800s, long before "computer models" existed). Observations have confirmed the predictions, which were made based on physical experiments with CO2. Regarding the empirical evidence of physical mechanisms of the causation, see How do we know CO2 is causing warming? and There’s no empirical evidence and CO2 effect is weak. Regarding the strength of the observed correlation, see CO2 has been higher in the past, and High CO2 in the past, Part 2, and There’s no correlation between CO2 and temperature, and The correlation between CO2 and temperature, and The CO2/Temperature correlation over the 20th Century.
    0 0
  33. "Cowboy, correlation is necessary to demonstrate causation--just not sufficient." Understood. It indicates the possibility of some kind of relationship, but does not establish cause/effect or the "degrees of separation". But if one set of data consistently leads or lags the other, it can help direct looking for any actual causality. Thx for all the feedback. I believe that going through a "primer" on the science will actually be more meaningful after getting some of the preconceived ideas (correct or incorrect) in better perspective as much as possible/practical first. I'm just pretty certain that I would to some extent be distracted by those things, and be looking more for support for what I might think I wanted to find/prove rather than at the science for what it is. Granted, starting with a premise to prove or "disprove" may be scientific approach, but I know for example that too often data 'normalization' and 'filtering' can be influenced by a desire to prove a premise.
    0 0
  34. Cowboy @ 81 The argument that the rise in CO2 is anthropogenic doesn't rely solely on correlations, a simple piece of accountancy is enough to verify that it is true. The annual increase in atmospheric carbon is about half the annual emissions (fossil fuel + land use), and the remaining carbon has to go somewhere. This excess carbon must be being taken up by the natural environment (oceans + terrestrial biosphere) somewhere, which proves that the natural environment is a net sink (over a full annual cycle). The bottom line is that if the natural environment were a net source of CO2 then the annual rise in atmospheric CO2 would be greater than annual anthropogenic emissions, but this is observed not to be the case, and hasn't been the case for over 150 years). As I said there are some things known with considerable certainty (Ferdinand Englebeen has an excellent website discussing this and other lines of evidence).
    0 0
  35. #59 Marcus at 12:13 PM on 22 February, 2010: "So I'd love to know how Beranyi has gotten his figures" I've given a brief description. Read it. Do it. Try to replicate. I can answer any specific question, but not interested in what you'd love to do. Or you can calculate July trends from GHCN by whatever method you see fit. Describe the method, show results. However, I can tell you the specific reason I have found a centennial decreasing trend in GHCN July temperature data. Unfortunately GHCN is dominated by USHCN stations. There is no legitimate reason it should be this way. Except it was created in America, by Americans, for Amaricans perhaps. Rather silly explanation. Weather stations in Europe have long and stable histories, still, they are absolutely underrepresented in GHCN. Worse, European record is full of discontinuities. Now. There were severe US July heat waves in several consecutive years during 1930s (see any history book on Dust Bowl in Dirty Thirties). It was not unique to Northern America thogh. In Hungary Julies in early 1930s were 0.6°C warmer than present on average. The pattern can be observed all over Eastern Central Europe as well. Looks like data collection policy of GHCN is more than sloppy. Global Historical Climatology Network (GHCN) (DSI-9100) Metadata from the NOAA Metadata Manager and Repository (NMMR) http://www.ngdc.noaa.gov/nmmrview/xmls/fgdc.jsp?id=gov.noaa.ncdc:C00422&view=html An Overview of the Global Historical Climatology Network Temperature Database 1997, Thomas C. Peterson* and Russell S. Vose http://www.ncdc.noaa.gov/oa/climate/research/Peterson-Vose-1997.pdf There are much, MUCH more data out there. First thing to do is to COLLECT it (with as much metadata as possible). Then PUBLISH it on the web, making it freely available to all. UK Met Office Proposal http://wattsupwiththat.files.wordpress.com/2010/02/metoffice_proposal_022410.pdf Even this porposal is too rigid. Data collection & verification is not rocket science, one does NOT need peer rewieved literature to accomplish it. Just open standards (like RFCs for the net) and several open source community projects to do evaluation. Way cheaper, more transparent, built-in quality assurance procedure developed for open source projects in general. "Publish early, publish often" How open collaboration works: an introduction for scholars by Larry Sanger http://www.citizendium.org/how_openness_works.html
    0 0
  36. "The argument that the rise in CO2 is anthropogenic doesn't rely solely on correlations, a simple piece of accountancy is enough to verify that it is true. The annual increase in atmospheric carbon is about half the annual emissions (fossil fuel + land use), and the remaining carbon has to go somewhere. This excess carbon must be being taken up by the natural environment (oceans + terrestrial biosphere) somewhere, which proves that the natural environment is a net sink (over a full annual cycle)." I'll consider that at least in part if you can show me that there is a 'tag' on anthropogenic CO2 to distinguish it from environmental CO2, and that there is global-wide sampling using those tags that shows CO2 levels by source that is statistically significant at a high degree of certainty. Otherwise, I'm afraid, it sounds like a premise based on what is essentially an assumption... And by the way, we will need those tags to differentiate between 'natural' environment vs environment impacted by mankind for it to be at all meaningful. Without differentiation between fuel generated CO2 and 'residual' CO2 due to mankind's impact on CO2 sinks, I don't see how your alleged equilibrium shows anything. In that differentiation between 'natural' environment vs environment impacted by mankind you will, of course, need a control rather than relying on assumptions... good luck with that...
    0 0
  37. Cowboy, you wrote "...show me that there is a 'tag' on anthropogenic CO2 to distinguish it from environmental CO2, and that there is a global-wide sampling using those tags...." Okay: The CO2 Measurements page has detailed explanations and links. Do be sure to click on the links, because that page is only a summary.
    0 0
  38. Cowboy @ 86, If you shared a bank account with Mrs Cowboy and you put in $1000 a month, and each month you found the balance rose by only $500 a month, you would know that Mrs Cowboy was spending $500 more a month than however much she were putting in. You would not need to tag all of the $1 bills as being "hers" or "yours" to know that she were a net drain on your bank account. Likewise the "mass balance" argument holds without having to "tag" any of the CO2. Do read the webpage by Ferdinand Englebeen on CO2 measurements linked by Tom @ 87, it really is an excellent resource (it includes an example similar to the above).
    0 0
  39. "Cowboy @ 86, If you shared a bank account with Mrs Cowboy and you put in $1000 a month, and each month you found the balance rose by only $500 a month, you would know that Mrs Cowboy was spending $500 more a month than however much she were putting in. You would not need to tag all of the $1 bills as being "hers" or "yours" to know that she were a net drain on your bank account." However, if I was ESTIMATING that I was putting in $1000 a month when it could actually vary between $500 and $1500, and if she was randomly putting in anywhere between $10000 and $20000 a month, and we did not reconcile to actual bills and bank fees for each of us that month, then having $500 at the end of any particular month would be meaningless with respect to whether I was actually on net, contributing to overall wealth or debt. Accounting can be meaningless for taking action without actual, exact transaction receipts, account numbers (tags) and a ledger over a statistically significant period of time.
    0 0
  40. Cowboy @ 86 Fossil fuel use is highly taxed, and thus quite well accounted for. As a result our estimates of fossil fuel use are sufficiently accurate for there to be little question of the validity of the mass balance argument. This is helped by the fact that the annual increase in atmospheric concentrations is less than half annual fossil fuel use emissions, so estimates would have to be wrong by a factor of two before there would be any doubt. The error bars simply are no where near that big. So to return to our example, if you knew that you put in $1000 per month, with a random month-to-month variation of $100, and took out nothing, but your monthly balance only rose by an average of $500 a month (plus or minus $100), you would still know that Mrs Cowboy was a net drain on your finances and you were a net source. You would know that (assuming basic numeracy) without needing actual exact transaction receipts (tags) or a ledger over a statistically significant time (note we have excellent records of emissions and the growth rate for at least 50 years), and that would be true if she were putting in $1 or $1,000,000 or $1,000,000,000 a month. Now if you can provide some evidence that our fossil fuel use has been over-estimated by a factor of two, rather than the error bars supplied with the data, then lets hear it.
    0 0
  41. I slogged through all 90 comments, most of which appear to be based on good science. The comments support the conclusion that solar variations (TSI) are much too small to explain the climate fluctuations that have occurred over the last 400 years and in particular the "Maunder Minimum" as the nadir of the "Little Ice Age". However, variations in atmospheric CO2 don't provide a plausible explanation either. What astounded me is the lack of discussion or even an honorable mention for a (highly controversial) theory that provides a connection between sun spots and climate. I am referring to the 1997 paper by Svensmark & Friis-Christensen in the Journal of Atmospheric & Solar-Terrestrial Physics. http://www.sciencebits.com/CosmicRaysClimate I think the above link provides a good explanation by someone who is not trying to oversell the idea.
    0 0
  42. gallopingcamel, that's because the old cosmic ray theory has been beaten to death: Svensmark and Friis-Christensen rebut Lockwood’s solar paper It’s cosmic rays Do cosmic rays cause clouds? It's easy to find such arguments and posts by typing "Svensmark" in the Search field at the top left of the page. Then do the same with "cosmic rays."
    0 0
  43. @Berényi Péter "Unfortunately GHCN is dominated by USHCN stations. There is no legitimate reason it should be this way. Except it was created in America, by Americans, for Amaricans perhaps. Rather silly explanation." So what? Global anomalies are gridded. First you must calculate anomalies for each station. Then put anomalies on grid. You can also run ccc-gistemp: http://clearclimatecode.org/ You can play with the code, you can play with settings. ccc results and my results calculated on CRU database much differ from yours. And how is it possible that your anomalies are almost always below zero? What is your base period?
    0 0
  44. We are now in a repeat Dalton Minimum. There is a very good chance that afterwards by 2020, a grand Maunder like minimum will begin. Cosmic ray flux will increase and lead to more clouds, further cooling the Earth. Long term solar activity minimums have occurred in the past when the center of mass of the solar system (the Sun and external planets without Jupiter) was outside of the Sun. The trigger for the initiation of sunspots is the falling of celestial bodies (comets, asteroids and others) from the Oort cloud and Koiper belt onto the Sun. The gravitation of fields of the Sun and planets govern the motions of these bodies and direct these celestial bodies to the Sun's surface. When the center of mass of the solar system is outside of the Sun most of these celestial bodies do not fall on the Sun and a long-term solar activity minimum begins. The maximum value of Rz is predicted not to exceed 50. See ref: New Maunder Minimum in Solar Activity and Cosmic Ray Fluxes in the Nearest Future, Stozhkov and Okhlopkov, 3-6 August, 2010, 22d European Cosmic Ray Symposium, Turku, Findland.
    0 0
    Moderator Response: A duplicate copy of this comment was deleted from the thread "Are we heading into a new Little Ice Age?" Please do not post multiple copies of the same comment. Thanks!
  45. @Henry Justice: "The trigger for the initiation of sunspots is the falling of celestial bodies (comets, asteroids and others) from the Oort cloud and Koiper belt onto the Sun." There is no indication whatsoever that a comet falling into the sun will trigger sunspots. I don't think you realize what the size difference between a comet and the sun is. Also, it is unlikely a comet would ever get through the ultra-hot corona to reach the sun's(relatively) cooler surface. There is also no solid evidence we are heading to a new Maunder minimum, and that this will somehow offset the current warming trend. Was the article in question peer-reviewed? (I saw there was a reference to a Willie Soon, which makes it highly suspect in my view.) After all, we should expect to be as skeptical of such claims as you seem to be about established science
    0 0
  46. #94: "Cosmic ray flux will increase and lead to more clouds. further cooling ..." That is still highly unsubstantiated; some would say, debunked, here. Cosmic ray flux was at a high during the most recent solar minimum through end 2009; where were the clouds? Where was the cooling? As for the rest, are you reading Landscheidt?
    0 0
  47. Whether the authors are right are not (wonder if they are friends of the other russian solar scientists losing the bet with Annan on global warming), the article shows effect of such a minimum will be small compared to GHG forcings. And of course when such a minimum ends...
    0 0
  48. Henry justice, that paper is here: http://ecrs2010.utu.fi/done/posters/session1/1.62_Stozhkov.pdf IMO it is an oversimplification to equate solar activity with a particular cooling from low clouds. The way I see it (in the cosmic ray thread) is that the extra cosmic rays reduce warming amplification whatever the warming sources might be. They do this by creating more atmospheric blocking, by clouds, and probably other effects. So IMO what will happen is CO2 warming will be less amplified, or not amplified at all. I'm not so sure that there will be cooling.
    0 0
  49. #98: Eric, thanks for that link. Its actually not a bad paper, but it makes no mention of clouds or cooling. They do forecast that the next sunspot max (in 2014-15) will be roughly 1/3 of the sunspot peak in 2000, ie, that we have entered a 'grand solar minimum' in 2008. Let the cooling begin! Oh, wait, it should have started already. Ironic that this paper by Russians was given at a cosmic ray meeting in the hot summer of August 2010.
    0 0
  50. @muoncounter: it seems the cooling trend that is supposed to disprove AGW is always just a few years away...
    0 0

Prev  1  2  3  Next

You need to be logged in to post a comment. Login via the left margin or if you're new, register here.


The Consensus Project Website

THE ESCALATOR

(free to republish)


© Copyright 2024 John Cook
Home | Translations | About Us | Privacy | Contact Us