Climate Science Glossary

Term Lookup

Enter a term in the search box to find its definition.

Settings

Use the controls in the far right panel to increase or decrease the number of terms automatically displayed (or to completely turn that feature off).

Term Lookup

Settings


All IPCC definitions taken from Climate Change 2007: The Physical Science Basis. Working Group I Contribution to the Fourth Assessment Report of the Intergovernmental Panel on Climate Change, Annex I, Glossary, pp. 941-954. Cambridge University Press.

Home Arguments Software Resources Comments The Consensus Project Translations About Support

Bluesky Facebook LinkedIn Mastodon MeWe

Twitter YouTube RSS Posts RSS Comments Email Subscribe


Climate's changed before
It's the sun
It's not bad
There is no consensus
It's cooling
Models are unreliable
Temp record is unreliable
Animals and plants can adapt
It hasn't warmed since 1998
Antarctica is gaining ice
View All Arguments...


Username
Password
New? Register here
Forgot your password?

Latest Posts

Archives

Watts Up With That's ignorance regarding Antarctic sea ice

Posted on 9 March 2010 by John Cook

In recent weeks, the Watts Up With That blog has focused several times on Antarctic sea ice. Specifically, Steven Goddard mentions that Antarctic sea ice has increased over recent decades, speculating this is probably due to cooling around Antarctica. In one post, he comments that "sea ice extent has been increasing over time around Antarctica – this is consistent with the idea that temperatures are cooling". In another post, he repeats this theme: "Antarctica is cooling and sea ice is increasing (makes sense – ice is associated with cold)". If his intent is to accurately describe why Antarctic sea ice is increasing, he would be better served first checking what observations and peer-reviewed research have to say on the matter.

The most common misconception regarding Antarctic sea ice is that sea ice is increasing because it's cooling around Antarctica. Goddard commits this error on several occasions. The reality is the Southern Ocean surrounding Antarctica has shown strong warming over the same period that sea ice has been increasing. Globally from 1955 to 1995, oceans have been warming at 0.1°C per decade. In contrast, the Southern Ocean (specifically the region where Antarctic sea ice forms) has been warming at 0.17°C per decade. Not only is the Southern Ocean warming, it's warming faster than the global trend.
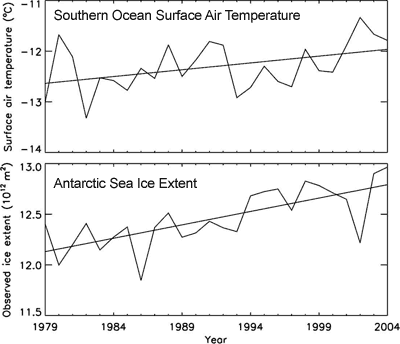

Figure 3: Surface air temperature over the ice-covered areas of the Southern Ocean (top). Sea ice extent, observed by satellite (bottom). (Zhang 2007)

If the Southern Ocean is warming, why is sea ice increasing? There are several contributing factors. One is the drop in ozone levels over Antarctica. The hole in the ozone layer above the South Pole has caused cooling in the stratosphere (Gillet 2003). A side-effect is a strengthening of the cyclonic winds that circle the Antarctic continent (Thompson 2002). The wind pushes sea ice around, creating areas of open water known as polynyas. More polynyas leads to increased sea ice production (Turner 2009).

Another contributor is changes in ocean circulation. The Southern Ocean consists of a layer of cold water near the surface and a layer of warmer water below. Water from the warmer layer rises up to the surface, melting sea ice. However, as air temperatures warm, the amount of rain and snowfall also increases. This freshens the surface waters, leading to a surface layer less dense than the saltier, warmer water below. The layers become more stratified and mix less. Less heat is transported upwards from the deeper, warmer layer. Hence less sea ice is melted (Zhang 2007).

Antarctic sea ice is complex and counter-intuitive. Despite warming waters, complicated factors unique to the Antarctic region have combined to increase sea ice production. The simplistic interpretation that it's caused by cooling is false. It's unfortunate that Steven Goddard has publicly speculated on why Antarctic sea ice is increasing without fully investigating what observations and research have found. The result is that many readers at Watts Up With That have been misled on the true and fascinating nature of Antarctic sea ice.

Note to regular readers: yes, I know I'm rehashing content from Antarctic is gaining ice. Sometimes a little repetition is required for the message to sink in.

0 0

Printable Version  |  Link to this page

Comments

Prev  1  2  3  Next

Comments 51 to 100 out of 116:

  1. Steven Goddard says: "Why are you ignoring this NASA map? http://earthobservatory.nasa.gov/images/imagerecords/6000/6502/antarctic_temps.AVH1982-2004.jpg" Your question is more appropriately directed to yourself. Take a look at the map. Notice the warming trend in the oceans around Antarctica, you know, where SEA ice is located.
    0 0
  2. Steve Goddard at 06:05 AM on 10 March 2010 Assertion is not argument, Steven. I'm left to conclude you have no useful response to Tamino's disintegration and disposal of your hypothesis w/regard to snow cover and model predictions. How you care for your credibility is of course a personal choice for you to make. As to Watts' site, if you prefer a location that is more tolerant of misunderstanding that too is your choice, but I'm won't be joining you there. I've really come to appreciate the scrupulous moderation here as well as the site's firm attachment to science.
    0 0
  3. The satellite record for Antarctic Sea Ice has been extended back to late 1972 (see below), there is also evidence from even earlier satellites back to 1966 but work is needed to process this data. There are some intermittent series of vessel observations prior to this (used in the HadISST record), plus evidence from extensive records of positions of whale kills which indicates that sea ice was somewhat higher than present times prior to 1960s. Work is ongoing to reconcile modern vessel based estimates and satellite observations in order to check older records. Antarctic Sea Ice data: The Nimbus 5 ESMR data covers the early period from December 1972 to March 1977, with the Nimbus 7 SMMR combined with the Defense Meteorological Satellite Program's (DMSP) Special Sensor Microwave Imagers (SSMI) on -F8, -F11, and -F13 satellites providing data from October 1978 to December 2002. The small gap is filled using NSIDC data. This latter satellite Data set (1978 onwards) is most often seen in “Antarctic” charts and is now in a version (V2) compatible and calibrated with the 2002 onwards AMSR-E on the AQUA satellite, basically so that the data sets can be "spliced". The early satellite record is interesting because it shows higher sea ice extents than today, but from what I've read it is probable that there was an anomalous peak in the Antarctic sea ice extent in the early 1970s due to local "decadal" Ocean cycles. I'll do my best to get references for these points lined up but am at Oceanology conference...
    0 0
  4. re: #30 Sorry dude, but Greenland's ice sheet is melting so badly that anybody can see it happening even from the low resolution satellite photos available at MODIS rapidfire. Be sure to check it out this July and August. We are talking snowcone at the ballpark in July.
    0 0
  5. Thanks Ned, I'm reading the preprint as the published paper is not accessible for me.
    0 0
  6. To Steven Goddard... What gets me about your articles, such as the one regarding sea ice extent, is the fact that you are purposefully selecting out small aspects of weather and climate (which I'm sure we both would agree are highly complex systems) that potentially show cooling and hold them up as examples to prove a point you want to make. But all the while you IGNORE the preponderance of evidence that show exactly the opposite! Literally, what you do is tantamount to trying to convince an expedition of climbers to Everest that it's "down hill all the way" by pointing out only the times when they're going downhill while ignoring all the climbing!
    0 0
  7. Hello. Just to let you know I'm a genius in my own mind, and in the minds of my grandchildren. Because of that sometimes I will speak to elementary school children about weather, sun, and planets. Now what I see is that there are several variables with whats happening. Even though the cyclonic flow may have a lot to do with whats being observed, I would like to look at the fresh water vs salt water aspect. Since fresh water freezes at a higher temp than salt water, in very elementary terms I would like to explain it like this: If I put an ice cube on a plate and put it in a freezer, turn the temp up so it partially melts the water spreads out. Then I turn the temp down and it freezes further out. I could continue doing this till the ice cube is gone. So my question is would I be wrong to use this in an elemntary way to show a possible cause for the increase in ice extent. Thanks
    0 0
  8. If you like science take a look at this article, it is in terms a reasonably knowledgeable person can understand. http://www.geolsoc.org.uk/gsl/site/GSL/lang/en/page7209.html It is a geologist point of view about ice shelf break up. I do not see how the Antarctic is melting when the temperature rarely gets of freezing, except on the Antarctic Peninsula and the shore. So how is Antarctic ice melting. (Hint, it has to move to where it is less cold than freezing). I believe interest in polar caps is due to the hype about rising ocean levels if said ice cap do melt all at once(unlikely). At the current rate it would take hundreds of thousands of years to melt away, assuming no more snow accumulation. we can breathe easier knowing we are safe from catastrophic polar melting, no matter what Al Gore shows in his movie. As for whether ice extent is due to warming, we can see that wind and ocean currents are the biggest operator in whether sea ice extent grows or shrinks. In the Arctic, NASA says that ocean currents and wind pushed out sea ice to warmer waters during the '07 record. And in the comments we see that the circumpolar winds an currents play a big part in expanding the range of the sea ice. Lastly, sea ice extent in the Arctic and in the antarctic are both within 2 standard deviations of satellite records, so what the big deal is, I do not know.
    0 0
  9. Steven Goddard talks about debating science and describes John's blog as "this Wonderland, where down is up and up is down." I take offense from that. Since the post has been left by moderators, I believe it should be addressed. For a quick comparison, I want to remind readers that WUWT is a place where the existence of natural deposition of carbonic snow on Earth was discussed as a serious possibility, a post done by Stephen Goddard. http://wattsupwiththat.com/2009/06/09/co2-condensation-in-antarctica-at-113f/ This is somewhat on topic with our thread since it is about Antarctica. The ensuing comments contain variations and apparently a partial recant on the original intent and meaning (i.e. the idea that Antarctica acts as a carbon sink because of deposition). Fortunately, some posters pointed in the right direction, and despite the overall confusion on phase changes apparent in the comments, an update later appeared. Even a cursory read of Skeptical Science will reveal the higher scientific standards that would prevent such a post to happen here in the first place.
    0 0
  10. #33 Albatross at 04:41 AM on 10 March, 2010 "I have downloaded the sea ice area data from NSIDC for Antarctica" Could you publish the link?
    0 0
  11. #30 Berényi Péter. No, you don't have to measure the volume of the ice sheet to measure the change in volume of the ice sheet. You just have to measure the change in the gravity field. So your argument is wrong. It is not just supposition, it is hard data. There are accurate explanations of it on this site, too.
    0 0
  12. Peter, I downloaded the data off their FTP server here: http://nsidc.org/data/seaice_index/archives/index.html Click on the "Get extent and concentration data" hyperlink.
    0 0
  13. Sciencefan, the ice shelves melt from below. The air temperature has nothing to do with it. The thinning, weakening ice shelves offer less resistance to the great ice sheets (which tend to spread out due to their own weight) and so ice flows faster into the ocean. See “Extensive dynamic thinning on the margins of the Greenland and Antarctic ice sheets”.Pritchard et al. 2009 in Nature/advance online publication 23 September 2009, and their Map of Antarctica: Red and yellow indicate thinning ice. Note that the "small" West Antarctic Ice Sheet (WAIS) is the major concern along with Greenland.
    0 0
  14. #34 doug_bostrom at 04:52 AM on 10 March, 2010 "Easier units on Greenland loss" Is there a loss? Published Online October 20, 2005 Science DOI: 10.1126/science.1115356 Recent Ice-Sheet Growth in the Interior of Greenland Ola M. Johannessen, Kirill Khvorostovsky, Martin W. Miles & Leonid P. Bobylev
    0 0
    Response: Ned answers this in the following comment but just to deliver the science on a silver platter, satellite gravity measurements do find that the Greenland interior is in approximate mass balance where mass loss is balanced by increased precipitation. But the edges of Greenland are losing mass. The overall result is that the Greenland ice sheet is losing ice mass (Wouters 2008). More here...


  15. Berényi Péter writes: "Is there a loss?" Yes. See, elsewhere on this site: Accelerating ice loss from Antarctica and Greenland and An overview of Greenland ice trends among other posts and articles. My suggestion would be that, before asking such a relatively basic question, to use the "Search" box on the top left of this page ...
    0 0
  16. USGS says http://climateprogress.org/2010/02/23/usgs-reports-dramatic-retreat-of-ice-shelves-in-southern-antarctic-peninsula/ find a link to a large pdf there.
    0 0
  17. Ned @65, you just beat me to it. Just a few more comments. Peter @64. From their abstract: "An increase of 6.4 +/- 0.2 centimeters per year (cm/year) is found in the vast interior areas above 1500 meters, in contrast to previous reports of high elevation balance. Below 1500 meters, the elevation-change rate is –2.0 +/-0.9 cm/year, in qualitative agreement with reported thinning in the ice-sheet margins." The increase (or stability) of snow and ice above the melt line is known: http://www.skepticalscience.com/An-overview-of-Greenland-ice-trends.html What is of concern is the loss of ice below the melt line. Also, the data in the paper you provided are for 1992-2003, whereas the data from GRACE are for the period 2002-2009. Anyhow, I am not sure what this has to do with Antarctic sea ice and the fallacious claims made at WUWT? Your comments regarding Greenland ice loss should probably be posted at the URL provided above.
    0 0
  18. So if the warmer water is being kept at the bottom these layers must be getting warmer ? where is all that heat going and whats it doing ? Cheers dave
    0 0
  19. tadzio writes: So if the warmer water is being kept at the bottom these layers must be getting warmer ? where is all that heat going and whats it doing ? Warmer water kept at the bottom of what? What layers? All which heat? Sorry, but it's not clear whom you are responding to or what the question is. Can you be a bit more specific?
    0 0
  20. tadzio at 10:39 AM on 10 March, 2010 Assuming you mean water beneath and proximate to the ice shelves, it's giving up heat to change the phase of water from ice to liquid. Energy is of course conserved in the process so unfortunately this is only a temporary effect. In the long term the Antarctic will not be a reliable means of moderating the temperature of the planet, it's already inadequate as we can see from ocean temperatures.
    0 0
  21. Tadzio, you are presumably referring to John's actual article (rather than subsequent comments) and the bit about less dense water on the surface acting to prevent warmer deep water from welling up. Keep in mind that none of this water just 'stays put'. Currents will carry it out to mix with the rest of the oceans. Indeed, that relatively warm water is brought to the Antarctic deeps from other parts of the globe. Note that even the cold water at the surface is getting warmer (per the first chart in the article)... just not as fast as it would be if these other factors (i.e. ozone driven air circulation, decreased surface water density, et cetera) weren't in play. The oceans as a whole are warming. These other factors are just minor fluctuations around that underlying trend.
    0 0
  22. So take home message. Antarctic sea ice - climate is complicated so we can't use arctic sea increases to either prove or disprove global warming. Antarctic land ice - It's simple more energy melts ice proving global warming. Arctic sea ice - It's simple more energy melts ice proving global warming. Do you not worry about the inconsistency here?
    0 0
    Response: You don't need to be so cynical, HR :-) We go where the empirical observations take us. In this case, the Southern Ocean is warming at the same time that sea ice is increasing. So obviously this is a complex and counter-intuitive situation (and from a scientific point of view, these are the questions that really fascinate scientists). The long term projections from Turner 2009 is that eventually the warming trend will overcome the increased sea ice production and Antarctic sea ice will eventually decline.
  23. Berényi Péter at 09:06 AM on 10 March, 2010 Looks like there is presently loss, but it's fun to watch scientific progress go "boink"* Here's a earlier posting on this topic from Real Climate: The Greenland Ice which discusses Johanessen et al plus some other work at the time. The open question at the time had to do with measurements at the margins of the ice sheet, which Johanessen points out was then problematic. The RC writeup looks forward to seeing results from GRACE, still in process in 2006. As it turns out, GRACE helps to refine the budget, tipping the balance of mass trends from positive to negative. *http://farm1.static.flickr.com/176/467836393_6d3ca8bca0.jpg
    0 0
  24. #58 sciencefan: "I do not see how the Antarctic is melting when the temperature rarely gets of freezing, except on the Antarctic Peninsula and the shore. So how is Antarctic ice melting. (Hint, it has to move to where it is less cold than freezing)." You may already know the answer to this based on your hint, but it is important to note that it is not necessary to melt Antarctic ice in place. All you need to do is have the glacier that the ice is part of dump the ice into the ocean, where it will melt soon enough. The fact that it is usually too cold for ice to melt is often held up as "proof" that Antarctica can't be losing mass, but the glaciers are unpersuaded by this claim and continue to lose mass anyway.
    0 0
  25. #72 HumanityRules, the details are really out of my particular expertise but I have known for quite a while that sea ice scientists have predicted drastically different responses for the Arctic and Antarctic sea ice. So this is not some story being made up after the fact -- my understanding is that the difference in response was in fact predicted. I am aware of no fundamental difference in response by hemisphere for land ice, predicted or observed. Alaska and Patagonia are doing similar things. Greenland and the Antarctic Peninsula, similar. But its different for sea ice. Sometimes the answer is simple, and sometimes it is not.
    0 0
  26. HumanityRules at 11:14 AM on 10 March, 2010 I worry more about folks being able to compartmentalize different things, a necessary part of understanding complex phenomena. Take a brief glance at a globe and notice that the Arctic is situated in a radically different environment than the Antarctic and is notably different in features. Air and water circulation around each pole is quite different, the average elevation of Antarctica is much higher than the Arctic, there is land at the South Pole, no land at the North Pole, one place is a continent in its own right, the other not; the two extremes have in common latitude from the equator and that's about all. Trying to generalize the behavior of Antarctica to the Arctic is an error.
    0 0
  27. Jeff Freymueller at 11:16 AM on 10 March, 2010 ...the glaciers are unpersuaded by this claim and continue to lose mass anyway. Cussed things, glaciers are. Entirely immune to appeals for sympathy and understanding.
    0 0
  28. Turner 09 does say something else about temperatures. From the quickfacts pdf helpfully linked above....
    a. The waters of the Antarctic Circumpolar Current (the largest ocean current on Earth) have warmed more rapidly than the global ocean as a whole.
    Not having access to Turner 09, I'm taking a guess - perhaps someone can confirm. The Stieg paper found a positive trend in Antarctic land temperature when the record was extended back to 1957. I'm guessing Turner focuses on trends since the seventies, since when there is a flat or slightly cooling trend - right when the ozone layer started to get depleted over the Antarctic. I also suspect they focused on East Antarctica re this cooling trend. Anyone read the paper? If I'm right, Goddard has mixed up continental ice with sea ice, the ocean temp record and the land record, and regional/continent-wide data.
    0 0
  29. And possibly has conflated different periods, too.
    0 0
  30. Again. Just as with snowcover in earlier article, increased ice cover is negative feedback for global warming. And I am sure, I will be told in someway (just as before) that yes, it is negative feedback, but no, it is actually positive because of x,y and z.
    0 0
  31. Sciencefan (#58) said: Lastly, sea ice extent in the Arctic and in the antarctic are both within 2 standard deviations of satellite records, so what the big deal is, I do not know. Arctic sea ice in September has reduced by over 2 million km^2 since 1980. http://climate.nasa.gov/keyIndicators/
    0 0
  32. #33 Albatross at 04:41 AM on 10 March, 2010 "Can you elaborate and quantify this generalized statement? Are the trends stat. sig.? If so, at which level of confidence? Also, for which months are you talking about?" Yes I can. You have picked the wrong months (February & September). Check April and May. I have already linked the book that was misquoted in IPCC AR4: Sea Ice: An introduction to its physics, biology, chemistry, and geology,” David Thomas, Editor Chapter 4, pp. 18 Large Scale Characteristics and Variability of the Global Sea Ice Cover by Josefino C. Comiso It says trend is significant for SH autumn. Sure it is. Figure is Southern Hemisphere sea ice trend by month, both extent & area, 1979-2009. Scale is 106 km2 year-1. Data, as you have indicated, can be downloaded from here. Freezing around Antarctica starts about three weeks earlier than thirty years ago. The finding is robust, begs for an explanation. Strong (SH) autumn sea ice trend indicates ozone hole claim might be bogus. Ozone depletion is a spring phenomenon, most expressed in October, separated from sea ice by 180 degree phase shift.
    0 0
  33. RSVP, with both the snow and ice coverage the reason that the feedback is positive is the same... because the NET change in both is that they are decreasing. In each case 'skeptics' seem intent on staring only at the tiny area where there is minor growth... while ignoring full scale mass retreat across the entire rest of the planet. The snow and ice cover of the planet is melting. That means more sunlight hits darker surfaces and causes more warming... positive feedback. The fact that a handful of areas still have minuscule growth of snow and ice should NOT be a surprise, but doesn't change the very clear overall trends.
    0 0
  34. Berényi Péter writes: "Check April and May." Okay, for April I get a trend that is almost but not quite significant at 95% (p-value 0.06). For May I get a trend that is barely significant (p-value 0.04). That's without any correction for temporal autocorrelation. My guess is that autocorrelation in sea ice extent over time scales >= 1 year is probably relatively slight, though such a correction would probably reduce the trend significance a little. It might be enough to make the May trend non-significant at 95%. If anyone cares, they can do the test. But here's the real point. BP continues: "The finding is robust, begs for an explanation. ... Ozone depletion is a spring phenomenon, most expressed in October, separated from sea ice by 180 degree phase shift. " "An explanation" is exactly what John's post at the top of this thread provides. And the Turner 2009 paper addresses your point about the seasonality of ozone depletion -- although the hole reaches a maximum in austral spring, models and observations show that its effect on circulation in the troposphere is greatest in summer and autumn. Have you actually read Turner 2009? I'm puzzled as to why you would say (paraphrased) "There's a slight increase in Antarctic autumn sea ice extent that needs to be explained" ... when the entire point of this thread and Turner 2009 is "There's a slight increase in Antarctic autumn sea ice extent and here's the explanation."
    0 0
  35. Response to #72 Apologies for the cynisism, I had written something longer but it got lost in the ether. I had alot more to say on the subject such as the whole body of work that links the arctic climate to the ENSO and AAO index variation. This explains many of the observations seen in the region without resorting to global warming. Or the real disagreements about whether the continent is warming up or actually cooling down. The AVHRR data seems to contradict land based measurements. Or the curious fact that the Zhang theory seems to rely on the fact that ice is melting at an increased and decreased rate simultaneously. I don't see in Zhang were he describes increased precipitation as a driving force. For him it's reduced salt rejection which is surely lost once ice extent begins to increase.
    0 0
  36. This is a great review from 2009 which seems to sum up the present extent of our knowledge on the subject quite nicely. Here's a few points I took from it. 1) There is no warming trend over the continent except for the penninsular. 2) The cooling trend is probably caused by ozone changes but other explanations exist. 3) Apart from the penninsular all trends are very small. 4) There is no climate change signal in the antarctic historical temp data. That signal will only emerge later this century. 5) Climate models predict there should be a signal in the historical data as well as predicting reduced ice extent. The fact that models and observations differ remains unexplained. (I should add this review is very much with the consensus on the arctic data.)
    0 0
  37. For a truly detailed analysis of the years climate was in Antarctica and the implications look at the BAMS state of the climate 2008 report. Take a look at the full report link beginning on page 113. This is a big region and the story is not straight forward BAMS 2008
    0 0
  38. WAG "Is anyone surprised at Watts? Just last week he claimed that an article from 1989 proved global warming was a hoax." No I'm not surprised. Especially after reading about he a D'Aleo concocting charts and making this claim. "NO WARMING TREND IN THE 351-YEAR CENTRAL ENGLAND TEMPERATURE RECORD" Long story short, they skipped the 19th century and only used summer temps. In the 18th century summers were indeed on the cool side. However winters were warmer than usual, so they didn't include them. http://tamino.wordpress.com/2010/02/15/summer-and-smoke/ How can anyone put their faith in Anthony Watts after that?
    0 0
  39. Peter @82, You did not specify the months either when you first mentioned the "significance" of the positive trend, nor when you asked me for the link (you are welcome by the way). Not knowing which months you were referring to, I then made a reasonable choice corresponding to the timing of the max. and min. extents, respectively. So they were not "the wrong months", as you claim. Then you provide unsubstantiated claim @82 that the positive trend is stat. sig. in the SH fall. Well, when Ned actually calc. some p-values he found that the positive trend was stat. sig. at 95% level of confidence in May only. Why did you not specify the months in question up front? Anyhow, I agree with what Ned said @84.
    0 0
  40. #84 Ned at 00:34 AM on 11 March, 2010 "Okay, for April I get a trend that is almost but not quite significant" I don't know what you did. Here are the data files for April and May. There are two separate columns in each at end of lines, one for sea ice extent, the other for area. Extent is defined as sea surface covered by at least 15% ice, area is actual ice cover. Trend slope (least square fit), mean & dispersion is calculated for each time series. Null hypothesis: Series is stationary, data points are realizations of independent random variables with normal distribution, mean & dispersion is same as calculated from data. Question: What is the probability (p-value) of slope being not less than calculated for actual data? Answer: April sea ice extent: 0.0295 April sea ice area: 0.009 May sea ice extent: 0.0212 May sea ice area: 0.0088 For sea ice extent null hypothesis is rejected at 95% (actually 97%) confidence level, for area it is 99%, both months. Looks pretty significant. Trend for April sea ice area is +26,060 km2 year-1 (+16% in 30 years). As extent is also increasing, ice covered area gets some (86 W m-2 average at TOA between 60-70S) sunshine in April, not much (24 W m-2) in May. Albedo increase is not negligible (up to 1020 J absorbed shortwave is lost compared to that of thirty years ago). "the Turner 2009 paper addresses your point about the seasonality of ozone depletion -- although the hole reaches a maximum in austral spring, models and observations show that its effect on circulation in the troposphere is greatest in summer and autumn" Funny. For some reason the ozone hole all but disappeared in 2002. And there is a dip in sea ice area for both April and May in the same year. Right? In this year ozone hole area is just 12 × 106 km2, half of last two decade's average, minimum ozone is 155 DU, 50% larger than average. But wait. Ozone hole occurs in Southern Hemisphere spring, so spring 2002 comes later than autumn, same year. One would not fancy precognition of ozone hole conditions by sea ice. Fall after this barely-hole is April-May 2003. Sea ice area is fourth largest on record. Of course it would be somewhat more correct to look at correlation between ozone hole extent & transparency and sea ice extent half a year later, but I would prefer not to re-digitize graphs. A pointer to ordinary data files, anyone?
    0 0
  41. Hi ,Thank you CBDunkerson for being a bit more prescient about my question , yes I was wondering about the less saline water keeping the warmer heavier currents at the botttom and if there where any studies as to where these waters are forced to go ? . I guess iam a bit out of my league here most of you guys sound like actual scientist where as iam just nonscientist trying to understand a mutlidisipline problem . also iam scared cuase no one is listening !!! thanx daved
    0 0
  42. CBDunkerson "The snow and ice cover of the planet is melting." My impression from the article was that ice cover was growing in Antartica, and please explain how it is melting at -17 C ?
    0 0
  43. Tadzio, no most of us are amateurs too... we've just been at it a while now. I really can't tell you precisely what happens with deep water currents around Antarctica. Obviously they have to mix with the rest of the oceans, but how quickly that happens and/or exactly where I couldn't say. Sorry about the difficulty in getting answers. With so many debates going on a single post on a tangential issue tends to get lost. Best advice is to just keep reading. As you pick up more it gets easier to fit the pieces together.
    0 0
  44. RSVP, thank you for perfectly demonstrating my point. Yes, sea ice coverage around Antarctica has increased slightly. Thus, that portion of the planet's ice is growing. Of course... it comprises less than 1% of the total. The LAND ice on Antarctica, which is 90% of the ice on the planet, is melting... as is the 9% of ice on Greenland and the remaining part of 1% found in the Arctic sea ice and total glacier mass on the other continents. So, as I said... the NET change is melting ice and a positive feedback. No matter how much 'skeptics' insist on seeing ONLY the minuscule fraction of ice which is growing.
    0 0
  45. CBDunkerson As far as feedback, I was talking about albedo. All you need is a thin covering of frost on the ground to make it white and increase reflectivity. You could have a km of ice melting below you, but that shouldnt affect this particular variable.
    0 0
  46. Back on topic, anyone who wonders whether the Southern Ocean around Antarctica is actually warming should check out the following: Roemmich 2009 (e.g., Figure 3.1a, showing high warming in depths from 0-400 dbar at latitudes 40-60 South). Mayewski 2009, especially sections 2.4.1 ("Warming of the Circumpolar Southern Ocean"), 2.4.4 ("Rapid Ocean Warming at the Western Antarctic Peninsula"), and 2.5 ("Changes in Southern Ocean Circulation"). Convey 2009, particularly the section on the instrumental period and the subsection on the Southern Ocean.
    0 0
  47. RSVP, looking at surface area vs volume does not change the results. Yes, Antarctic sea ice is a much larger percentage of the global total AREA (~38%) than it is of the total volume (~0.5%)... but that's still less than the 62% of world ice area which is melting. Amount of ice on the planet, both by area and total volume, is decreasing. Ergo... positive feedback.
    0 0
  48. Ned "Let's please not drag this blog down to the level of WUWT-style "gotcha" argument,.." I agree with the spirit of your remark, however I would ask. If climatic conditions are simply shifting in season and location, or weather exhibited more erratic behaviors (where in reality there was no net energy gain), would we still want to call this global warming? Or put another way. If North Atlantic warming slows down the Gulf Stream which in turn cools Europe, providing negative feedback, which basically impedes further warming, should we still be calling this "global" warming?
    0 0
    Response: It helps to clarify exactly what is meant by global warming. The globe is warming. The planet is accumulating heat. More energy is coming in than escaping back out to space. If the planet is still in positive energy imbalance, then yes, global warming is still happening.

    Weather and ocean cycles cause the heat within our climate system to slosh around in chaotic ways. But the total heat content of our planet continues to increase because of the energy imbalance imposed by increased greenhouse gases.
  49. Ned, it's not nail in coffin, just snow. However, it is hard to talk about Antarctic warmth while snowflakes keep coming down on your head. In a time when almond trees should bloom. Also, I think we have worked enough here to deserve some recreation time (post #90 on southern sea ice still waiting for pal review).
    0 0
  50. RSVP, call it global climate change if you think it's more appropiate.
    0 0

Prev  1  2  3  Next

You need to be logged in to post a comment. Login via the left margin or if you're new, register here.


The Consensus Project Website

THE ESCALATOR

(free to republish)


© Copyright 2024 John Cook
Home | Translations | About Us | Privacy | Contact Us