Climate Science Glossary

Term Lookup

Enter a term in the search box to find its definition.

Settings

Use the controls in the far right panel to increase or decrease the number of terms automatically displayed (or to completely turn that feature off).

Term Lookup

Settings


All IPCC definitions taken from Climate Change 2007: The Physical Science Basis. Working Group I Contribution to the Fourth Assessment Report of the Intergovernmental Panel on Climate Change, Annex I, Glossary, pp. 941-954. Cambridge University Press.

Home Arguments Software Resources Comments The Consensus Project Translations About Support

Bluesky Facebook LinkedIn Mastodon MeWe

Twitter YouTube RSS Posts RSS Comments Email Subscribe


Climate's changed before
It's the sun
It's not bad
There is no consensus
It's cooling
Models are unreliable
Temp record is unreliable
Animals and plants can adapt
It hasn't warmed since 1998
Antarctica is gaining ice
View All Arguments...


Username
Password
New? Register here
Forgot your password?

Latest Posts

Archives

Flowers blooming earlier now than any time in last 250 years

Posted on 13 April 2010 by John Cook

Climate change is being recognized as one of the most influential drivers of changes in biodiversity. This is particularly evident in the field of phenology, which looks at how climatic changes affecting timing of events in the natural world. Changes in the timing of one part of the ecosystem can have a ripple effect, disrupting other areas. For example, a change in timing of plant flowering can disrupt the creatures that pollinate them. Similarly, changes in timing of plant or insect behaviour can affect the birds that use them as food supplies. New research has been published stitching together nearly 400,000 first flowering records covering 405 species across the UK (Amano et al 2010). They've found that British plants are flowering earlier now than at any time in the last 250 years.

There's a strong correlation between temperature and the date when flowers first open each year. Consequently, much information can be gleaned from looking at flowering dates in the past. Since the mid-1700s, sightings have been made by full-time biologists and part-time enthusiasts. Systematic recording of flowering times began in the UK in 1875 by the Royal Meteorological Society. However, many sets of records are short-term, fragmented or focus on just one species. Amano 2010 developed a technique for blending fragmented records in a way that takes into account where the records came from, what length of time they cover and the differences between the flowering times of different species. This enabled them to develop a kind of nationwide, year-long, species-wide average.
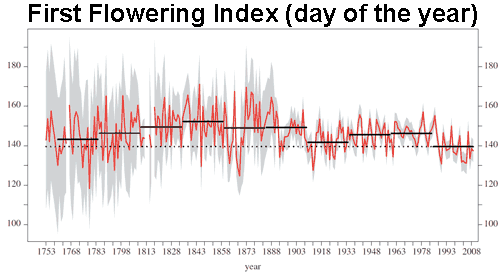

Figure 1:  Average (red line) and 95% uncertainty range (grey area) of the estimated first flowering index index (day of the year). The black
line indicates the average for every 25 years and the dotted line for the most recent 25 years (
Amano 2010). 

There's been a clear advance in the time of first flowering in recent decades. The average first flowering date has been earlier in the last 25 years than in any other period since 1760. The next step in this research is to see whether the same techniques can be employed on a larger scale, to give a regional or global picture of nature's response to temperature change.

Note: thanks to Anders Svensson for the heads-up re this article and to Richard Smithers, co-author of the paper, who pointed me in the direction of the full paper. Apparently, the full paper is only available for download until Wednesday so act now while stocks last!

0 0

Printable Version  |  Link to this page

Comments

Prev  1  2  3  

Comments 101 to 123 out of 123:

  1. michael sweet at 06:03 AM. Are we putting too much importance on a supposedly advancing spring, and just how much of the accumulated flowering data comes from plants that are cultivated against those completely subject to natural conditions? Whilst spring and autumn are called seasons, they are really only transitional periods between the two real seasons, summer and winter. In agriculture the difference between autumn and spring is that in autumn, the soil temperature is generally in place first with soil moisture the variable. With spring the soil moisture is also the variable, but has to be in place first before soil temperature increases. In south eastern Australia, the first or second week of September is the time pasture growth begins to improve. The opening of both autumn and spring growth can vary, but are subject more to the availability of moisture than temperatures. The first flowering index then should therefore incorporate some indication of soil moisture, or at least the dates of first rains to be of any use as a real indication.
    0 0
  2. Hmmm, just discovered this - http://ukclimateprojections.defra.gov.uk/images/stories/Trends_images/T_300dpi/T_Fig2.46.png Seems that England has been getting weeter since the early 1960's. I would think that this would have a lot to do with the earlier bloom times of the last 25 years.
    0 0
  3. Errr - weTTer, not weeter! LOL!
    0 0
  4. Wetter is climate change of course.
    0 0
  5. scaddenp at 12:40 PM, it depends on how the wetter and dryer periods cycle. Weather has it's cyclic patterns as well. Droughts in Australia being a good example.
    0 0
  6. "weather has cycles". But the papers under discussions are talking about trends not cycles.
    0 0
  7. Is there a thread dealing with the common refrain that 'temperatures are naturally rising because we are recovering from the last ice age' ? The closest I can find is one dealing with the postponement of the next glacial maximum (or ice age), because of all the CO2 in the atmosphere.
    0 0
  8. JMurphy, I think this is close: We’re coming out of the Little Ice Age And a runner-up is It’s a climate regime shift
    0 0
  9. Johnd A number of scientific papers have been cited that show that spring is advancing. These papers measure the response of farmed plants and natural plants and also the behaviour of animals. You can check the data and find out how much is based on natural plants and how much is based on farmed plants. I have read some of these studies (there are hundreds of published papers) and am satisfied that the issue is caused by increasing temperature. You need to cite data that suggests that is not the case. As far as changing the standard of what is measured, I am sure that the farmers in Australia measure and track soil moisture every year at many locations. Find a summary of that data. See how it compares to this data of plant responses. Just because you have not looked for it does not mean that the data does not exist. If spring comes earlier it may become too hot in summer for plants to grow, because there was not enough time for the soil to accumulate water in the winter. Of course if you live in Sibera you might welcome the warmth. The point for this thread is that the weather is measurably changing. This is caused by human intervention in the climate system. This is additional proof of AGW.
    0 0
  10. michael sweet at 09:39 AM, you appear to be missing the point that soil moisture levels, which might surprise you, are tracked and well documented, are more dependant on total rainfall and it's distribution throughout the year than any slight changes in temperature. Whilst maximum and minimum temperatures may in some locations show slight changes, the other contributing factor, hours of daylight, and hours of darkness, also do not change from year to year despite the idea of many that daylight saving does give more daylight hours. As for long term trends in rainfall, for Australia generally, the last half of the 1900's were wetter than the first half, with the wettest period on record being during the mid 1970's, that possibly being the wettest period since first settlement. Despite the absence of weather data from the official BOM records, what records do exist indicate the 1800's being drier and more drought prone than the 1900's. So despite the most recent drought, and in spite of it, the indications are that the longer term trend for Australian rainfall are positive, and this will be the determining factor as to whether seasons advance or extend more so than any very minor changes in temperature. Global warming does not stop the natural cycles driven by other yet to be fully understood forces, and the next few decades of predicted and expected generally wetter conditions for much of Australia should provide much greater insight as scientists are now better prepared to poke, prod and measure than any time previous such a cycle occurred.
    0 0
  11. Johnd, It is good to see that we agree that soil moisture is tracked. Scientists have certainly considered what the effect of AGW is on soil moisture. I have not seen that data, perhaps it is contained in this Australian report. This report is not so sanguine as you about the future rain prospects for Australia. They suggest 20% less rain for southern Australia, (rain is predicted to increase in north Australia). Can you provide a reference for your claim that "the longer term trend for Australian rainfall [is] positive"? It seems to me that predictions of 20% decrease in rain is negative. To repeat: the point of this thread was to establish that AGW has caused spring to come earlier. Data has shown that spring has advanced worldwide. You have suggested that the advance of spring should be measured differently, and that it will not cause problems anyway. I think that the data is clear and convincing on the advance of spring. Data has not been presented in this thread on the problems that will cause. The debate over how much trouble AGW will cause is for another thread where data is presented about damages and cost. For here, I believe the data shows that the damage will be more costly than mitagation. You seem to feel that the damage will not be bad. We will have to see what data is produced when a thread discusses the damage that AGW will cause.
    0 0
  12. michael sweet at 04:54 AM, firstly your Australian report link doesn't work. Secondly, for Spring to occur the soil needs both warmth and moisture. The warmth is primarily driven by lengthening hours of daylight which AGW or no AGW, are not changing. The moisture, in situations not subject to irrigation as many flowers may well be, is a function of rainfall which is highly variable both over short terms, but more importantly over longer terms as well as identified by the PDO, IPO, AMO, IOD etc. etc. which cycle over terms of perhaps six or seven decades, certainly longer than the length of time some reports use to establish and extrapolate AGW trends. Even with the graph First Flowering Index used for this topic, data from 250 years ago show the flowering was close to present day timing from which it went backwards for a considerable length of time. Just using the graph it is impossible to determine what is "normal" and what is not. As was mentioned in an earlier reply, the difference may will be due to variations in rainfall. As I also mentioned earlier, little can be drawn from the graph unless the main variable, rainfall, is incorporated or plotted against it and until that is done nothing has been proved. With regards to the 20% reduction in rainfall for Australia, 20% against what benchmark. 20% against the period of the late 1900's, or the late 1800's? What period of time represents "normal" rainfall for Australia? What information is available tends to suggest that "normal" is generally drier than what was experienced in the second half of the 1900's, hence calculations for irrigation schemes, water supply storages, etc were based on unusual rather than normal rainfall patterns. Time will tell, but from the limited information available and reconstructions of some of the longer term cycles mentioned, there are indications that the trend is positive. The big guess is whether any supposed changes forced by additional CO2 are sufficient to overwhelm those natural cycles, and at the end of the day, that is what they are, guesses and theories.
    0 0
  13. Given the First Flowering graph was based on UK data I wanted to relate the days of the year to how the seasons progress here in south eastern Australia. Here the autumn equinox happens on day 80, winter solstice on day 172, spring equinox on day 266, and summer solstice on day 356. In the northern hemisphere it follows that spring equinox happens on day 80, summer solstice on day 172, autumn equinox on day 266, and winter solstice on day 356. That means that day 140 on the first flowering index falls a full 60 days after AFTER the spring equinox and just 32 days before the summer solstice. That is certainly different to what we are used to on this opposite side of the world with the first flowering expected weeks BEFORE the Spring equinox. It would seem then that conditions that are global such as the solstices and equinoxes are less relevant than perhaps local conditions. Perhaps it comes down to the plants themselves, or the composition of the species, more spring flowering plants and less summer flowering. I realise it is the relative change that the article focuses on, but given the obvious differences between different parts of the world, it seems to be stretching credibility quite a bit to assume it represents what is occurring globally.
    0 0
  14. Here in southern New England we have had the earliest spring bloom in my lifetime (56 years)- We had the warmest March in record- 16 degrees above normal- and thus far April will be at least 10 degrees or more above normal- with the earliest 90 degree weather (April 7th) setting another record. The Hardwoods- Mapple & Oak see a leaf progression today-April 26th- about 10-12 days too early. My garden already has summer perennials robust. I have a windmill palm- trachycarpus fortunei- that suffered little cold damage with minimal winter protection growing well- the palm has been in the ground here- for several years- we are now a zone 6-7- with 'zone creep' the zone 7 line creeping north from the Connecticut coast- should see us become a zone 7 in 10-15 years. With the Co2 level PPM now at 391- it seems the climate models prediction of a rapid rise in temperature at 400 ppm most likely being accurate. Also models have predicted that after 2010- the rise in temperatures would accelerate- are now entering the zone of severe weather/climate change?
    0 0
  15. johnd, you state that warmth is primarily driven by lengthening hours of daylight. I hate to state what seems like a tautology to me, but isn't warmth also driven by, well, temperature? If the temperature for a particular day of the year is increasing due to AGW, that will change the date of blooming. Yes, length of day is a factor, yes, soil water content is a factor; but so indeed is temperature. In my area (Pennsylvania, Wash. DC) we have hardiness zone creep; the DC Cherry Blossom festival is occurring earlier and earlier over the years, and the mix of fastest growing/best adapted plants is shifting to warmer varieties. Note that the hours of daylight are NOT changing.
    0 0
  16. In my previous comment, it should state that "the hours of daylight for particular days of the year are NOT changing".
    0 0
  17. Actually last winter we where a Zone 7- lowest temperature was 1 degrees in my north central/eastern Connecticut location. Boston & Providence where a few degrees warmer (Bostons low was actually 10 degrees-making it a borderline zone 8- and Providence at 6 degrees making it a solid zone 7.
    0 0
  18. An article on Washington DC seasonal creep is described in Abu-asab et al, where they studied 100 species; 89 bloomed earlier over the recorded period (1970-1999), 11 bloomed later, with cherries blossoming 6 and 7 days earlier in '99 than in '70. They also provide precipitation data, with no significant correlation found between precipitation trends and first-flowering dates. They do point out that increasing CO2 levels might have an effect, and do not have an explanation for the 11 species that bloom later - but the earlier bloom dates correlate closely with the temperature changes.
    0 0
  19. John, I added that article link under "It's not happening".
    0 0
    Response: Much appreciated, thanks! The more peer-reviewed links we can include in the Global Warming Links directory, the more useful a resource it is.
  20. If I'm reading the diagram correctly, the botanical spring has moved two or three days forward within the last 250 years. Aren't you aware, that this will show that earth has NOT warmed since that time in any way? Due to earth's axis precession once in 25800 years, the seasons will move completely through our calender in that time. So spring for example should move forward for about 3.6 days in a 250 years period. So I think the result of this paper is the confirmation of a little COOLING of earth within the last 250 years. Quite a good argument for climate scepticals! Isn't it?
    0 0
  21. Thank you Juergen for this sobering time perspective on the 'alarming' news of early blooming! To me it looks like spring has moved three to four days within the last 250 years, so it is exactly in line with your 25800 year period. No cooling. But let us not forget that between the first and the last period in the whole diagram there are also striking maxima and minima. What if a diagram-interested scientist 100 years ago had concentrated on the period 1840 to 1910? ''Alarming news! Flowers now blooming 12 days earlier than 70 years ago!'' Or take 1920 to 1970: '' New ice age imminent! Spring now comes five days later than just 50 years ago!''
    0 0
  22. Hello Argus, thanks for your answer. However if you are looking only for short periods, the typical climate oscillations which happened always in the past independant of Co2, will show exaggerated tendences. But if we look at longer times and only 'normal' periods (not those being famous for their extraordinairy cold climate like Maunder or Dalton) we can suddenly see, that the nature is not as much 'alarmed' like lots of people or our politicians. Each month the press shows new temperature diagrams commented with messages of 'new temperature records'. But my personal daily experience in the last 30 years does not show a 'Michael Mann' - heating. And the above diagram confirms my experience. Obviously the short warm period between Maunder and Dalton minimum looks having been as warm as today - however there was a much smaller Co2-concentration in the atmosphere at that time. If wee can confirm the above work by further groups and examinations, what would that mean for the theory of Co2-driven global warming? I think this will mean at least, that the predicted amount of warming due to Co2 is estimated extremely too high! Doubling should give 0.5 degrees, like Lindzen says. And there should be other things beneath Co2 driving our climate! Maybe Svensmark is on the right way?
    0 0
  23. Juergen, The discussion in this thread seems to have died out, but you and I can continue if we like it, anyway. My point with examples of two shorter periods of 50 and 70 years respectively, was that you can get all kinds of results when examining this kind of graph, depending on which period you select. Now, 50 years may seem short, climatewise, yet almost all alarming reports now, that we can follow in threads on this site, are based on observations during (the last) 10, 20, or 30 years. 250 years is a long period, but to me it is incomprehensible that so much can be inferred from a tiny difference of three days between the start and the end of a graph - considering that in between there are maxima and minima that differ more than 10 days from each other! And this is even after taking averages of 25 years at a time. If you look at yearly averages (the red curve), flowering varies between day 120 and day 170. Quite a span. Another example: if we compare the average from around 1980 with the beginning of the curve, a headline 30 years ago could have read: 'Flowers now blooming 5 days later than 220 years ago'. So actually, all this report is saying, is that we see a change in the last 20-30 years towards a few days' earlier blooming. Thus, we are back to making grand projections about earth's climate for the coming millennium, based on small variations observed during the last couple of decades.
    0 0

Prev  1  2  3  

You need to be logged in to post a comment. Login via the left margin or if you're new, register here.


The Consensus Project Website

THE ESCALATOR

(free to republish)


© Copyright 2024 John Cook
Home | Translations | About Us | Privacy | Contact Us