Climate Science Glossary

Term Lookup

Enter a term in the search box to find its definition.

Settings

Use the controls in the far right panel to increase or decrease the number of terms automatically displayed (or to completely turn that feature off).

Term Lookup

Settings


All IPCC definitions taken from Climate Change 2007: The Physical Science Basis. Working Group I Contribution to the Fourth Assessment Report of the Intergovernmental Panel on Climate Change, Annex I, Glossary, pp. 941-954. Cambridge University Press.

Home Arguments Software Resources Comments The Consensus Project Translations About Support

Bluesky Facebook LinkedIn Mastodon MeWe

Twitter YouTube RSS Posts RSS Comments Email Subscribe


Climate's changed before
It's the sun
It's not bad
There is no consensus
It's cooling
Models are unreliable
Temp record is unreliable
Animals and plants can adapt
It hasn't warmed since 1998
Antarctica is gaining ice
View All Arguments...


Username
Password
New? Register here
Forgot your password?

Latest Posts

Archives

Has Arctic sea ice returned to normal?

Posted on 24 April 2010 by John Cook

An argument gaining popularity in 2010 is that Arctic sea ice has recovered from its long-term decline. Winter sea-ice extent bounced back strongly in the cold Arctic winter of 2010. Anthony Watts tells us that Arctic sea ice is returning to normal. However, this argument only looks at one piece of the puzzle while neglecting the full picture of the Arctic sea ice. Consequently, I've added a new rebuttal to the argument 'Arctic sea ice has recovered' (the 108th skeptic argument). This is basically a simplified version of Peter Hogarth's comprehensive review of peer-reviewed research into Arctic sea ice (and also includes useful information from the comments).

When people talk about the state of Arctic sea ice, they most commonly refer to sea ice extent. This is the area of ocean where there is at least some sea ice (the most common cut-off is 15%). Sea ice extent shows a strong seasonal cycle as Arctic ice melts in the summer, reaching a minimum in September, then refreezes in the winter, peaking in March. Temperature is the main factor driving changes in sea ice extent, although other factors like wind patterns and cloudiness play a part. While sea ice extent has been steadily declining in recent decades, it fell to a record low in 2007 due to a combination of factors.
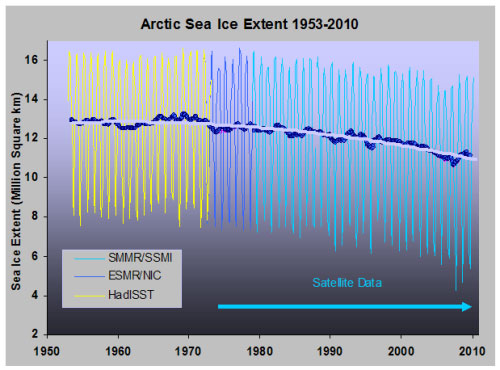
 
Figure 1: Sea ice extent with trend from 1953 onwards.

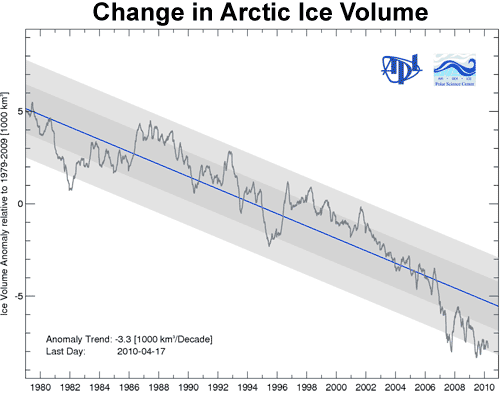
Sea ice extent gives us a reasonable indication of the amount of Arctic sea ice but does have its limitations. Extent tells us about the state of the sea ice at the ocean's surface, not what's happening below. A better metric for the total amount of sea ice is, well, the actual total amount of sea ice, measured by sea ice volume. Satellite radar altimetry (Giles 2008) and satellite laser altimetry (Kwok 2009) find that Arctic sea ice has been thinning, even in 2008 and 2009 when sea ice extent showed a slight recovery from the 2007 minimum. So while some claimed Arctic sea ice was recovering after 2007, the total volume of Arctic Sea ice through 2008 and 2009 were the lowest on record (Maslowski 2010, Tschudi 2010).
Arctic sea ice volume anomaly
Figure 2: Continuously updated Arctic Sea Ice Volume Anomaly Polar Ice Center.

Currently, websites such as Watts Up With That are using sea ice extent in 2010 to claim Arctic sea ice has returned back to normal. A few days ago, Watts claimed that we had "more ice than any time on this date for the past 8 years". On the contrary, in March 2010, the total Arctic sea ice volume was 20,300 km3 - the lowest March value for total sea ice volume over the 1979-2009 period. Those who claim Arctic sea ice has returned to normal are focussing at the thin shell at the top and neglecting the steadily thinning sea ice below.

0 0

Printable Version  |  Link to this page

Comments

Prev  1  2  

Comments 51 to 73 out of 73:

  1. Polar Ice Center have alot of supporting data for thier ice volume model here http://psc.apl.washington.edu/zhang/IDAO/index.html It includes forecasts for the Bering Sea and the whole Arctic. It looks like the model is at least underestimating the ice extent as of today. It'll be interesting to see how this works out.
    0 0
  2. The discussions here are always very high quality and often well beyond my own level of knowledge on climate change (I come here mostly to learn), but I have a question for everyone. Please pardon me if this is obvious. If I understand this right the issue with sea ice extent is in regards the lower albedo of open sea during the summer months, right? Winter sea ice extent has little effect on albedo because the arctic is mostly in darkness. My question is, are the folks at WUWT being disingenuous to make any claims about sea ice extent in March when winter sea ice extent is going to have very little negative feedback?
    0 0
  3. >are the folks at WUWT being disingenuous to make any claims about sea ice extent in March when winter sea ice extent is going to have very little negative feedback GOSH NO!!! Because This NASA page from October of 2007, after the record summer low, explains how the lower "perennial" ice during the previous two winters combined with unusual wind patterns is what led to the record low. Also, NASS specifically states in their article that the March 2007 ice was the lowest ever for that month, so, in turn, NASA knows that the March Ice extent, which leads to perennial ice, is very important. What is going on is that many, including NASA - see YouTube, made predictions that the Arctic Ice was on a one way downhill slide because of feedbacks caused by open water, but just like the stock market and other things in nature (think Hurricanes after Katrina) nature has a way of fooling us all. We ALL just have to wait and see what happens. Things have a habit of reversing themselves and it is VERY IMPORTANT that artctic ice recovered in 2008 from the 2007 low and even recovered more in 2009 and is showing signs of continuing that recovery, it is what it is.
    0 0
  4. There is a sharp conceptual difference between things measured vs. assumed based on a computational model like PIOMAS (Pan-Arctic Ice-Ocean Modeling and Assimilation System). In this sense sea ice extent is measured, volume is not measured, not even calculated. These values are based on a computational model, heavily interlinked with other models. It is extremely difficult to verify such a thing. However, they have a Seasonal Ensemble Forecasts of Arctic Sea Ice from April 2 to September 26, 2010 in three days steps made at the end of March (for scientific research and education only). I have made a backup, just in case. In five months we can check if sea ice extent prediction is correct or not. That is, the model is falsifiable. We can put more faith into ice volume reconstructions provided the ice extent prediction in fact will not be falsified. The September 2010 arctic sea ice extent is predicted to be 5.3 million square kilometers. We'll see.
    0 0
  5. I actually commented over at Watts Blog about how it was disingenuous for him to insinuate that volume was increasing at the end of his blog post and I got a couple snippy comments back but no refutation.
    0 0
  6. Berenyi, as noted previously in comment #50... the ICESat satellite provided Arctic ice volume measurements which closely matched the PIOMAS model. ICESat is no longer functioning, but the Cryosat II satellite launched several weeks ago will be able to provide the same sort of data in a few months. Thus, this September we will be able to compare PIOMAS not just to the measured sea ice extent, but also the actual measured volume. If it continues to match up to then it would seem to be a fairly solid model. In any case, the fact is that we DO have direct ice volume measurements and they will tell us whether it is 'recovering' or not. robhon, in addition to albedo not being much of an issue during the arctic Winter it needs to be understood that sea ice extent is not DIRECTLY determinative of albedo. Sea ice area, the total surface area of ice floating in the ocean, determines albedo. This differs from extent in that extent is not the area of the ice itself, but rather the area of the ocean which is at least 15% covered with ice. So the extent can be as much as 1 / 0.15 = 667% as great as the ice area. This means that minor fluctuations in extent may or may not tell us anything about albedo... the extent could have changed because the area of the ice did OR because the ice was more or less spread out. This is one of the reasons why extent is really only useful for determining long term trends and making statements about 'recovery' based on minor variations in a couple of years are not just 'disingenuous' but clearly unfounded.
    0 0
  7. @nofreewind... I'm not sure you can call two positive upticks a recovery in the face of 30 years of negative trend. If that positive trend continued for the next 5 years we might have something to begin talk about. But I don't think this answers my question. I'm actually asking less about the disingenuousness of WUWT and more about the lack of negative feedback because winter ice extent occurs mostly during the 24 hr darkness of winter. I'm not suggesting that the winter ice extent isn't important - it's a relevant data point - but with regards to climate change winter ice extent is going to offer very little of what one might hope for: Increased albedo and some negative feedback. (FWIW - We should ALL be hoping that there are more negative feedbacks out there than science seems to be currently finding.)
    0 0
  8. @CBDunkerson... Thanks for that response. I guess I'm also curious about the relative importance of summer and winter extent. Winter ice extent is, I'm assuming, a nominal feedback and mostly an annual data point, whereas summer ice is going to be a more important data point because it's going to suggest more about ice volume and positive feedback due to the albedo of the open ocean.
    0 0
  9. I have a question about sea ice formation. How does salinity effect the sea ice. How much salt remains in the sea ice, does the layer below the ice become more saline? Does this affect the temperature of ice formation? What about acidification and ice? I can't test this in my freezer it just won't do -20C. I'm thinking about optimal conditions for sea ice growth.
    0 0
  10. Mike_Allen, sea ice is 'fresh water'... the salt is forced out during the freezing process. Thus, the melting of large amounts of sea ice can decrease the overall salinity of the underlying ocean water. I know cold water acidifies more quickly / to higher concentrations than warm water, but not how that impacts freezing point.
    0 0
  11. A few more points on sea ice and salinity. The layer below newly formed sea ice initially gets more saline but then tend to sink due to an increase in density. This contributes to the stratification of the Arctic Ocean. The solidification temperature of sea water decreases by about 0.28 °C for every 5 PSU increase in salinity. Sea ice melting may play a role as a CO2 sink. When ice melts the resulting water is depleted in CO2 and then can absorb more of it from the atmosphere.
    0 0
  12. Not exactly in topic but related. A new paper in Nature used the latest ERA reanalysis product (called ERA-interim) to study the possible causes of the well known polar amplification. They found that the impact of sea ice reduction is the largest contribution to the effect, more than atmospheric transport which is commonly believed to be dominant. They also considered humidity and cloud cover as possible causes. One of the improvements of ERA-interim reanalysis is a more realistic troposheric temperature derived from satellite based irradiance measurements, which overcomes the lack of land based temperature measurements.
    0 0
  13. Just to follow up from Riccardo #62, the polar amplification has been a prediction of warming caused by greenhouse gas pollution for a very long time. Run the models with e.g. a solar cause of warming, and the polar amplification doesn't happen, but with increased greenhouse gasses, and TADA there it is. I'm afraid I can't provide a reference without going and digging on my bookshelf, but I can assure you that it's a clearly stated prediction in at least one of the ~ 20 year old environmental science textbooks in my possession. And being in a textbook, that makes it a mainstream prediction.
    0 0
  14. I agree with Carlos #1. Just checking my spreadsheet for ice melt 2010. In 2009 the max extent was 14.41 million sq/km on March 5. The 2010 extent on the same day was 14.31 m/sq/km. The 2010 max came late on 31 March, identical to 2009 at 14.41 m/sq/km. On that date the 2009 extent had dropped to 13.97 m/sq/km which gave 2009 a head start of 440,000 sq/km. Since March 31 2010 the drop in extent was 1.24 m/sq/km at a rate of 41,297 sq/km per day. For the same period in 2009 the drop in extent was 803,438 sq/km at a rate of 26,781 per day. This is a good indicator that late thin ice melts rapidly. The sea ice extent on April 30 is now the same for 2009 and 2010 at 13.16 m/sq/km.
    0 0
  15. Re 54: the PIOMAS model is already falsified by the failed predictions in GRL "Ensemble 1-Year predictions of Arctic sea ice for the spring and summer of 2008" by Zhang et al. Of course there were uncertainties such as initial conditions, weather patterns changes, weather chaos and water temperatures, but some of those were controllable within the model (some like weather are not). Is there a follow-on paper to this? Don't know, I am still looking.
    0 0
  16. Eric, you may have noticed the meaning of the last three letters of the acronym PIOMAS: Modeling and Assimilation System. This means that it is not a pure model for projection; instead, measured relevant weather data are used to calculate actual ice volume. Projection ability relies on the quality of the weather data input and eventual failings do not disprove the ability to assess current ice volume. Assuming no trivial errors in the model, the only way to disprove its calculation ability is with independent direct measurements of ice volume.
    0 0
  17. Riccardo, thanks for the reply. The PIOMAS seemed to be used for projection in the paper, namely 7 experiments to test the predictive skill of the model. I was hoping for a followup paper here: http://psc.apl.washington.edu/publications/publications.php?year=2009 but there was only a Jan 2009 paper talking about the model, but not the predictions made in the previous paper or the success of those predictions. Direct independent measurements would seem appropriate and they are at least partly available for 2008 to compare to the predictions.
    0 0
  18. Today the ice extent, which was reported in late March at various skeptic sites to be completely recovered, compared to the 30 year average, intersected the 2007 (lowest recorded year) line. And it intersected it at a steep slope. Compared to 2007, the 2007 extent was limited the whole time and followed the curve pattern of the 30 year average. This year, the decline is much steeper than the 30 year curve. How shall we hide THIS decline? http://nsidc.org/data/seaice_index/images/daily_images/N_stddev_timeseries.png (usual caveats about weather is not climate apply, and of course I am just eye-balling the graph. For those who complain that 30 years isn't long enough – here is a graph that incorporates data back to 1900. http://arctic.atmos.uiuc.edu/cryosphere/IMAGES/seasonal.extent.1900-2007.jpg
    0 0
  19. Eric, indeed they show the comparison with ICEsat for 2003-2007 here.
    0 0
  20. Fresh Anecdote: Martin Hartley, a member of the team, said the condition of the ice was unpleasantly bad. “We spent a couple of days walking on ice that was three or four inches thick with no other thicker ice around, which was a big surprise to us,” he told the news conference. “On more than one occasion we came across enormous areas of very thin ice, which is quite stressful to travel on. We came across open water which we had to swim across.” At one point an ice floe the team’s tent was moored on broke apart, although no one was injured. Last month explorers at the team’s ice base some 680 miles further south reported a three-minute rain shower, which they described as a freak event. Arctic team reports unusual conditions near Pole Team also reported rapid drift rates, far higher than anticipated, so perhaps we're looking at another 2007 where wind and warmth combined to make an excursion more noticeable than other years in a downward trend?
    0 0
  21. Checking again NSIDC today, it seems the recent slope has persisted and extent is now below the 2007 extent, over 2 standard deviations below average. That makes it a rather fast spring melt and it interestingly correlates with M. Pelto comment on this spring's fast snow melt. Anyone claiming that Arctic sea ice has returned to normal needs to have his/her head examined (and not by a blog scientist).
    0 0
  22. And Robhon, to answer your question @52, the folks at WUWT are probably not being totally disingenuous, at least not all of them. Some genuinely do not realize that there is no sunshine up there during winter time. Nofreewind's complete lack of comprehension of your question and his ensuing post, talking about other things, should give you a clue.
    0 0
  23. Found a link where PIOMAS was used for predictions within a season (2008) http://psc.apl.washington.edu/IDAO/seasonal_outlook.html The result shown in fig 2, http://psc.apl.washington.edu/IDAO/ensemble_fig2.gif is that the model slightly underestimated the Sept extent near the beginning of the season and overestimated towards the end (the final 8/1 prediction was higher than the actual Sept extent). I haven't found any followup on their 1 year predictions for 2008, probably because they realize there are too many weather variables that are outside the scope of the model. Looks like the best use of the model is to run it in the spring to predict the fall minimum. The 2010 prediction is here http://psc.apl.washington.edu/zhang/IDAO/seasonal_outlook.html and is for 5.3m sq km, slightly less than 2009.
    0 0

Prev  1  2  

You need to be logged in to post a comment. Login via the left margin or if you're new, register here.


The Consensus Project Website

THE ESCALATOR

(free to republish)


© Copyright 2024 John Cook
Home | Translations | About Us | Privacy | Contact Us