Climate Science Glossary

Term Lookup

Enter a term in the search box to find its definition.

Settings

Use the controls in the far right panel to increase or decrease the number of terms automatically displayed (or to completely turn that feature off).

Term Lookup

Settings


All IPCC definitions taken from Climate Change 2007: The Physical Science Basis. Working Group I Contribution to the Fourth Assessment Report of the Intergovernmental Panel on Climate Change, Annex I, Glossary, pp. 941-954. Cambridge University Press.

Home Arguments Software Resources Comments The Consensus Project Translations About Support

Bluesky Facebook LinkedIn Mastodon MeWe

Twitter YouTube RSS Posts RSS Comments Email Subscribe


Climate's changed before
It's the sun
It's not bad
There is no consensus
It's cooling
Models are unreliable
Temp record is unreliable
Animals and plants can adapt
It hasn't warmed since 1998
Antarctica is gaining ice
View All Arguments...


Username
Password
New? Register here
Forgot your password?

Latest Posts

Archives

Why Greenland's ice loss matters

Posted on 27 May 2010 by John Cook

There are various stages of denial along the skeptic spectrum. The first stage is "It's not happening". In the case of the Greenland ice sheet, an early argument was that "Greenland can't be losing ice because it's gaining ice in the interior". However, a number of independent lines of evidence have all shown that overall, the Greenland ice sheet is losing ice. In fact, the rate of ice loss is accelerating. In light of this unequivocal evidence, many have moved onto the second stage, "okay, it's happening but it's not so bad. Greenland is losing 286 gigatonnes of ice per year? Big deal! There's around 3 million gigatonnes still remaining in the huge ice sheet. Take a chill pill, alarmist!"

This view is articulated by Willis Eschenbach in On Being the Wrong Size (well, he didn't say to take a 'chill pill', that was creative licence on my part). Eschenbach argues that Greenland is losing about 0.007% of its total mass every year. At that rate, it will take 15,000 years to dissipate. Personally, I love a good visual so kudos must go to one of our regulars, Berényi Péter, who posted this picture in an earlier Skeptical Science comment, comparing 2009 ice loss to the total ice sheet:
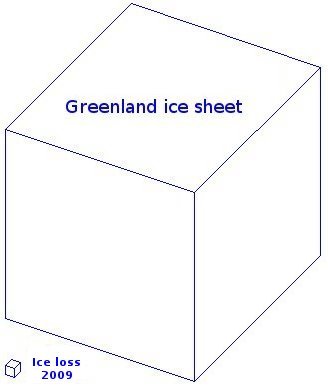
The important point to remember here is that ice loss is accelerating. In 2002, the ice loss was 137 gigatonnes per year (Velicogna 2009). At that rate, the ice sheet would take nearly 22,000 years to dissipate. By 2009, this rate had more than doubled to 286 gigatonnes per year, reducing the ice sheet "lifetime" to 10,500 years. As the rate of ice loss increases, the ice sheet's lifetime is also diminishing.

So the crucial question is how will the Greenland ice sheet behave in the future? Extrapolating an accelerating curve into the future is always problematic. However, there are several different ways to approach the problem.

One method is to study the physics of glacier movements. One paper calculates glacier dynamics factoring Greenland's topography, the cross-sectional area of its glaciers and whether the bedrock is based below sea level (Pfeffer 2008). Including contributions from Greenland and Antarctica, the study estimates global sea level rise between 80 cm to 2 metres by 2100.

A semi-empirical technique looks at how sea level and global temperature have changed in the past (Vermeer 2009). Sea level change can then be expressed as a function of temperature change and future projections of global temperature can be used to simulate future sea levels. This method predicts global sea level rise of 75cm to 180cm by 2100.

Climate modelling of the Greenland ice sheet predicts eventual collapse of the Greenland ice sheet if CO2 levels go over 400 parts per million (ppm). We're currently at 392 ppm. At 400 ppm, they predict that over the next 400 years, the ice sheet will lose between 20 to 41% of its volume (Stone 2010). This is equivalent to roughly 1.4 to 2.8 metres of sea level rise just from Greenland.

Lastly, we learn much about how the Greenland ice sheet behaves by looking at sea level change in the past. The more optimistic IPCC emission scenarios predict warming of 1 to 2°C. The last time temperatures were this warm was 125,000 years ago. At this time, sea levels were over 6 metres higher than current levels (Kopp 2009). This tells us the Greenland and Antarctic ice sheets are highly sensitive to sustained, warmer temperatures and are likely to contribute sea level rise measured in metres in future centuries.

So Willis Eschenbach and Berényi Péter do us a service in illustrating how much ice is still left in the Greenland ice sheet. This is a vivid reminder of Greenland's potential to contribute significantly to sea level rise in the future. And multiple lines of peer-reviewed evidence, both modelled and empirical, all paint a similar picture. The Greenland ice sheet is highly sensitive to warmer temperatures and is likely to contribute sea level rise in the order of metres over the next few centuries.

0 0

Printable Version  |  Link to this page

Comments

Prev  1  2  

Comments 51 to 68 out of 68:

  1. I wouldn't think too much on temperature records over Greenland in determining melt rate. There is an awful lot of energy difference between water at 0C and ice at 0C; there's no difference in temperature.
    0 0
  2. Chris G writes: Thinking more about the rate of loss, it comes to mind that loss takes place through two mechanisms, flow of ice into the sea, and melting of ice and water flow into the sea. [...] The ice mass loss of Greenland is a total of these (and I suppose some evaporation/sublimation), and I don't think there are measurements that help attribute how the mass is being lost. Actually, people are starting to work on partitioning these. There's a 2009 Science paper by van den Broeke et al. that gets into this in some detail. The bottom line is, as they say "The total 2000–2008 mass loss of ~1500 gigatons, equivalent to 0.46 millimeters per year of global sea level rise, is equally split between surface processes (runoff and precipitation) and ice dynamics. " More detail can be seen in some of the figures. The first figure shows a comparison of actual mass balance measurements from GRACE with their modeled ice budget (SMB - D, where SMB is modeled surface mass balance from a regional climate model, and D is measured discharge from marine-terminating outlet glaciers): The next figure from the paper breaks down the budget into surface mass balance and discharge: Clearly, discharge is increasing, and surface mass balance (precip minus runoff) is also increasingly negative, so both contribute to the overall negative mass balance. When this was all discussed a while ago, someone (Geo Guy?) was suggesting that sublimation could account for the loss of ice mass measured by GRACE. Here's a breakdown of the components of surface mass balance, including sublimation: Check out the paper if you're interested.
    0 0
    Response: While you're at it, check out my blog post on this paper :-)
  3. Thanks Ned, that's interesting stuff. I'm suffering from not wanting to buy a subscription to every worthy source, Science, Nature, AGU, etc., and determining which ones are most useful to me as a non-researcher. But, I'll see if I can't find an adequate way around that problem. I figured sublimation had to be small potatoes. If you are loosing a Lake Erie annually, well, that is a pretty high rate for sublimation to account for above and beyond whatever the historical baseline rate was. Besides, even if it were the primary mechanism for the loss, what would cause it to change that wasn't an effect of climate change?
    0 0
  4. [That was an interesting post, had some intriguing parts. Why not try it again, without the insinuations such as Rahmstorf being "economical with the truth?"]
    0 0
  5. Peter Hogarth at 08:09 AM on 28 May, 2010 Thanks for the graphs! I used the raw (GISS) data, not corrected for anything, but as Greenland is only rural and had very few shifts in position of the thermometers, I didn't expect much difference. See the detailed trends here. The yearly average trends indeed are substantially increasing in the pre-1940 period, but I looked at the summer temperatures, as these are more important for the ice melt and these show hardly any trend. Thus it seems that mainly winters over Greenland (and the rest of the NH?) were colder some 100 years ago. About aerosols, see my previous comment...
    0 0
  6. Chris G at 01:27 AM on 29 May, 2010 About temperature: Besides simple pressure from the huge ice mass (over 3,000 m), air temperature and direct insolation are important, as whithout elevated temperature above freezing point (and summer melt at the ice surface), there wouldn't be any accelerating extra melt and/or smearing by water reaching the glacier bottom via moulins. There is a substantial difference in speed of the largest Greenland glacier between summer and winter (about 20%), but once the meltwater reaches the bottom, it stays there for longer periods, giving a sustained all-year acceleration of the glacier. See RealClimate on that topic.
    0 0
  7. Our esteemed host, John Cook, writes: Response: While you're at it, check out my blog post on this paper :-) Ooh, now I'm covered in embarrassment. I should have known John would have done a post about that paper (and I should have used the Search box to find it!) By all means, do check out John's blog post about the components of the mass balance budget for Greenland. He shows the exact same figures I put in the comment above, but he explains them better!
    0 0
  8. #49 Chris G, the coast is uplifting quite rapidly today, although that is also very close to where the ice is being lost right now. If/when the main area of ice loss shifts to the interior, the uplift will be highest there but still probably faster than sea level rise at the coast.
    0 0
  9. #57, that's OK, Ned. You reminded me that I need to look up that paper, and your explanation was fine!
    0 0
  10. FerdiEgb, The surface summer temperatures in Greenland are limited in their rise by the phase change of ice to water. The massive ice sheet creates it's own temperature. That does not mean that melt is less, only that there is not a large temperature response. Other measures are required to obtain an accurate picture of the situation. The rising melt line shows the situation more clearly.
    0 0
  11. FerdiEgb at 06:30 AM on 29 May, 2010 michael sweet at 01:06 AM on 31 May, 2010 easily beat me to a response on similar lines. We see the same Winter variance/Summer "clipping" to just above melt point over the Arctic sea ice.
    0 0
  12. JC: At 400 ppm, they predict that over the next 400 years, the ice sheet will lose between 20 to 41% of its volume (Stone 2010). Stone 2010 doesn't predict anything. It is an investigation of current deficiencies in ice-mass modelling, not a crystal ball. Referee Comment C194 puts this better than I could: You don’t draw any direct conclusions about the future of the Greenland Ice Sheet from your modelling, and I think this is important not to do that. The conclusion of your work should relate to the model and not to the Greenland Ice Sheet. You have shown that the model is very sensitive to parameters, and hence any conclusions drawn from it about the future of the ice sheet itself should be seen in the light of this sensitivity and the model deficiencies. Otherwise it would be easy for someone to take Fig. 12f, in particular, out of context, to show that Greenland may not exist in a 400ppmv world. You weren't quite that bad. You took Fig. 12e out of context (41% versus 81% loss). Bad enough, though - and, in my experience, entirely typical of how research papers are treated around here. I think this is the fifth misrepresented paper I've found at Skeptical Science. I don't visit very often and I click on very few of your linked references, so five is a worryingly high number, especially as Skeptical Science is widely promoted as a source of balanced and authoritative information. In my experience, it isn't.
    0 0
    Response: Vinny, I try to be balanced and accurate in how I represent papers but I've never said I'm infallible. But if I do make errors, I always correct them, I publicly admit my errors as I have done in the past with you and endeavour to not repeat the error. My primary goal is to further an understanding of climate by communicating the full body of evidence - misrepresenting the science is the last thing I want to do.

    In this case, I think it's a reach to say Stone 2010 is just about modelling therefore its inappropriate to talk about the model results. While there is still much work to be done on modelling the Greenland ice sheet, does that mean we're not allowed to talk about the model results until they're perfect? In any case, I'm attempting to represent the paper as written, not the comments of that referree's comment. I will point out also that I chose to describe their best case scenario, not the worst case - a bit of IPCC-like conservatism on my part.

    But the broader point here is that the Stone 2010 paper is just one result among many. There is also an empirical result (the paleoclimate study on over 6 metres sea level rise in the last interglacial), a semi-empirical result (mapping sea level rise to temperature to predict 75cm to 180cm by 2100. There's an alternative method of modelling glacier dynamics that finds sea level rise of 80 cm to 2 metres by 2100. These papers all use independent methods to arrive at the same conclusion - that Greenland is highly sensitive to sustained warmer temperatures and we can expect it to contribute significant sea level rise over this century and beyond.

    So while I appreciate your feedback about Stone 2010 - especially the fact that it has yet to be approved of which I wasn't aware of - can I suggest you don't lose sight of the bigger picture and that you survey the full body of evidence before coming to any conclusions of where Greenland is headed.
  13. "Although not completely collapsed, the 400p pmv ice-sheets for Figure 12b-e are somewhat reduced in the north of the island, with a reduction in ice volume compared with the modern day ice-sheet volume ranging between 20 to 41%. However, the scenario in Fig. 12f shows almost complete collapse at 400 ppmv with a reduction in ice volume of 81%." this is what the paper says. It's self evident that there's no misinterpretation whatsoever. I find only one (irrelevant) inaccuracy in what John wrote, it's not in 400 hundred years. The paper says that the results shown are after 400 hundred years of model integration, which is not the same thing as 400 years from now. As for the referee's comment, you're largely off target. Stones as well as John here did not make any projection of our future, as the referee advised. Both described what happens in a 400 ppmv world and none of them "predicted" a real world with a constant CO2 concentration at 400 ppmv for centuries. You may not like John's wording but the meaning is straightforward. Although not relevant in this particular case, i agree that research papers are often treated very badly around in the blogsphere.
    0 0
  14. Vinny Burgoo at 00:27 AM on 1 June, 2010 Stone 2010 updates the boundary conditions for modeling changes in Greenlands ice sheet with more realistic input data. Specifically bedrock and ice thickness, temperature and precipitation. They use as many recent real observations as possible. In doing so they discover that the modeling run steady state with the new boundary conditions overestimates the current amount of ice by 25% compared with actual observations. Re-tuning the model to obtain more realistic current ice levels and then projecting forwards in time under the 400ppm CO2 scenario, the revised model suggests greatly increased ice loss under all 5 parameter sets compared with the previous unadjusted model, which had “predicted” similar future ice volumes to today at 400ppm. In other words our previous best predictions (or model outputs if you wish to be pedantic) underestimated future ice loss under given conditions, and we now probably have a more realistic model. I’m not sure John has really used this paper out of context, but I’m guessing he’ll comment. If you have other specific cases of misrepresentation, it would be useful to point these out so that amendments can be made if needed. I certainly don’t mind being corrected if it is shown I’ve misunderstood something, and this is probable if I stray from my areas of expertise. I would also hope you adhere to the same critical standards when visiting other sites!
    0 0
  15. Riccardo, an accurate paraphrase can be misrepresentation if essential context is left out. Is this what our host did? Here's his paragraph in full: Climate modelling of the Greenland ice sheet predicts eventual collapse of the Greenland ice sheet if CO2 levels go over 400 parts per million (ppm). We're currently at 392 ppm. At 400 ppm, they predict that over the next 400 years, the ice sheet will lose between 20 to 41% of its volume (Stone 2010). This is equivalent to roughly 1.4 to 2.8 metres of sea level rise just from Greenland. Three things. (1) JC used Stone 2010 to collapse 'eventual' to '400 years'.(Does anyone know who 'they' are?) Why? (2) Stone 2010 is still in the middle of the peer-review process, so what's it doing on a website that makes such a big deal out of peer-review? (3) The Stone 2010 findings about volume-loss weren't predictions. They came from low-resolution tests of the performance of models that had been re-tuned to make them work with more up-to-date data.
    0 0
  16. Peter Hogarth, the Stone 2010 study doesn't show that 'we now probably have a more realistic model' It comes close to implying that but let's wait until it's finished passing through the peer-review process. I mentioned the other issues here on SS. (JC, to his credit, swiftly removed the links.)
    0 0
  17. Vinny Burgoo at 04:23 AM on 1 June, 2010 1) "They" are Stone, Lunt, Rutt, and Hanna and to quote from their paper "These simulations were run for time integration of 400 model years" 2) Yes, it's "in" peer review, reasonably common to cite papers in review, as long as you track any corrections or retractions. Your comments are rather unwarranted therefore. 3) I don't see the big deal in updating science/models with better data (some of the original bedrock and ice thickness data was more than thirty years old), and models (I would hope) get more accurate as we build up data to feed them. I cannot see how any rational person can imagine a model being less realistic with real observations and more recent data put into it. Some of the justification for Stone 2010 was that the reality of recent observed mass loss was more than the models were estimating, so the emphasis is warranted and "appropriate". I sense you should be backpedalling?
    0 0
  18. John, should this post be a response to "Greenland has only lost a tiny fraction of its ice mass"?
    0 0
    Response: Yes, it should. Why hasn't it? Because I forgot to add it! Thanks for the reminder, have now added the 115th skeptic argument, "Greenland has only lost a tiny fraction of its ice mass".

Prev  1  2  

You need to be logged in to post a comment. Login via the left margin or if you're new, register here.


The Consensus Project Website

THE ESCALATOR

(free to republish)


© Copyright 2024 John Cook
Home | Translations | About Us | Privacy | Contact Us