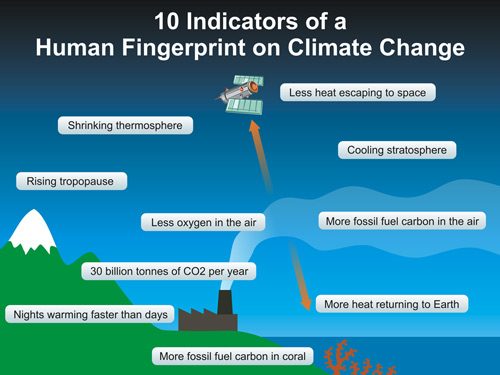
10 Indicators of a Human Fingerprint on Climate Change
Posted on 30 July 2010 by John Cook
The NOAA State of the Climate 2009 report is an excellent summary of the many lines of evidence that global warming is happening. Acknowledging the fact that the planet is warming leads to the all important question - what's causing global warming? To answer this, here is a summary of the empirical evidence that answer this question. Many different observations find a distinct human fingerprint on climate change:

To get a closer look, click on the pic above to get a high-rez 1024x768 version (you're all welcome to use this graphic in your Powerpoint presentations). Or to dig even deeper, here's more info on each indicator (including links to the original data or peer-reviewed research):
- Humans are currently emitting around 30 billion tonnes of CO2 into the atmosphere every year (CDIAC). Of course, it could be coincidence that CO2 levels are rising so sharply at the same time so let's look at more evidence that we're responsible for the rise in CO2 levels.
- When we measure the type of carbon accumulating in the atmosphere, we observe more of the type of carbon that comes from fossil fuels (Manning 2006).
- This is corroborated by measurements of oxygen in the atmosphere. Oxygen levels are falling in line with the amount of carbon dioxide rising, just as you'd expect from fossil fuel burning which takes oxygen out of the air to create carbon dioxide (Manning 2006).
- Further independent evidence that humans are raising CO2 levels comes from measurements of carbon found in coral records going back several centuries. These find a recent sharp rise in the type of carbon that comes from fossil fuels (Pelejero 2005).
- So we know humans are raising CO2 levels. What's the effect? Satellites measure less heat escaping out to space, at the particular wavelengths that CO2 absorbs heat, thus finding "direct experimental evidence for a significant increase in the Earth's greenhouse effect". (Harries 2001, Griggs 2004, Chen 2007).
- If less heat is escaping to space, where is it going? Back to the Earth's surface. Surface measurements confirm this, observing more downward infrared radiation (Philipona 2004, Wang 2009). A closer look at the downward radiation finds more heat returning at CO2 wavelengths, leading to the conclusion that "this experimental data should effectively end the argument by skeptics that no experimental evidence exists for the connection between greenhouse gas increases in the atmosphere and global warming." (Evans 2006).
- If an increased greenhouse effect is causing global warming, we should see certain patterns in the warming. For example, the planet should warm faster at night than during the day. This is indeed being observed (Braganza 2004, Alexander 2006).
- Another distinctive pattern of greenhouse warming is cooling in the upper atmosphere, otherwise known as the stratosphere. This is exactly what's happening (Jones 2003).
- With the lower atmosphere (the troposphere) warming and the upper atmosphere (the stratosphere) cooling, another consequence is the boundary between the troposphere and stratosphere, otherwise known as the tropopause, should rise as a consequence of greenhouse warming. This has been observed (Santer 2003).
- An even higher layer of the atmosphere, the ionosphere, is expected to cool and contract in response to greenhouse warming. This has been observed by satellites (Laštovi?ka 2006).
Science isn't a house of cards, ready to topple if you remove one line of evidence. Instead, it's like a jigsaw puzzle. As the body of evidence builds, we get a clearer picture of what's driving our climate. We now have many lines of evidence all pointing to a single, consistent answer - the main driver of global warming is rising carbon dioxide levels from our fossil fuel burning.


 Arguments


Wilmer_T @100,
The paper you refer to is Varotsos & Efstathiou (2019) 'Has global warming already arrived?', the latest serving from a pair of nonsense-writers. Concerning increased height of the tropopause (fingerprint #9), this is found occurring in climate models and within atmispheric measurements, as shown by Santer et al (2001) cited by the OP above and this finding continues to be observed (eg Xian & Homeyer 2018).
Varotsos & Efstathiou ignore this serious work entirely and instead use UAH TP satellite data to assert there is no increase in tropopause height because there is no increasing trend in UAH TP. The use of such data is mind-blowingly stupid, as worthless as using a twelve inch ruler to measure the width of a human hair. UAH TP does not measure tropopause temperature. It measures a wide range of temperatures from the surface up to 24 km. Thus it is measuring the cooling stratosphere as well as the warming troposphere, two strong signals which will overwhelm entirely any tropopause tempoerature trend. The figure below is sourced from Spencer at UAH.
MA Rodger @101 ,
Quite so. The Varatsos paper is a fine lot of nonsense !
Published in "Journal of Atmospheric and Solar-Terrestrial Physics", home of Scarfetta's astrological mathturbations. That should have been a red flag. Thanks MAR.