Climate Science Glossary

Term Lookup

Enter a term in the search box to find its definition.

Settings

Use the controls in the far right panel to increase or decrease the number of terms automatically displayed (or to completely turn that feature off).

Term Lookup

Settings


All IPCC definitions taken from Climate Change 2007: The Physical Science Basis. Working Group I Contribution to the Fourth Assessment Report of the Intergovernmental Panel on Climate Change, Annex I, Glossary, pp. 941-954. Cambridge University Press.

Home Arguments Software Resources Comments The Consensus Project Translations About Support

Bluesky Facebook LinkedIn Mastodon MeWe

Twitter YouTube RSS Posts RSS Comments Email Subscribe


Climate's changed before
It's the sun
It's not bad
There is no consensus
It's cooling
Models are unreliable
Temp record is unreliable
Animals and plants can adapt
It hasn't warmed since 1998
Antarctica is gaining ice
View All Arguments...


Username
Password
New? Register here
Forgot your password?

Latest Posts

Archives

The Past and Future of the Greenland Ice Sheet

Posted on 31 July 2010 by Ned

Guest post by Ned

The Greenland ice sheet has a negative mass balance, meaning that it is losing ice (Velicogna 2009, Jiang 2010).  This loss occurs because the gain of new ice (in the form of snowfall within the ice sheet's interior zone of accumulation) cannot keep up with the rapid loss of ice through melting and the discharge of ice by marine terminating outlet glaciers (van den Broeke 2009).  Figure 1 shows the overall downward trend in the ice sheet's mass:
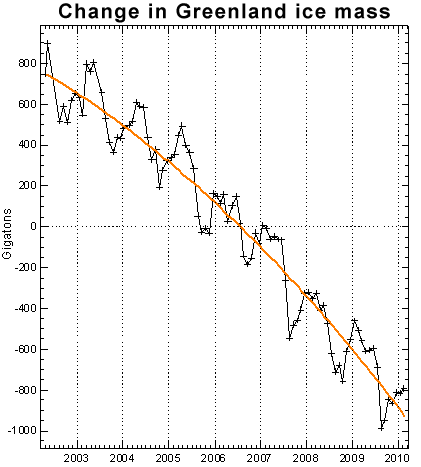

Figure 1: Greenland ice mass anomaly (black). Orange line is quadratic fit (John Wahr).

As recently as the 1980s Greenland's ice was probably more or less in equilibrium (Rignot 2008, Jiang 2010). But by the late 1990s and early 2000s this ice began to retreat, and the rate of retreat may be accelerating (Velicogna 2009, van den Broeke 2009).  Some claim that there's no need to worry about this, since only a tiny fraction of the total ice mass is being lost each year.  Others point out that the accelerating rate of loss means that there may be trouble ahead

Who is right, and how can we tell?  There are two ways of answering this question - we can look at the history of the Greenland ice sheet to see whether past episodes of warmth have led to extensive loss of ice, and we can use physical ice sheet models to predict the future behavior of Greenland's ice in a warming climate.

Pleistocene history of the Greenland ice sheet

 A new paper published this month in Quaternary Science Reviews (Alley et al. 2010) provides a very comprehensive overview of the history of the Greenland ice sheet over the past half-million years.  In general, the further back we look in time, the less certainty there is about the condition and extent of Greenland's ice.

Paleoclimate scientists divide the Quaternary cycles of glacial cooling and interglacial warmth into a series of Marine Isotope Stages (MIS).  The Holocene, the current warm stage in which our civilization has arisen and flourished, is MIS-1.  The most recent glacial episode (from approximately 110,000 to 14,000 years ago) is divided into MIS-2, -3, and -4.  The last previous interglacial, from 130,000 to 110,000 years ago, is referred to as MIS-5e.  Looking back further in time, glacial and interglacial episodes alternate, with MIS-6, -8, and -10 being glacial and MIS-7, -9, and -11 being interglacial. 

Note that the earliest of these interglacial episodes (MIS-11, around 400,000 years before present) is believed to be the best analog to our current MIS-1 interglacial climate, based on the geometry of the Earth's orbit (Berger and Loutre, 1991).

History of the Greenland ice sheet prior to the last interglacial:  Greenland's ice is believed to have shrunk during warm interglacial episodes MIS-11, -9, and -7.  During MIS-11, the most similar to our current interglacial, sea levels were much higher, probably enough to necessitate the near-total loss of Greenland's ice (Alley 2010), and ancient DNA found at the bottom of ice cores likewise suggests an ice-free Greenland at this time (Willerslev 2010).  Likewise, during glacial advances MIS-10, -8, and -6, Greenland's ice expanded and global sea levels dropped.  The greatest expansion of ice may have occurred during MIS-6, just prior to the last interglacial (Alley 2010).

Greenland during the last interglacial (120,000 years before present):   The Greenland ice sheet did not entirely disappear during MIS-5e, though it was smaller and steeper.  There is no ice predating MIS-5e at the bottom of cores from south, northwest, and east Greenland, but older ice is present in central and north-central Greenland ice cores, where (based on the gas content of bubbles in the ice) it appears to have been close to or slightly thinner than today's ice sheet (Alley 2010).  Figure 2 shows a model comparison of today's ice sheet with the ice sheet during MIS-5e. 
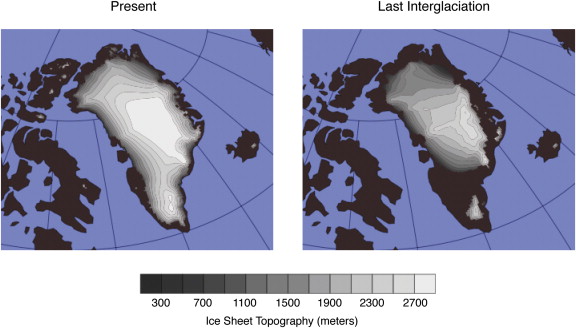
 

Figure 2: Modeled configuration of the Greenland Ice Sheet today (left) and in MIS 5e (right), from Otto-Bliesner (2006).

Alley (2010) conclude that it is probable that the loss of ice from Greenland during this time period contributed approximately 3–4 m to global sea levels, in response to a local warming of around 3°–4 °C in Greenland.  This nicely fits with our understanding that sea levels were at least 6 m higher that today;  the remainder of that rise would have come from the loss of ice in West Antarctica, mountain glaciers, and thermal expansion of seawater.

The last 100,000 years:   The Greenland ice sheet expanded during the final Pleistocene glacial advance (MIS-4, -3, and -2), until around 24,000 years before present, when it covered an area 40% larger than its current extent.  With the end of this last glacial episode the world warmed, the other large continental ice sheets in North America and Eurasia retreated, sea levels rose by tens of meters, and Greenland's ice sheet shrunk significantly. However, superimposed on this broad pattern of expansion and contraction were a large number of shorter-duration (millennial-scale) increases and decreases in ice mass, generally associated with changes in North Atlantic circulation and other regional climate transitions. 

The future of the Greenland ice sheet

Stone (2010) have used models to simulate the likely future loss of ice from Greenland in response to anticipated future warming.  The loss of most of the ice sheet would likely occur at atmospheric CO2 concentrations somewhere between 400 and 560 ppm, a rather disturbing finding given that we are currently at 392 ppm and will probably exceed 560 ppm later this century, as shown in Figure 3. 
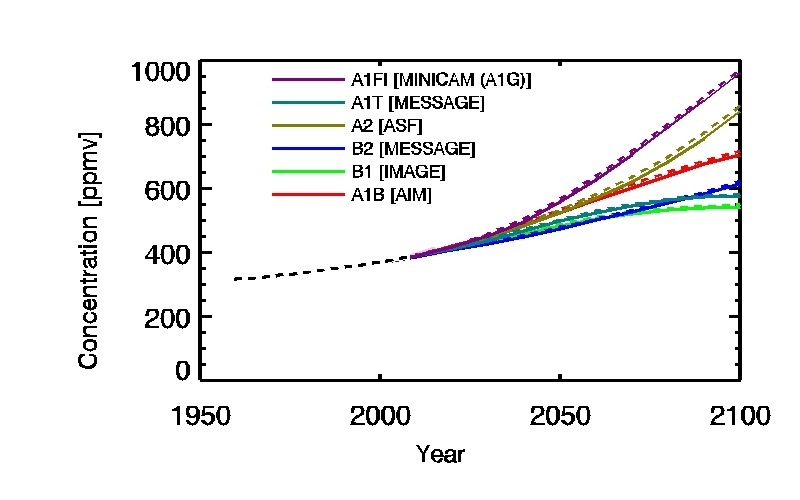
 

Figure 3: Atmospheric CO2 concentrations as observed at Mauna Loa from 1958 to 2008 (black dashed line) and projected under the 6 SRES marker and illustrative scenarios.  From IPCC.

This loss of ice from Greenland alone would be enough to raise sea levels by roughly six meters.   This process would probably take centuries or millennia.  The fact that Greenland was largely free of ice during the previous interglacial episode MIS-11 (Alley 2010) confirms that this is not an unrealistic scenario.

Some people find the subject of post-2100 climate changes rather abstract.  In contrast, 2100 itself is not that distant -- based on life expectancy data, the average girl born in Japan in 2015 will still be living in 2100.  So what are the likely outcomes for Greenland (and global sea level) over the remainder of this century? 

An accurate answer to this question requires consideration of the physical constraints on the discharge of ice from Greenland into the surrounding ocean.  Figure 4 shows some of these constraints, including the locations of marine terminating glaciers and the fraction of Greenland's bed that is below sea level.  Realistic modeling of the kinetics of glaciers suggests that a total increase in sea level of 0.8 m from all sources is likely by 2100, with increases of up to 2 m possible but increasingly unlikely (Pfeffer 2008).  This matches closely the results of another semi-empirical study (Vermeer and Rahmstorf 2009) of the relationship between temperature and sea level. 

The uncertainty in this range mostly relates to the rate at which ice is lost through calving by Greenland's marine-terminating outlet glaciers; the surface mass balance (between precipitation and melting/runoff) is much more predictable.  The 0.8 to 2 m range of global sea level rise by 2100 would imply 7.1 cm of sea level rise from Greenland's surface mass balance, plus 9.3 to 46.7 cm from ice discharged into the ocean by Greenland's outlet glaciers (Pfeffer 2008). 
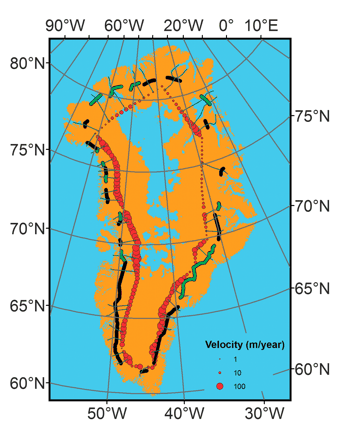
 

Figure 4: Map showing Greenland and outlet glacier gates; marine-based gates are shown as dark green and nonmarine as black. Regions below sea level are colored blue. Ice velocities at ~2000 m elevation shown by red dots (Pfeffer 2008).

In conclusion, a pessimistic but reasonable scenario would produce the melting of somewhere around 5% of the Greenland ice sheet by 2100, contributing 16 to 54 cm to global sea level rise (which in turn would then total 80 cm to 2 m from all sources).  However, at that point the collapse of Greenland's ice sheet would just be getting started - failure to constrain CO2 concentrations below 400-560 ppm would almost certainly lead to the near-total loss of the ice sheet, as we have seen from both model results and comparison to the MIS-11 interglacial climate of 400,000 years ago.

0 0

Printable Version  |  Link to this page

Comments

Prev  1  2  

Comments 51 to 72 out of 72:

  1. KR - It's not often I agree with a skeptic, however BP is correct about the Arctic being warmer during the Holocene Optimum, due to the Earth's axial tilt being greater than now, and it's closest approach to the sun coinciding with the Northern Hemisphere summer. Globally, however it was much cooler than present. I'll track down a paper on it, I've read.
    0 0
  2. BP, DappledWater - fair enough, I appear to have been quite incorrect about the temperature distributions. However: What I'm reading on the Holocene temperature distributions is that the Northern Hemisphere was much warmer, while the Southern Hemisphere was considerably colder. What I've found here (Vinther et al 2009) and here (Kelly 2009?) seem to indicate that the Greenland ice sheet receded 10's of kilometers during the Holocene, with associated thinning and mass loss. Sea levels rose considerably over the Holocene, but only to present values - perhaps the remainder remained locked up in the (much colder) Antarctic? The paleo data on Greenland ice recession certainly indicates some sensitivity to temperature.
    0 0
  3. KR, here's that paper Simulating the Holocene climate evolution at northern high latitudes using a coupled atmosphere-sea ice-ocean-vegetation model And an older paper dealing with orbital effects Variations in the Earth's Orbit:Pacemaker of the Ice Ages And yes, the Greenland ice sheet is very sensitive to temperature, hence the rapid melt currently occurring at it's margins.
    0 0
  4. #53 Dappledwater at 09:57 AM on 21 August, 2010 here's that paper Thanks. Section 4 Comparison with proxy data of Renssen 2004 is a good review article in itself (lots of references). Otherwise the paper shows the usual bad habit of identifying computational model runs with experiments so prevalent in climate science. In reality what they've done is a Gedankenexperiment at best, although this kind of computer game lacks the conceptual clarity traditionally associated with the term. Anyway, several thousand years ago the Arctic was considerably warmer indeed than it is today. However, it would be a mistake to assume the Holocene Climatic Optimum was restricted to the Arctic. 2004 Nature, 431, 56-59 DOI: 10.1038/nature02903 Decline of surface temperature and salinity in the western tropical Pacific Ocean in the Holocene epoch Stott, L., Cannariato, K., Thunell, R., Haug, G. H., Koutavas, A., Lund, S.
    0 0
  5. Sorry, looks like I've mixed up links. This is Stott 2004. The link above is to Conroy 2008, which is about holocene precipitation history of the Eastern Pacific, based on a Galapagos lake sediments.
    0 0
  6. BP, the Stott graph shows SST cooling from 11 to 10 kyr BP onwards, whereas the Greenland ice core record has a thermal optimum between 8 to 6 kyr BP. There is also evidence of the Northern coast of Greenland being free of sea ice between 8.5 to 6 kyr BP. See here beach ridges, striated boulders & marine sediment
    0 0
  7. Berényi Péter at 09:21 AM on 20 August, 2010 “SST was more than 2°C above its present value for several thousand years with no adverse effect on the Greenland ice sheet” The second part of this statement is doubtful. One of the points of this post is that there is plenty of evidence and peer reviewed research which shows that the Greenland Ice Sheet volume has varied in step with the NH high latitude temperature variations in the past, see Vinther 2009. Areas at the ice margins may have completely melted over periods as short as decades (Alley 2010 cited above).
    0 0
  8. Berényi Péter at 01:05 AM on 21 August, 2010 You state: “However, people here are denying both air and sea surface temperatures were considerably warmer in the Arctic during the Holocene Climatic Optimum than they are today just to make the present feeble warming unprecedented and alarming” I do not think this is generally being denied, though we should quantify “considerably warmer”. The high resolution ice core data from Greenland and nearby (eg GISP2, NGRIP, Agassiz) is proxy evidence that Northern Greenland temperatures were up to 3 degrees warmer around 8000 years ago than the average for the 20th century, (your suggestion of regional variations is also validated by the evidence, eg Agassiz shows a more pronounced “Holocene Climactic Optimum”). The Bednarski 1989 paper you cited, and many other more recent ones also provide convincing circumstantial evidence (such as driftwood deposits) that at least some of these coastal Arctic areas which are now ice bound were bounded by areas of open water for at least some periods since the last glacial. This is generally accepted and is consistent with the proxy temperature data. The current global decadal temperature trend is upwards, and appears “amplified” in the high latitude NH. If the current or centennial trend is sustained as modeling suggests, Greenland temperatures will exceed post glacial Holocene temperatures in a relatively short timescale. The word “feeble” is perhaps inappropriate given the likely persistent nature of GHG forcing. The recent Arctic temperature rise is not unprecedented over geological timescales, but is highly significant compared to the past 2000 year proxy records (see Kaufman 2010 update and the zoomed in ice core record from Agassiz (Vinther 2009) and GISP2 (from Alley 2004 update). It should be emphasized, that the orbital parameter forcing which is thought to have driven the gradual fall in NH temperatures since the post glacial temperature maximum is not global in effect, it is not clearly apparent in the deep sea sediment alkenone temperature proxy records for much of the rest of the globe (as is clear in Rimbu 2003) and is not apparent in the Antarctic ice core records. The Greenland Ice Sheet mass is currently diminishing at an accelerating rate due to localized warm waters and warm currents transported from lower latitudes Hannah 2009, Di Iorio 2009, Straneo 2010, Rignot 2010 as well as recent rapidly warming Arctic air temperatures. The recent rapid change in positive forcing from increasing anthropogenic GHGs is a new factor not present in previous glaciation/deglaciation cycles. It is effectively a global effect (rather than a high latitude effect such as NH insolation) – which combines with the effects of other forcings. The oversimplistic point you make about higher relative NH insolation forcing levels in the past does not strictly hold. Perhaps more importantly, the massive ice sheets that covered much of the NH in the last glacial period did melt (in most places completely) over the “deglaciation” time span, and we know rapid changes in temperature have been triggered by a combination of the slow change in solar forcing combined with positive feedbacks possibly from changes in the Atlantic Meridional Overturning Circulation and/or changes in GHG. This shows how sensitive our climate can be to proportionally small changes in forcing. I also do not expect the massive central Greenland ice sheet to vanish overnight, but the relatively rapid recent increased rate of loss is of legitimate concern and should not be belittled.
    0 0
  9. #57 Peter Hogarth at 01:18 AM on 22 August, 2010 One of the points of this post is that there is plenty of evidence and peer reviewed research which shows that the Greenland Ice Sheet volume has varied in step with the NH high latitude temperature variations in the past, see Vinther 2009 Yes, no question about that. However, it is the rate of change we are talking about here. I have copied Figure S2 b here from the Supplementary information to Vinther 2009. As you can see depositional elevation over the Greenland ice sheet has decreased by 200 m during 8 millennia when both local air and sea surface temperatures were 2-3°C higher than today. That translates to a rate of -2.5 m/century. The area of the ice sheet is about 1.78×10⁶ km2. Therefore the century scale loss of ice volume was 4400 km3 what makes 4000 km3 meltwater. Surface area of all the seas is 3.6×10⁸ km2, therefore it implies an eustatic sea level rise at a rate of about 11 mm/century. Hardly alarming, even if we take into account that holocene melt rate was highly variable, for short periods it could have been 3-4 times the average. Eight thousand years of ice sheet response is a bit better sample from a climatic point of view than a decade. You guys are making a fuss about weather noise.
    0 0
  10. #60 Peter Hogarth at 07:18 AM on 22 August, 2010 That is, the 10,000 year elevation change shown here is upwards (crustal uplift), rather than downwards (ice loss), as you have incorrectly interpreted it to be. No, it is not. You are surely not trying to tell us total gas content of an ice core decreases with increasing atmospheric pressure at depositional elevation. and I am not “you guys” Sorry for that, sir. It will never happen again.
    0 0
  11. Berényi Péter at 06:03 AM on 22 August, 2010 Yes, my first comment was released in haste and was incorrect, apologies (I was looking at the bedrock uplift data for Agassiz and Renland, which amount to over 100m and around 300m respectively in the same period). I think we have to read the whole paper rather than making fast judgements. As you know, the percentage of d18O in the gas trapped in the ice core is used as a temperature proxy. It must be corrected for altitude (and latitude) hence an estimate of elevation at deposition time is required. Assuming similar d18O histories and known elevation history at one site allows past elevation at nearby sites to be more accurately constrained. Glacial Isostatic Adjustment has also to be factored in. Your calculations are therefore dubious (but at least not upside down...) The difference between elevation histories at core sites in the centre of the Greenland ice sheet and the margins gives evidence that the loss at the margins of the ice sheet is very sensitive to temperature changes and these margins have responded rapidly in the past. This is analogous to what we are currently measuring and seeing. The recent reversal in the long term downwards Arctic temperature trend (Kaufman 2009 etc), appears to require more than is possible from natural variations or forcings, and Vinther argues in his conclusion that relatively small temperature changes could lead to greater mass losses than previously thought. Vinther 2009 states: “Greenland ice sheet (GIS) is an important concern, especially in the light of new evidence of rapidly changing flow and melt conditions at the GIS margins”. I agree. These recent mass losses are not “weather noise”.
    0 0
  12. #61 Peter Hogarth at 09:46 AM on 22 August, 2010 Your calculations are therefore dubious Not very much. According to Simpson 2009 between 10000 BP and 3000 BP the average volume change of the Greenland ice sheet is about -5700 km3/century. It translates to an eustatic sea level rise rate of 15 mm/century, still not alarming. The fastest loss rate they show is about -8000 km3/century between 5000 BP and 4000 BP. For the sea level it is still not more than 22 mm/century. As present ice loss rate is supposed to be much faster than anything seen during the early holocene when arctic temperatures were higher than now, it is either measurement error or a transient which can not last for long (a "weather event"). Greenland is very interesting, but rest assured, not dangerous for coastal cities. BTW, I have just found something curious. It is not immediately related to Greenland, but to the wider context of glacial - interglacial transition. As the great continental ice sheets of America and Europe melted, sea level rose by about 120 m. This added water displaced an equal volume of atmosphere, which increased air pressure over land everywhere on the globe by about 1%, except at former ice margins where uplift of land was larger than that of the atmosphere due to postglacial rebound. The pressure increase translates to a 0.5°C global land surface warming via lapse rate. This additional heating have not occurred over the oceans, so it must have had a pretty large effect on global circulation patterns. Anyway, it would deserve a closer look and somewhat more accurate calculations.
    0 0
  13. Unfortunately the Simpson 2009 link above is not correct. Here is a better one. Quaternary Science Reviews 28 (2009) 1631-­1657 doi:10.1016/j.quascirev.2009.03.004 Calibrating a glaciological model of the Greenland ice sheet from the Last Glacial Maximum to present-day using field observations of relative sea level and ice extent Matthew J.R. Simpson, Glenn A. Milne, Philippe Huybrechts, Antony J. Long
    0 0
  14. BP, I'm trying to grasp how the volume of water that was on land and then moved to the ocean could cause a change in air pressure. Was this entirely due to rebound? (for that matter, I'll have to look up if rebound is actually conservative; that is to say, does what squishes down cause something to bulge up somewhere else? I find I don't really know or if I did I've forgotten...)
    0 0
  15. Berényi Péter at 13:23 PM on 22 August, 2010 Thanks for fixing the link. I had not seen the Simpson paper, but at first glance fair to say your adapted chart is a simplification from their models? I'll digest the paper before drawing further conclusions. I dont think Ned has suggested that current ice loss is greater than anything seen in the early holocene... I think the fundamental argument is that current loss is not a transient event but a recently emerged and ongoing significant loss trend. As many researchers have commented there is little sign of any known factor which will slow it down in the near future (though I recall future shutting down of AMOC has been modelled).
    0 0
  16. Given that increased ocean temperatures are helping to drive calving would it be reasonable to assume that once all the 'coastal' ice has broken away the rate of ice loss on Greenland (and Antarctica) should drop significantly? Or would exposed beach lead to greater melt and runoff? Have the regions of Greenland which are NOT covered by ice been seeing significant mass loss from the nearby portions of the ice sheet in recent years? From what I can tell the various 'mass balance' maps of Greenland the mass loss seems to extend well inland - presumably past any region that seawater temperatures should be impacting. I'm trying to get a handle on whether we'd expect Greenland ice loss to continue accelerating indefinitely or if there will be a slowdown once the coastal ice is gone.
    0 0
  17. #65 Peter Hogarth at 16:58 PM on 22 August, 2010 I dont think Ned has suggested that current ice loss is greater than anything seen in the early holocene... According to Figure 1 in the article current rate of ice loss is 26000 km3/century. That's three times faster than average rate of loss in any millennium in the last ten thousand years. So yes, he did suggest such a thing. In the three millennia before the beginning of the Holocene (15-12 ka ago) ice loss was faster, 20000-60000 km3/century (depending on model details), but that must have been caused by sea level rise induced breakup of ice shelves around Greenland, not local temperatures. Currently we do not have any large ice sheets melting far away from Greenland that could cause fast eustatic rise not compensated by local crustal rebound, neither have we extensive thick ice shelves around the island prone to sea level rise induced breakup. Therefore that kind of thing can not possibly occur now. Anyway, the "alarming" melt has started only ten years ago and has accelerated to its present rate in the last couple of years. Anything shorter than three decades is surely weather, not climate. Greenland (as opposed to East Antarctica) is a "wet" icesheet, not a "dry" one. Mass balance depends on precipitation to a high extent. With more open water around in the region increasing trend of snow accumulation of the last several decades should resume sooner or later. As many researchers have commented there is little sign of any known factor which will slow it down in the near future If so, tell them summer temperatures north of 80N are dwindling at an alarming rate during the last two decades. And this freezup in the high Arctic is clearly accelerating. In the meantime tell the Chinese to stop emitting untold amounts of soot in the atmosphere that's carried off right into the Arctic by prevalent winds. Soot pollution is not a necessary consequence of burning stuff. To make combustion more efficient and filtering smoke properly is not that expensive, the technology is ready, it is already done in any sane country. Best Hope for Saving Arctic Sea Ice Is Cutting Soot Emissions, Say Researchers While we are at it. Going for a ban on small diesel engines (a great source of tiny black carbon particles) and installing proper filters on large ones (including ship engines) is also a possible line of action, far more promising than the futile war on CO2.
    0 0
  18. Peter Hogarth wrote: I dont think Ned has suggested that current ice loss is greater than anything seen in the early holocene... and Berényi Péter replied: According to Figure 1 in the article current rate of ice loss is 26000 km3/century. That's three times faster than average rate of loss in any millennium in the last ten thousand years. So yes, he did suggest such a thing. Figure 1 shows the change in mass balance of the Greenland ice sheet over the past decade, as measured by GRACE. If Berényi Péter wants to claim that this rate of change is greater than the maximum decadal-scale rate of change during the early Holocene, that's his claim, not mine. I don't think that citing millennial-scale averages would be a good way to justify that claim. I spent a fair bit of time working on the phrasing of that post, to ensure that I didn't make any claims for which there was not clear evidence. Probably the most important point from that post is that the Greenland ice sheet was quite a bit smaller during previous interglacials. Since the projected 21st-century global mean temperature increase of 3C implies an Arctic warming of more than 3C, this is reason for concern. Thus, it becomes urgent to answer the question of how rapidly the Greenland ice sheet will respond to the upcoming temperature increase. As I discuss in the latter part of the post above, Pfeffer 2008 suggests that via realistic ice dynamics Greenland could contribute 16 to 54 cm as its share of a global sea level rise of 0.8 to 2 m by 2100. This also seems to fit well with Vermeer and Rahmstorf 2009. So I don't think there's any realistic way we could produce an Eemian (MIS-5e) ice sheet by 2100. But we could take a substantial step in that direction, and 0.8 to 2 m of SLR will have quite high economic costs in many regions.
    0 0
  19. Berényi Péter at 20:28 PM on 22 August, 2010 The Simpson 2009 paper you cited is interesting. It presents results from “Huy2”, a complex three-dimensional thermomechanical model of the Greenland ice sheet, which has contraints adjusted for estimates of relative paleo-sea level derived from observations and also revised temperature estimates from the GRIP ice core. It is a revised version of “Huy1” from Huybrechts 2002. One of the conclusions is that early Holocene ice volume (and therefore overall Holocene volume loss to present) was greater than previously suggested, which suggests higher sensitivity of the Greenland ice sheet to temperature changes than previously thought. In this paper the authors state: "The reaction of the ice sheet to the Holocene Thermal Maximum may have produced a margin retreat of up to 80 km across the southwest sector of the ice sheet", and “Our results suggest that remaining discrepancies between the model and the observations are likely associated with non- Greenland ice load, differences between modelled and observed present-day ice elevation around the margin...” The paleo-elevation issue is a problem which Vinther 2009 attempts to address using the d18O values from several ice core sites to back-estimate (from the altitude relationship) -and more accurately constrain- elevation estimates. These results also resolve some previous disparities with bore-hole studies, bringing these proxy results closer. In doing so the results diverge significantly from previous so called “shallow ice approximation” based model results in that the elevation and probable ice thinning has been revised in Vinther 2009 to be greatest during the "Holocene Climactic Optimum", which may be an intuitive result. I have adapted the chart from Simpson 2009 to make it more comparable with that from Vinther 2009 shown later. Figure 1: Ice volume estimates from 3-D ice sheet models Huy 2 (black) and previous Huy 1 (grey), from Simpson 2009. The results from Simpson 2009 in terms of volume changes are of course not directly comparable with elevation changes, but the important result from Vinther is the likelihood of greater elevation (and again probably Ice volume) in the early Holocene, and thus again even greater sensitivity of ice loss to temperature changes. Figure 2: revised elevation from Vinther 2009 (black) vs various 3-D thermomechanical model outputs including Huy 1 (orange) from Vinther 2009. The revisions based on ice core proxy temperatures from the work of Vinther ties in to more recent modeling work ( Stone 2010) which uses much more up to date estimates of ice thickness and bedrock topography (compared with previous work such as Simpson 2009 or Lunt 2009 etc). The results from Stone et al suggest again a higher sensitivity to temperature and therefore greater potential changes in future for given temperature variations and CO2 concentrations than previously predicted (for example in IPCC 2007) As for sea level budget contribution due to melting of the Greenland Ice Sheet, you are correct that Simpson does suggest a relatively low averaged value for the early Holocene, but as suggested above, this is likely to be an underestimate. The most recent IPCC (AR4, 2007) value for Greenlands contribution (based on 1993 to 2003 range) were between between +0.14 to +0.28mm/yr. Updated estimates suggest an increase to +0.46mm/yr for the period 2000 to 2008, van den Broeke 2009, Velicogna, 2009, with estimates for the most recent period as high as +0.75mm/yr . In a recent review Cazanave 2010 gives an average of several recent estimates of Greenland Ice Sheet contribution between 2003 and 2007 of 0.5mm/yr. The Alley 2010 paper Ned cites above also has a pertinent chart of various recent estimates of sea level contributions which show apparent acceleration of loss and recent values well above 0.2mm/yr. There is also corroborating evidence of resultant accelerating North Atlantic (precision GPS measured) uplift in coastal bedrock Jiang 2010. Uncertainties in this uplift, and uncertainties due to the relatively short observation period and also different mass loss derivations from GRACE, are still apparent from some of the differing values (by potential factors of two) of ice mass loss in the recent work to date, as noted by Bromwich 2010 and Sorenson 2010. Nevertheless very recent estimates (published August 2010) trying to account for GPS measured uplift estimates still show large and recently accelerating Greenland ice mass loss, even if the absolute magnitude of these losses is yet to be quantified with precision, see: Khan 2010 and Wu 2010. It should be noted that these estimates are placed in the context of general consistency with data from other sources (with longer measurement periods of the variables used to estimate mass variation), and with updated models. There is little argument that the recent Greenland ice mass loss is highly significant and currently increasing. In summary, this does seem to be rather more than “noise”.
    0 0
  20. Berényi Péter at 20:28 PM on 22 August, 2010 On Black Carbon, I agree it is a more soluble problem than CO2, I will assemble some recent references (time permitting), but I believe most papers I have read place Black Carbon as below CO2 in importance. Am I correct in assuming the DMI chart you have shown is extracted somehow from the DMI images and not from the original data? I say this only because I have the data and cannot reproduce your chart. Have you defined melt season using some arbitrary thresholds? In all of my attempts to reproduce your chart, average temperature above 80 degrees N and melt season both show significant positive trends over the DMI measurement period - in agreement with independent temperature measurements from various satellites and published papers on surface records (again I’ll try to dig out references). You can check some of the actual DMI data values using the ERA40 re-analysis series which is virtually identical up to its end date and publicly accessible. I suspect you may not be integrating or averaging to derive your melt season values? You are also aware the near surface air temperature for the Ice cover in the Arctic Summer is constrained to just above melting point?
    0 0
  21. I just wanted to stress if both local atmospheric and sea surface temperatures were higher than today during the Holocene Climatic Optimum for thousands of years (they were) and the recent rate of ice loss is still considerably higher than any time after about 10 ka BP, then it is either a short transient ("weather") or there is something else at play here (soot?). In the past two centuries, the Arctic has warmed about 1.6 degrees. Dirty snow caused .5 to 1.5 degrees of warming, or up to 94 percent of the observed change, the scientists determined. 2007 J. Geophys. Res., 112, D11202, doi:10.1029/2006JD008003. Present‐day climate forcing and response from black carbon in snow Flanner, M. G., C. S. Zender, J. T. Randerson, and P. J. Rasch
    0 0
  22. Berényi Péter at 20:28 PM on 22 August, 2010 As promised, some thoughts on BC (Black Carbon) which I hope are of interest: Globally, over the past century, BC trends have risen, mainly due to low latitude contributions, with a possible tailing off after 1980. In line with previous work Kopp 2010 suggests our best current estimate of global effective Radiative Forcing due to BC is about 0.22 Wm−2. I do not want to downplay the role of BC in regions like the Himalayas, but this thread is about Greenland. Let us look at what the authors and co-workers of the paper you cite have actually said recently on the NH and Arctic regions: Flanner 2009: “Equilibrium climate experiments suggest that fossil fuel and biofuel emissions of BC+OM induce 95% as much springtime snow cover loss over Eurasia as anthropogenic carbon dioxide”; Hadley 2009: “Black carbon (BC) has been measured in snow and ice cores at levels that climate models predict are high enough to be the second leading cause in arctic ice melt and glacial retreat after greenhouse gas warming”; Zender 2009: “our GCM (General Circulation Model) simulations show that dirty snow can explain about 30% of the observed 20th century Arctic warming” Note so far we are talking in the main about simulations. Comparing modeled deposition results from measured observations Gilardoni 2010 we see good agreement in general, but not in the three Arctic sites selected (one of which is Alert, just off Northern Greenland), where measured equivalent BC levels are much lower than global averages. These sites show strong (5 to 10 times higher than background) annual BC peaks (to around 120ng/m3) through January, February and March, when insolation is relatively low. Lamarque 2010 - in support of more accurate simulations (some results shown for Greenland) has introduced a new 150 year global gridded dataset of anthropogenic and biomass burning aerosol emissions, and Hegg 2010 has reported detailed results from much higher spatial resolution measurements of light absorbing aerosols (including BC) in the Arctic. One surprising finding is that the main current source of Arctic BC is biomass burning, and not fossil fuels (as is the case in Eurasia). In the Canadian High Arctic in recent decades we see overall reductions in BC levels from the mid 1980s, with a shift in proportional contributions from Eurasia (due to emission controls) and the US Gong 2010. So what of Greenland? In the early 20th Century BC concentrations (from high resolution ice core evidence) were much higher, and may have changed the summertime surface energy budget by around 3Wm−2 McConnell 2007, however current levels are now significantly lower, and are also lower than global averages. At the same site Sulphate levels continued to rise until the 1980s in Greenland Lamarque 2010. Considering the early 20th century Greenland warming, these results are interesting and it is likely that anthropogenic aerosol effects contributed as has been noted previously by Wild 2009 and others, (see review of more than 20 recent papers introduced by Wild 2010) (a) Monthly (black) and annual (red) measured BC levels at ice core site D4 in Greenland (71.4 N, 44 W) and (b) relative Winter/Summer levels from site D5, which is approximately 350km further south, from McConnell 2007 Given this evidence it is unlikely that BC contributes to the most recent increases in Arctic surface air temperature and Greenland ice margin melt rates, and is even more unlikely to contribute to warmer waters and warmer Ocean currents causing basal glacier outlet melt and overall accelerated mass loss in Greenland.
    0 0

Prev  1  2  

You need to be logged in to post a comment. Login via the left margin or if you're new, register here.


The Consensus Project Website

THE ESCALATOR

(free to republish)


© Copyright 2024 John Cook
Home | Translations | About Us | Privacy | Contact Us