Climate Science Glossary

Term Lookup

Enter a term in the search box to find its definition.

Settings

Use the controls in the far right panel to increase or decrease the number of terms automatically displayed (or to completely turn that feature off).

Term Lookup

Settings


All IPCC definitions taken from Climate Change 2007: The Physical Science Basis. Working Group I Contribution to the Fourth Assessment Report of the Intergovernmental Panel on Climate Change, Annex I, Glossary, pp. 941-954. Cambridge University Press.

Home Arguments Software Resources Comments The Consensus Project Translations About Support

Bluesky Facebook LinkedIn Mastodon MeWe

Twitter YouTube RSS Posts RSS Comments Email Subscribe


Climate's changed before
It's the sun
It's not bad
There is no consensus
It's cooling
Models are unreliable
Temp record is unreliable
Animals and plants can adapt
It hasn't warmed since 1998
Antarctica is gaining ice
View All Arguments...


Username
Password
New? Register here
Forgot your password?

Latest Posts

Archives

Has Global Warming Stopped?

Posted on 2 August 2010 by Alden Griffith

Guest post by Alden Griffith, creator of Fool Me Once, a new blog featuring video presentations explaining climate science. This blog post is a written version of his first video addressing the argument 'Global warming has stopped'.

Has global warming stopped? This claim has been around for several years, but received new attention this winter after a BBC interview with Phil Jones, the former director of the Climate Research Unit at the University of East Anglia (which maintains the HadCRU global temperature record).

BBC: Do you agree that from 1995 to the present there has been no statistically-significant global warming?
Phil Jones: Yes, but only just. I also calculated the trend for the period 1995 to 2009. This trend (0.12C per decade) is positive, but not significant at the 95% significance level. The positive trend is quite close to the significance level. Achieving statistical significance in scientific terms is much more likely for longer periods, and much less likely for shorter periods.

Those pushing the “global warming has stopped” argument immediately jumped on this as validation, and various media outlets ran with the story, e.g. “Climategate U-turn as scientist at centre of row admits: There has been no global warming since 1995” (Daily Mail).

Well, what can we take away from Dr. Jones’ answer? He says that the positive temperature trend is “quite close to the significance level” and that achieving statistical significance is “much less likely for shorter periods.” What does all of this mean? What can we learn about global temperature trends from the past 15 years of data?
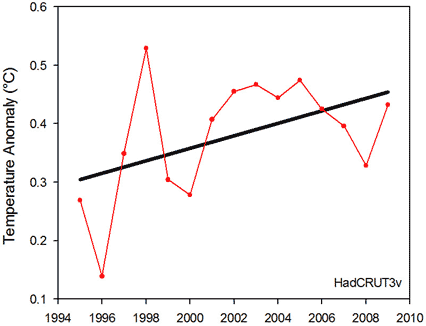

Figure 1: Global temperature anomalies for the 15-year period from 1995 to 2009 according to the HadCRUT3v analysis. The black line shows the linear trend.

First though, it’s worth briefly discussing what “statistically significant” means. This is referring to the linear regression test that informs our decision to conclude whether the slope of the trend line is truly different from zero. In other words, is the positive temperature trend that we observed really any different from what we would expect to see from just random temperature variation?  By convention, statistical significance is usually set at 5% (Dr. Jones has simply inverted it to 95%). This 5% refers to the probability that we would have observed such a positive trend if in reality there is no trend.  The lower this probability, the more we are compelled to conclude that the trend is indeed real.

Using the dataset available at the time, the statistical significance of the 15-year period from 1995 to 2009 is 7.6%, slightly above 5% (the most recent HadCRU dataset gives 7.1% for this period).

What can we conclude from the statistical test alone? If one was to make any real conclusion, it should probably lean toward there being a positive temperature trend (as the slope is quite close to being statistically significant). We certainly cannot strongly conclude that there’s no trend. Really though, we cannot conclude much at all from such a short time period. Although a 15-year period may seem like a long time, it is relatively short when thinking about changes in climate. So what to do? How can we tell if global warming has stopped or not? 

First we need to identify the important questions:

  1. Do 15 years tell us anything about the long-term temperature trend?
  2. What temperatures should we expect to see if global warming is continuing?

The first question is essentially putting the skeptics’ logic to the test. The logic is that a 15-year period without a statistically significant trend means that global warming has stopped, or at the very least that it contradicts a warming world. So let’s look further back and see if there are any other 15-year periods without a statistically significant trend:
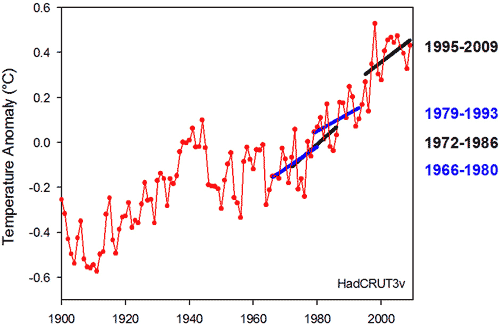

Figure 2: Global temperature anomalies since 1900 according to the HadCRUT3v analysis. The trend lines represent recent 15-year periods without statistically significant warming.

Lo and behold! If we just focus on the most recent period of rapid warming, we see several 15-year periods with trends that are "not significant at the 95% significance level" (actually, since 1965 there are 8 nonsignificant 15-year periods, several of which overlap, and 39 nonsignificant 15-year periods since 1900). So according to the logic, global warming keeps on stopping even though temperatures keep on rising. Clearly this makes no sense! That’s because 15 years of temperature data do not tell us much about temperature trends. Concluding that global warming has stopped from looking at the last 15 years is wishful thinking at best.

The second question is really what we should be asking: What temperatures should we expect to see if global warming is continuing? This is very easy to do. Let’s take the most recent warming trend beginning in 1960 and stop at 1994, just before the last 15-year period. Warming over this period is highly statistically significant (<0.0001%). We can then calculate what’s known as the 95% prediction interval. This gives us the range in which we would expect to see future temperature values if the trend is indeed continuing (i.e. if global warming is still happening at the same rate).
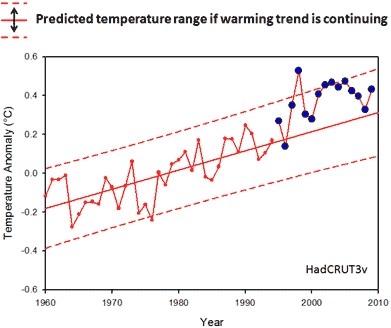

Figure 3: 95% prediction interval (dashed lines) if the linear trend from 1960-1994 is continuing. Temperatures from 1995 to 2009 are plotted in blue.

Lo and behold! The last 15 years are not only within this range, but temperatures are at the upper end of it. In fact, 1998, 2002, and 2003 were even warmer than the predicted range. If you do this analysis for the entire HadCRU time span (1850-2009) you can see that the last 15 years are almost entirely above the predicted range.
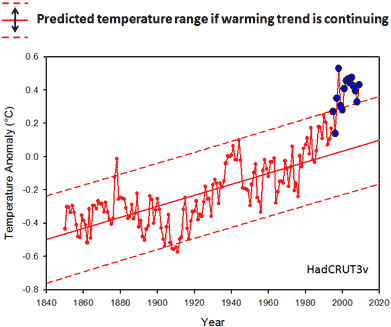

Figure 4: 95% prediction interval (dashed lines) if the linear trend from 1850-1994 is continuing. Temperatures from 1995 to 2009 are plotted in blue.

So here are two requirements for those wishing to conclude that global warming has stopped based on the interview with Phil Jones:

  1. Accept the backwards logic that allows global warming to keep on stopping while temperatures keep on rising.
  2. Ignore the real question of whether the last 15 years is consistent with a continued warming trend (which it is).

So no, global warming has not stopped. It takes some serious wishful thinking to say that it has.

[Lastly, I want to make the prediction that global warming will once again “stop” in 2013. Even if temperatures continue to rise over the next 3 years, the 15-year period from 1998 to 2012 will begin with the record setting 1998 El Niño year, which will make statistical significance unlikely. Beware, the return of the “global warming has stopped” argument!]

NOTE: be sure to check out a video presentation of this material at Fool Me Once.

NOTE: This post was updated on 11 Aug 2010. 

0 0

Printable Version  |  Link to this page

Comments

Prev  1  2  

Comments 51 to 79 out of 79:

  1. ABG - you made an excellent post here. Over-fitting the data is entirely too easy, and will usually give you bad results. You can always penalize fits of unknown data heavily by their polynomial order, increasing the penalty according to data variance, in order to avoid overfitting. But if you have any information on the underlying physical processes, use the simplest fit that goes through the center of variance. Otherwise (as you clearly show with your last figure) you're overfitting into la-la land.
    0 0
  2. fydijkstra, I calculated the power for your 1st graph (Cohen's f^2 as effect size), and I got 0.400 for the linear fit, and 0.389 for the 4th order poly fit. Aside from power though, poly regressions are just Taylor expansions about the data. Of course the R^2 is going to be lower as you increase the degree. You can use poly fits if you think there is a physical mechanism that shows a curvilinear relationship, you can go ahead and use it (and any other transformation). But because you're using it for such a short series (with decently noisy data), the poly fit gets great fits for the short term fluctuations instead of the trend. The poly fit that you have here is more reminiscent of the 1998 burst, instead of the trend. As a simple sensitivity analysis, you can change the value of 1998, and see the change in R^2 for the linear fits and the poly fits. I would bet the latter will be affected more strongly.
    0 0
  3. oops, that should read "Of course the R^2 is going to be higher as you increase the degree."
    0 0
  4. Hi Alden Good post but you do need to take some advice from a statistican on some of the language you use. Specifically relating to what significance and the null hypothesis means in the classical statistical approach. It is not a measure of the confidence in the value of some parameter or result. So in your first example, it's not that there is a 92.4% confidence in the result. That sort of language would make a classical statistican squirm. It's saying what if the data I see, are really generated by an underlying process where there is no trend, but where you see apparent trends because of the underlying variability in the data. In this case, 7.6% (or 76 out of 1000) of the cases in the long run would be consistent with the underlying trend being zero. Traditionally the mantra of p=0.05 would mean you would fail to reject the null hypothesis, but of course as you note, it's more complex than that. It may seem a small point, but the idea of classical significance being a % confidence in something is not correct
    0 0
  5. Hi Mike, I agree, and I'm well aware of how P values should be interpreted and what they really mean. I intentionally used language that might make a statistician squirm because I'm not trying to communicate to statisticians, but rather the public. The somewhat backwards logic of frequentist statistics is not all that easy to grasp for a lot of people at first. When communicating to the public, I think it's a lot easier to grasp the idea of 92.4% confidence than it is to interpret that there is a 7.6% probability of seeing the temperature trend that we did given the null hypothesis of no trend [a collective "huh?"]. While terminology is certainly important in science, it can really be a stumbling block in our notorious inability to actually communicate to the public. For the purposes of this post, I think saying 92.4% confidence is the way to go. -Alden
    0 0
  6. kstra at 06:03 AM on 3 August, 2010 Sorry if my previous comment was cryptic. To clarify and add further to what ABG has said, here is the HadCRUT3 chart with temperature values up to June 2010. I have used the same start date, and added the same Excel 4th order curve fitting process. I have also added error bars. The results are quite different (and just as inadvisable to use). As others have pointed out, this highlights several dangers when analyzing data in this way: 1) Fitting higher order curves is problematic when these fits are based on simple mathematical functions that are unlikely to represent or model complex climate variations. Simple trends are indicators, and should not be used as models and should not be extrapolated far. 2) For the end dates, up to date data should always be used (if available). For start dates, the most complete versions of the data should be used if possible, we shouldn’t cherry pick without justification. In this case the BBC asked a loaded question. 3) Deriving any trends from short time series can give misleading results. Caution and an appreciation of error bounds and physical processes should be applied. If we take the entire data series from 1850 to 2010, and fit a second order function, and a fourth order function, the respective R squared values are indistinguishable. This kind of analysis tells us only general things about the temperature records, such as temperature is increasing, the rise is statistically significant, and the trend is probably accelerating over the recording period.
    0 0
  7. ABG I think the point Mike was making is that saying "95% confidence" is inviting the public to think this means that the probability of the trend being positive is at least 95%, however that would not be correct. The classic fallacy of significance tests is to treat the p-value as being the probability that the null hypothesis is true, which is the same fallacy as implying that we have 95% confidence in the alternative hypothesis (assuming the null and alernative hypotheses are complementary). The frequentist definition of probability means that it is meaningless to talk of the probability of a hypothesis being correct, it has no long run frequency, it is either true or it isn't - it isn't a random variable. That is why frequentists have to talk of what you might expect from a large number samples from some population instead (i.e. it doesn't actually answer the question you want to ask). The same sort of problem arises in the interpretation of confidence intervals, it isn't correct to say that there is a 95% probability that the true value lies in the 95% confidence interval (even though that would be the natural interpretation of the phrase). Caveat emptor: I am a Bayesian, in part because I find the frequentist approach to confidence intervals so hard to understand and unintitive, so you would probably be better off with the opinion of an expert freqentist statistician for chapter and verse (wierd bunch that they are ;o), if I have got it all wrong, I'm happy to be corrected.
    0 0
  8. Dikran #58 "assuming the null and alternative hypotheses are complementary" I'm pretty sure that the alternative hypothesis is the logical oposite of the null by definition (i.e. H1 = not(H0) )
    0 0
  9. The analysis of Fdykstra doesn't seem proper to me. Of course, if one adds extra variables, the R2 increases - by definition. R2 should only be interpreted if several models have the same number of variables - without any multicollinearity and heteroscedasticity. Representing a number of observations with any line is no science. The error he mades is that R2 should only be used if one has a theory (explanatory mechanism whatsoever) to be tested - whereas in this case the analysis is aiming at observation - is it getting warmer or not. R2 is then unnessecary - significance level is the only relevant thing and as remarked before, the 5 or 10% significance level is a convention. It are the outer parts of the normal distribution for the number of times somethings is happening. And, as Phil pointed out, the time span is too short to fall within the outer borders of any significance level. I guess that some denialist with good statistical knowlegde has given this question to the reporter. Because everyone knows that the period is short in proportion to the increase of temperature. But Phil gave the possible answer and he stayed within the right area. Right he was, regarding the guns that were targeting him. He couldn't permit any mistakes.
    0 0
  10. By the same token, using excel before thinking is the same as using a calculator without knowledge of calculation by head. The discussion developed after FDykstra used excel is actually a waste of brainpower. The basic question is: are the temp observations during that period representing a rise in temperature or are they random? The proper, formal, based on the 95% confidence interval, answer is: no, and Phil said so. Accordingly, Fdykstra, manipulating statistics is no substitute of knowing what one is doing, as was said in college. Given the percentage Phil gave, actually even more proper, and knowing the low number of observations, that percentage, representing the area of the normal distribution, is pretty high, I would say scaring high, given the convention of 5 or 10% confidence interval. A low number of observations is able to give that high percentage...conclusions are around the corner.
    0 0
  11. #61: "are the temp observations during that period representing a rise in temperature or are they random?" Temperatures can't be random. If its hot now, its more likely to be hot a short while from now. Physical properties of water and air limit instantaneous rates of temperature change. Unless we know the underlying physics, how can we presume to say that any specific power function is any more than a mechanical fit through data points? How do we know quadratic is bad and quartic is good? Without an underlying model, all we can do is be descriptive of what's going on in the data. As an example from a prior post, The linear fit is virtually meaningless, but its the number everybody quotes as 'trend'. I'd be tempted to try an even power (concave up), but even that is meaningless -- as it would keep going up faster and faster forever. Even the most ardent warmist wouldn't make that claim! I've learned to prefer LOESS, an adaptive smoothing process, which produces results that are very similar in appearance to moving averages. If a rate of change is needed, a symmetric difference quotient of the smoothed values works wonders. From this graph, is it not reasonable to conclude that temperatures are rising faster during the last 50 years? And that's a conclusion that might just shed some light on where to look for an explanation.
    0 0
  12. John and the many constructive and erudite commentators: a really *superb* discussion and a thorough addressing of perhaps the most simplistic claim of denialists, that GW has stopped, and/or that cooling has set in. Luckily I was trained in econometrics, so can appreciate most of what you all have presented here. As a thoughtful reader, I would ask only that John or someone among you who is qualified relate the *rate* (meaning overall pace) of warming in the present era to what the ice cores and other sources tell us about the rate of temperature change in past periods. It has nothing to do with the thread, admittedly; it would simply be a useful addendum for those of us sharing the link to this post and discussion with non-readers. But job well done! Ahh, but now we all (again) face the dilemma: how do we make this clear understanding available to the key 250 million educated *busy* voters in the world-controlling democracies in a format and level of exposition they can understand, without requiring them to immerse themselves in our various arcane specialized fields? Or to read John’s fine blog, for that matter? Much more to the point in these days of harassment by popular charlatans out for media attention, how do we ensure these most-vital constituents have sufficient confidence in the work of dedicated climate and earth science professionals to carry the message of a human-dominated ecosystem in crisis to others, beginning with their own children and grandchildren? It is easy to dismiss these millions, saying they should know enough science to follow such a telling thread as this one. That fatuous response won’t help us, or more importantly, them, now.
    0 0
  13. In my comment #20 I showed that the data fit better to a flattening curve than to a linear line. This is true for the last 15 years, but also for the last 50 years. I also suggested a reason why a flattening curve could be more appropriate than a straight line: most processes in nature follow saturation patterns instead of continuing ad infinitum. Several comments criticized the polynomial function that I used. ‘There is no physical base for that!’ could be the shortest and most friendly summary of these comments. Well, that’s true! There is no physical basis for using a polynomial function to describe climatic processes, regardless of which order the function is, first (linear), second (quadratic) of higher. Such functions cannot be used for predictions, as Aldin also states: we are only speaking about the trend ‘to the present’. Aldin did not use any physical argument in his trend analysis, and neither did I, apart from the suggestion about ‘saturation.’ A polynomial function of low order can be very convenient to reduce the noise and show a smoothed development. Nothing more than that. It has nothing to do with ‘manipulating [as a] substitute of knowing what one is doing’ (GeorgeSP, #61). A polynomial function should not be extrapolated. So far about the statistical arguments. Is there really no physical argument why global warming could slow down or stop? Yes there are such arguments. As Akasofu has shown, the development of the global temperature after 1800 can be explained as a combination of the multi-decadal oscillation and a recovery from the Little Ice Age. See the following figure. The MDO has been discussed in several peer-reviewed papers, and they tend to the conclusion, that we could expect a cooling phase of this oscillation for the coming decades. So, the phrase ‘global warming has stopped’ could be true for the time being. The facts do not contradict this. What causes this recovery from the Little Ice Age, and how long will this recovery proceed? That could be a multi century oscillation. When we look at Roy Spencers ‘2000 years of global temperatures’ we see an oscillation with a wavelength of about 1400 years: minima in 200 and 1600, maximum in 800. The next maximum could be in 2200.
    0 0
  14. fydijkstra A few points: (i) just because a flattening curve gives a better fit to the calibration data than a linear function does not imply that it is a better model. If it did then there would be no such thing as over-fitting. (ii) it is irellevant that most real world functions saturate at some point if the current operating point is nowhere near saturation. (iii) there is indeed no physical basis to the flattening model, however the models used to produce the IPCC projections are based on our understanding of physical processes. They are not just models fit to the training data. That is one very good reason to have more confidence in their projections as predictions of future climate (although they are called "projection" to make it clear that they shouldn't be treated as predictions without making the appropriate caveats). (iv) while low-order polynomials are indeed useful, just because it is a low-order polynomial does not mean that there is no over-fitting. A model can be over-fit without exactly interpolating the calibration data, and you have given no real evidence that your model is not over-fit. (v) your plot of the MDO is interesting as not only is there an oscillation, but it is super-imposed on a linear function of time, so it too goes off to infinity. (vi) as there is only 2 cycles of data shown in the graph, there isn't really enough evidence that it really is an oscillation, if nothing else it (implicitly) assumes that the warming from the last part of the 20th century is not caused by anthropogenic GHG emissions. If you take that slope away, then there is very little evidence to support the existence of an oscillation. (v) it would be interestng to see the error bars on your flattening model. I suspect there are not enough observations to greatly constrain the behaviour of the model beyond the calibration period, in which case the model not giving useful predictions.
    0 0
  15. PS: I posted a similar comment on the “Grappling With Change: London and the River Thames” thread but it was removed by the administrator for some reason unknown to me. I don’t see where I have been in breach of the blog’s “Comment Policy”. It would be helpful if the administrator would mention what the problem is with any comment that he decides to remove. Best regards, Pete Ridley
    0 0
    Moderator Response: The name and entire premise of the website you refer to is itself a violation of the comments policy here. Find a better source to cite for the satellite instrumentation issue, preferably one concerned primarily with science as opposed to conspiracy theories.
  16. Admin, sorry that I hadn’t realised from the blog’s comment policy that even mention of the blog I linked to was “itself a violation”. I hope that you consider Climate Realists (Note 1) to be “a better source to cite for the satellite instrumentation issue” and I submit another modified version (the fourth) of the comment that you found unacceptable. Alden, on 3rd August NewYorkJ at 09:12 said “The statistical significance argument is also of limited value when you're dealing with a variety of indicators. .. Then there is satellite data, which is mostly independent. I believe these reach similar levels of confidence as HadCrut over this time period .. ”. I tried to post the following comment today on your “On Statistical Significance and Confidence” article but it was removed for some reason. Perhaps it was considered to be off-topic, which can’t be the case on this thread. You say in the “On Statistical Significance … ” article “So let’s think about the temperature data from 1995 to 2009 and what the statistical test associated with the linear regression really does .. ” but there is a much more fundamental test to be undertaken on those data. By far the greatest contribution to “Statistical Significance and Confidence” is the integrity of the raw data itself. There is much scepticism about this, only days ago highlighted by the revelations about another set of data purporting to be representative of global temperatures during a similar period. I refer here to the satellite data used by NOAA in support of its claims about global temperature change during the past decade. On 12th August the “Climate Realists” blog posted an article “Official: Satellite Failure Means Decade of Global Warming Data Doubtful by John O'Sullivan”. It provided links to two articles by John O’Sullivan. The first “US Government in Massive New Global Warming Scandal – NOAA Disgraced” reported on 9th August of significant errors in data collected by the NOAA-16 satellite. The second links to John’s follow-up article “Official: Satellite Failure Means Decade of Global Warming Data Doubtful” of 1th August in which he starts with “US Government admits satellite temperature readings “degraded.” All data taken offline in shock move. Global warming temperatures may be 10 to 15 degrees too high” and concludes “With NOAA’s failure to make further concise public statements on this sensational story it is left to public speculation and ‘citizen scientists’ to ascertain whether ten years or more of temperature data sets from satellites such as NOAA-16 are unreliable and worthless”. Everything in between is worth reading, as are the numerous postings about it flying around the blogosphere – enjoy. NOTES: 1) see http://climaterealists.com/index.php?id=6127&utm_source=feedburner&utm_medium=feed&utm_campaign=Feed%3A+ClimaterealistsNewsBlog+%28ClimateRealists+News+Blog%29 Best regards, Pete Ridley
    0 0
  17. Here’s the latest comment from John O’Sullivan on the response to his articles: “Since writing those articles concerned researchers have come forward to offer more shocking information regarding systemic failures in the satellite temp. measuring network. The following are what I have so far been advised are the key areas of concern. Please feel free to add this information to your communications with other interested parties-it seems as if the entire edifice of credibility in the satellite temp recording is about to collapse: * The NPOESS (National Polar-orbiting Operational Environmental Satellite) will not have any sensors that measure the sun’s energy output on the 2nd and 4th satellites. * The GOES-R (Geostationary Operational Environmental Satellite-R Series) has had 14 sensors cancelled. No data for cloud base height, ozone layer, ocean color, ocean turbidity and cloud imagery, snow cover, etc. Effectively neutered. * Landsat 7 (currently in orbit) is broken leaving data gaps. Scientists do not get all the information they should. * No sensor for movement of greenhouse gases and pollutants. * No sensor to monitor temperature changes on Earth over time. * The sensor to measure how Earth’s temperature reacts to changes in Solar energy was cancelled by the Obama Administration at the end of June 2011”. John also advises that Dr. Roy Spencer says “"We always had trouble with NOAA-16 AMSU, and dropped it long ago. It had calibration drifts that made it unsuitable for climate monitoring. Obviously, whatever happened to NOAA-16 AVHRR (or the software) introduced HUGE errors.” [note: climate modelling and climate monitoring are two very different disciplines].” John will keep me updates so I’ll pass further information to. Best regards, Pete Ridley
    0 0
  18. fydijkstra #64: There are certainly pseudo-periodic oscillations going on, as may be expected in a system well outside equilibrium. The simple Akasofu formula "anomaly = LIA recovery + MDO" predicts falling temperatures now - and therefore I wonder if it is not already partly falsified. The trend also seems rather speculative: What is the physical basis for this continuing "LIA recovery" in the 21st century? If, instead, that trend of 0.7-0.8 deg/century, today is part of the AGW trend, it can take quite some time to sort out the best model. Under the AGW assumption, with a 0.15 deg/decade warming trend, a model using just this plain trend, with no covariate corrections may "perform" worse for quite some time than a model with smaller trend and some corrections, like Akasofu's. It's really quite simple: In the short run, you can't beat ad hoc-arguments, and in the long run, the ad hoc-argumenters are gone, they are making new ad hoc arguments somewhere else. This is not a model fitting game, it is a process of finding the best explanatory variables for the long run.
    0 0
  19. Pete Ridley: And the upshot of all this is? Please state the relevance, or else go to a place devoted to discussing sensor details. We have had too much of this already. It MAY be important, but every single case I have seen investigated so far (cfr the weather stations) have ended up rather affirming than invalidating the consensus about the temperature series. The main trouble you run into, is that too many independent observations all confirm the same overall picture.
    0 0
    Moderator Response: You're right that discussion of the technical details of satellite measurement of temperatures is off-topic for this thread. Fortunately, there is a new thread dedicated to clearing up the confusion over this subject: Of satellites and temperatures
  20. Any thought that warming 'stopped' should be quashed by the July RSS temperatures. This graph shows global (-70 thru 82.5 lat) temperature anomalies. I've calculated an average for Jan-Feb-Mar and one for Jun-July-Aug, setting the times for each average accordingly. The dreaded straight line trend is the same for both, representing 0.17 degC/decade. I like the seasonal averages: nobody remembers what the average temperature was for a given year, but we sure do take note of the extreme summers and winters. Despite the three cold winters ('85,'89,'93) and corresponding mild summers (one cooled by Mt. Pinatubo), its inconceivable that anyone looking at this graph could not see the upward trend. Yeah, its a short time frame (although 30 years is, by most accounts, a generation). So the predictable next step is to condemn all satellite data, as discussed in #67-68 above.
    0 0
  21. Dikran (#65) your 5th remark: “but it is super-imposed on a linear function of time, so it too goes on to infinity.” Yes, the oscillation in Akasofu’s model is super-imposed on a linear trend. We don’t know how long this trend will continue. Not to infinity of course, because nothing in the climate goes on to infinity. We can look at Roy Spencers reconstruction of 2000 years of global temperatures. I gave the link in my previous posting, but here is the graph. “it would be interesting to see the error bars on your flattening model. I suspect there are not enough observations to greatly constrain the behaviour of the model beyond the calibration period, in which case the model [is] not giving useful predictions.” It is not possible to calculate error bars with only 10 points on a flattening curve. I used this flattening function only to show, that the data fit better to a flattening curve than to a straight line. This is only about the data onto the present, it is not a prediction. When it is said that ‘global warming has stopped’ this is only about the data onto the present. Nobody denies that it is possible that global warming will resume. SNRatio (#69): “The simple Akasofu formula "anomaly = LIA recovery + MDO" predicts falling temperatures now - and therefore I wonder if it is not already partly falsified.” No, the Akasofu model does not exactly predict the year when the falling temperatures should continue. Moreover, just as with the model of ever rising temperatures, there is noise in the data. Akasofu’s model perfectly fits with the data so far. “The trend also seems rather speculative: What is the physical basis for this continuing "LIA recovery" in the 21st century?” See my above given reply to Dikran.
    0 0
    Moderator Response: See the Skeptical Science posts are "We’re coming out of the Little Ice Age" and "Climate’s changed before."
  22. Presuming for a moment Akasofu were right, I'm sure I'm not the only one to point out that what we're doing to the atmosphere will be added to whatever Akasofu's model might predict, which in turn is paltry in comparison to the GHG effect. So ~0.015 degrees C warming per decade per Akasofu will be added to the observed ~0.13 degrees per decade per anthropogenic forcing. Of what relevance is Akasofu's work right or wrong? Much? Little?
    0 0
  23. fydijkstra at 05:48 AM on 15 August, 2010 To me that's simply too much ad hoc-ery to be realistic fydijkstra. (i) Braun et al (2005) explicitly rule out the 1470 year cycle for Holocene events. Their tentative conclusion for the driving of Dansgaard Oescher phenomena relates to the possibility of threshold events resulting from meltwater pulses involving massive N. Hemisphere ice sheets that result in large temporarily perturbation of the thermohaline circulation with dramatic and rapid effects on temperature in the N. Atlantic. We know these processes have nothing to do with current global warming. In any case the current warming is out of phase with the supposed "cycle" (if the peak of the last cycle was around 800-900 AD then we shouldn't be getting a new peak until 2300-2400). Or are you suggesting that we've got another 300-400 years of relentless warming due to some uncharacterised putative cycle? (ii) This seems a little unlikely in the context of the Spencer/Loehle and Akasofu's notions. Firstly, if one were to take the Spencer/Loehle sketches at face value, then we should take on board that their sketches only go to 1935. If we add on the real world warming since then, current temperatures are already well above the supposed maximum of the Loehle/Spencer sketch you reproduced. We're surely much warmer than we should be if our temperatures were dominated by your 1500 year cycle which projects a substantial warming from natural causes still to come... (iii) Akasofu proposes a linear "recovery" from the LIA that continues to this day and through the next ~ 100 years. That seems astonishing to me. It implies that the Earth has a much higher sensitivity to changes in forcings than current understanding would support, and that the climate system has such an extraordinary inertia that "recoveries" (from temperature perturbations) are dominated by processes with time constants on the century timescale or longer (how can this possibly be true?). Let's hope that Akasofu isn't correct else we're probably in a lot more trouble than we think we are! (iii) Of course we probably don't believe Akasofu's ad hoc-ery if we think about it for a bit. Looking at the temperature record (reconstructions and direct measurements from the mid 19th century) indicates that "recovery" from the LIA was largely complete by the early 19th century. (iv) I suppose the other problem inherent in ad hoc-ery is that the ad hoc decision to project the "Braun et al" cycle into the Holocene (where Braun et al state it doesn't apply) seems entirely incompatible with Akasofu's ad hoc construction. Akasofu's sketch doesn't show any of these supposed 1500 year cycles? And while according to Akasofu, we should be already heading into a cooling phase which will continue for another 20-odd years, according to the 1500 year cycle idea we should still be on a rather relentless warming "curve" that should continue for another 300 or more years... (v) Is there a good reason for rejecting everything we know about the climate system, and basing our ideas on mutually incompatible ad hoc notions? I can't think of one!
    0 0
  24. fydijkstra "Yes, the oscillation in Akasofu’s model is super-imposed on a linear trend. We don’t know how long this trend will continue. Not to infinity of course, because nothing in the climate goes on to infinity." Yes, and the same could be said of a linear model used to determine more recent trends. It seems to me that you are being a little inconsistent there. "Here we see a multi century oscillation with a wavelength of about 1400 years" The human eye is great at picking out cycles that are merely the result of random variation. That is why science has developed the use of probability and statistics to guard against such mistakes of intuition. Again there isn't even two full cycles shown in the graph, so projecting forward on that basis is a guess, nothing more. BTW, Roy Spencer isn't the only person to have come up with a 2000 temperature reconstruction - what do the others say? "It is not possible to calculate error bars with only 10 points on a flattening curve." Nonsense, if you were fitting using maximum likelihood based methods, of course it is possible to calculate error bars. "I used this flattening function only to show, that the data fit better to a flattening curve than to a straight line." I think I may have mentioned that fitting the calibration data better doesn't mean the model is better because of over-fitting. This is especially relevant when there are only a handful of data. "When it is said that ‘global warming has stopped’ this is only about the data onto the present. Nobody denies that it is possible that global warming will resume." The principal cause of variability is ENSO, which involves a transfer of heat between the oceans to the atmosphere. That means you can't unequivocally tell if global waring has stopped by looking at air temperatures alone, as there may still be a net warming of the Earth as a whole but a transfer of heat from the atmosphere to the oceans. The test does show that air temperatures haven't risen much (if you choose the start date in the right place).
    0 0
  25. fydijkstra at 05:48 AM on 15 August, 2010 The Akasofu reference is of course countered by a large body of peer reviewed work, and he admits he is not a climatologist. I have not seen any proposed mechanism for the “recovery from the little ice age”?, and to describe this (or other events) as “natural” without explanation or suggested “natural” causes seems disingenuous. Though there are some different views on the relative proportions of known natural and anthropogenic warming/cooling, very few scientists do not believe that there is a significant recent anthropogenic warming trend - with other effects superimposed. The current scientific mainstream view is that Northern Hemisphere temperatures during the last millennium have generally fallen, that global temperatures in the past have been driven by a combination of orbital, solar and volcanic forcings, with various feedbacks operating. The industrial age has brought dramatic and accelerating increases in greenhouse gases, and also an abrupt reversal of the cooling trend. The solar and volcanic forcings still have an effect on climate, but the GHG forced component is now dominating other factors, see for example Lean 2010. The “Spencer” chart you refer to is actually from Loehle 2007, and several more comprehensive reconstructions have been done since which show that the Medieval Warm Period was most likely not as warm as currently (as you - and certainly Spencer - should surely appreciate) and which do not show obvious evidence of any periodic variations. Referring to Guiot 2010 we see that additional forcing (beyond the known natural factors) is needed to give anything close to the same NH summertime temperatures as in the “Medieval Warm Period”. Servonnat 2010 and other related papers reinforce this. Incidentally the tree ring divergence problem that Spencer refers to has been recently addressed by workers such as Buntgen 2008, Esper 2010, and others. The so called 1470 year cycle you refer to, and the modeling work ( Braun 2005) you cite, is to do with glacial period rapid NH warming/cooling cycles that have since been found to have precursor events in the Southern hemisphere and have (as far as we know) nothing to do with recent trends. The existence of any solar contribution to these glacial "cycles", or rather events, is still being debated, as for some of the events a solar explanation simply does not fit, and some of the isotopic analyses used to give proxies for the solar variations are being questioned in the light of new evidence (for example from the Voyager mission , see Webber 2010) which implies greater impact of local climate on Be10 isotope formation rather than a purely solar cause. You should also be aware that rising CO2 has also been implicated as a causal factor in at least some of these DO events, for example see Capron 2010. Given current very high or record 12 month rolling average temperature records, ongoing updated decadal trends or multidecadal trends, from independent sources, it seems unlikely that global warming has "stopped".
    0 0
  26. I'd be very grateful if someone could provide an update on this topic (to answer someone elsewhere). Would data gathered in the last year alter the statement that "...there has (only just) been no statistically significant warming since 1995... etc."?
    0 0
    Response:

    [DB] Tamino examined this issue back in January here.

    Based on his analysis, the warming since 2000 is statistically significant (the error bars do not include zero):

    CRU

    Considering the Aughts (the decade 2001-2010) were the warmest in the instrumental record, with 2010 being tied for the warmest year on record, you can safely say that global warming is still happening today.

  27. Thanks, Doug. For the record, you'll find the response where I used the info in the thread here.
    0 0
  28. Dikran, I didn't see this thread with comments when I posted on the staircase thread, only the print version. One of my questions is answered in the comments, that complex models should be congruent with some underlying physics. Why would linear models be exempt from that? Second, there is a linear trend shown in post 63 that is labeled "recovery from the LIA", which appears to be an estimate of an average natural warming trend. Is that a valid model of the "recovery" or is it invalid? (IMO, not really valid). There are a variety of arguments about the LIA and recovery from http://climate.envsci.rutgers.edu/pdf/FreeRobock1999JD900233.pdf (a heavier emphasis on volcanic activity and other natural factors) to http://www.arp.harvard.edu/sci/climate/journalclub/Ruddiman2003.pdf (natural factors are mostly cooling and warming including post-LIA is anthropogenic). I don't believe the science is settled on that topic.
    0 0
  29. Eric (skeptic) "Why would linear models be exempt from that?" They are not really, if they are intended to be a model of the data generating process. However they can also be used as a method of estimating the local gradient of the data generating process, in which case they need only be locally congruent. The choice of model depends on the nature and purpose of the analysis. For the graph in 63, I would say it is not a reasonable model for "recovery from the LIA" as GMST is already higher than the temperatures prior to the LIA. See also my comments in post 64. However please do not discuss the LIA any further on this thread as it is clearly off-topic.
    0 0

Prev  1  2  

You need to be logged in to post a comment. Login via the left margin or if you're new, register here.


The Consensus Project Website

THE ESCALATOR

(free to republish)


© Copyright 2024 John Cook
Home | Translations | About Us | Privacy | Contact Us