Climate Science Glossary

Term Lookup

Enter a term in the search box to find its definition.

Settings

Use the controls in the far right panel to increase or decrease the number of terms automatically displayed (or to completely turn that feature off).

Term Lookup

Settings


All IPCC definitions taken from Climate Change 2007: The Physical Science Basis. Working Group I Contribution to the Fourth Assessment Report of the Intergovernmental Panel on Climate Change, Annex I, Glossary, pp. 941-954. Cambridge University Press.

Home Arguments Software Resources Comments The Consensus Project Translations About Support

Bluesky Facebook LinkedIn Mastodon MeWe

Twitter YouTube RSS Posts RSS Comments Email Subscribe


Climate's changed before
It's the sun
It's not bad
There is no consensus
It's cooling
Models are unreliable
Temp record is unreliable
Animals and plants can adapt
It hasn't warmed since 1998
Antarctica is gaining ice
View All Arguments...


Username
Password
New? Register here
Forgot your password?

Latest Posts

Archives

NASA-GISS: July 2010-- What global warming looks like

Posted on 13 August 2010 by Doug Bostrom

"Where's the evidence" is the frequent demand of folks doubting what science tells us of climate change. This isn't surprising because we're looking at a system with enormous inertia and so climate shifts will generally show up as incremental creep over a long period of time. We can look at years of results nicely presented by such tools as NOAA's "Climate Indicators" visualization page but what we see there is nothing we'll notice happening on a day by day basis in our lives.

Weather effects of climate change are elusive when it comes to attribution; an unusual spate of hot weather simply can't be put down to a variation in climate without being viewed in a larger context. Indeed it's best for us laypersons to avoid attributing weather we may feel is unusual to any particular cause. Heavy snowfall last winter was frequently cited as evidence of a halt in global warming or evidence that anthropogenic climate change had been exaggerated; our personal feelings overrode what science told us we could expect of climate change.

There is however a means of separating our gut instinct about today's weather from more objective means of assessment. We can look at any day's weather from a statistical viewpoint. Compared to typical climatology, how does today's weather stack up? How does a sequence of days look? What does the frequency and magnitude of new weather records tell us?

Meehl 2009 looked at weather statistics from the perspective of the ratio of record high and low temperatures over the past few decades. In general we'd expect a large thermometer network of stations in operations for many decades to exhibit a more or less 1:1 relationship of new record highs versus lows. But the statistics clearly show otherwise:
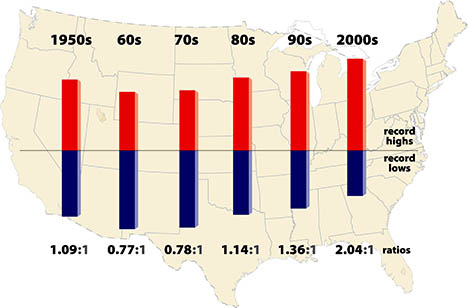
Meehl shows how a statistical look at weather events can tease out information about which way our climate is heading. But this is still not something that can be described as a notable phenomenon, an event that gives us an intuitive feel for the changing behavior of our climate.

Sometimes however unusual weather events and patterns can emerge from the statistical background as a noticeable cluster, a burst of dramatic activity that catches our notice. Our intuition may lead us to wonder if we we're witnessing something more significant than weather.

Weather around the planet so far this year has indeed included some unusual events, to put it mildly, occurrences that are notable from a statistical viewpoint and extend a remarkable recent  bulge in records. 75 countries or 33% of the nations on Earth have set historical high temperature temperature records in the past 10 years, versus 15 countries setting record lows. 17 countries have set all-time national high temperature records this year, with only a single country reaching a record low. This has happened in a year where global temperature for January through July of this year is the hottest on record. The 12-month running mean of global temperature is at a record high. Unprecedented monsoon flooding in Pakistan has left some 10% of citizens suffering from flood effects with river flows on the Indus exceeding any past measurements. Russia has seen prolonged temperature extremes far outside the historical record, leaving probability in the neighborhood of 1:1000 in terms of how often we'd expect to see such a phenomenon.

These statistics are in fact so startling that NASA-GISS was moved to title their July 2010 Surface Temperature Analysis "July 2010-- What global warming looks like." The report notes the "statistical loading of the dice" produced by climate change:

"The location of extreme events in any particular month depends on specific weather patterns, which are unpredictable except on short time scales. The weather patterns next summer will be different than this year. It could be a cooler than average summer in Moscow in 2011.

But note in Figure 1, and similar maps for other months, that the area warmer than climatology already (with global warming of 0.55°C relative to 1951-1980) is noticeably larger than the area cooler than climatology. Also the magnitude of warm anomalies now usually exceeds the magnitude of cool anomalies.

What we can say is that global warming has an effect on the probability and intensity of extreme events. This is true for precipitation as well as temperature, because the amount of water vapor that the air carries is a strong function of temperature. So the frequency of extremely heavy rain and floods increases as global warming increases. But at times and places of drought, global warming can increase the extremity of temperature and associated events such as forest fires."

As usual, graphics help us understand the data better. We can see the situation in Russia clearly indicated:
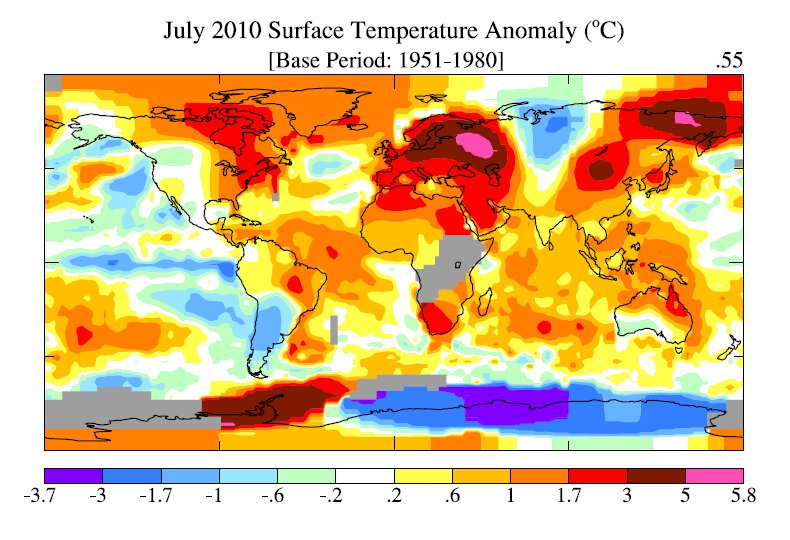
Figure 1 July 2010 NASA-GISS Surface Temperature Anomaly

As we can see from the following graph, the 12 month running mean temperature is at an all time high:
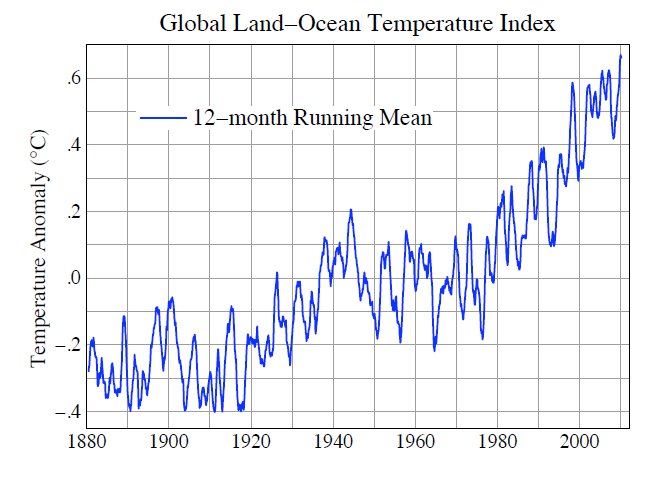
Figure 2 July 2010 NASA-GISS Surface Temperature Analysis

The World Meteorological Organization (WMO) looks at this year more from a weather perspective. In "Current Extreme Weather Sequence" the WMO takes note of the conspicuous nature of this year's weather in Russia:

"According to Roshydromet, the Russian Federal Service for Hydrometeorology and Environmental Monitoring, July 2010 is the warmest month ever in Moscow since the beginning of modern meteorological records, 130 years ago. Temperature has exceeded the long-term average by 7.8° C (compared to the previous record in July 1938 with 5.3° C above average). Record high temperatures varying between 35° C and 38.2° C were registered for more than 7 consecutive days end July, with the heatwave continuing into August. The daily temperature of 38.2° C on 29 July was the highest ever in Moscow (compared to a long-term average of approximately 23° C). The minimum temperature of nearly 25°C (recorded during the night before sunrise) also scored a significant increase compared to the historical average of about 14° C."

The WMO goes on to note events in Pakistan:

"The floods in Pakistan were caused by strong monsoon rains. According to the Pakistan Meteorological Department, the instant rain intensity reached 300 mm over a 36-hour period. The strong monsoon rains led to the highest water levels in 110 years in the Indus River in the northern part of the country, based on past records available from 1929. More areas in central and south Pakistan are affected by the floods. The death toll to date exceeds 1 600 and more than 6 million people have been displaced. Some reports indicate that 40 million citizens have been affected by the floods."

Similarly to NASA-GISS, while careful not to make a bald pronouncement about attribution of these events, neither does WMO avoid pointing out the congruence of unprecedented extreme weather with predictions from climate science:

"Several regions of the world are currently coping with severe weather-related events: flash floods and widespread flooding in large parts of Asia and parts of Central Europe while other regions are also affected: by heatwave and drought in Russian Federation, mudslides in China and severe droughts in sub-Saharan Africa. While a longer time range is required to establish whether an individual event is attributable to climate change, the sequence of current events matches IPCC projections of more frequent and more intense extreme weather events due to global warming. The Monsoon activity in Pakistan and other countries in South-East Asia is aggravated by the la Niña phenomenon, now well established in the Pacific Ocean"

The WMO has more to say on this in their update. It's conspicuous and of course admirable that neither NASA-GISS nor WMO attempt to say "Here's your proof of global warming." Equally it's important that both organizations continue to use their analytic resources to mark those occasions when observations coincide with predictions. 2010 has so far provided ample opportunities for such connections to be pointed out.

All of us live just a single human lifespan; nobody reading these words is likely to wake up 100 years from now and wax nostalgic for the way the weather used to be. As NASA-GISS' title implies, for those of us living in 2010 clusters of statistically extreme weather events are the best grip any of us as individuals will get on what global warming looks like.


0 0

Printable Version  |  Link to this page

Comments

Prev  1  2  3  4  

Comments 151 to 161 out of 161:

  1. Eric, I'm sorry, but this is where a wide canyon opens between us, and between you and the science. Muoncounter and I gave you peer-reviewed papers. You are railing against some very smart people and suggesting/insinuating that they have got it wrong when you say "I would also be careful about using model runs to derive a standard deviation to use to suggest a probability of an event" sounds very Dunning-Kruger-like to me. Actually, I do not think that you read the Stott et al. paper properly or that understand Fraction Attributable Risk (FAR)-- a process originally developed in the medical field IIRC. In fact, you seem to be hand waving to dismiss some inconvenient findings. The inescapable fact is that there has been an increase in heat waves in recent decades and recent major heat waves are consistent with that trend. We can expect more of the same. Maybe people will, hopefully, find the interesting interview with Santer helpful which was featured here. Or this presentation by Stott (partly garbled on my Mac though). Scientists are sincerely doing their best to understand what has happened and what will happen. And as Trenberth said recently: “I find it systematically tends to get underplayed and it often gets underplayed by my fellow scientists. Because one of the opening statements, which I’m sure you’ve probably heard is “Well you can’t attribute a single event to climate change.” But there is a systematic influence on all of these weather events now-a-days because of the fact that there is this extra water vapor lurking around in the atmosphere than there used to be say 30 years ago. It’s about a 4% extra amount, it invigorates the storms, it provides plenty of moisture for these storms and it’s unfortunate that the public is not associating these with the fact that this is one manifestation of climate change. And the prospects are that these kinds of things will only get bigger and worse in the future.”
    0 0
  2. To add emphasis to Albatross' excellent Trenberth quote, people generally have little appreciation for just how much extra moisture that 4% actually is. The total moisture in the Earth's atmosphere in Trenberth's baseline is conveniently close to the volume of North America's Lake Superior. Lake Erie (another of the Great Lakes of North America) is about 4% of the volume of Lake Superior. So it may help to visualize that extra 4% moisture as the equivalent to having Lake Erie added to the air's "gas tanks" - extra moisture capacity to precipitate out. Witness the Pakistan floods of this year or the current and ongoing flooding in Australia... The Yooper
    0 0
  3. Albatross, yes, and that canyon just got wider. I presented real world data which shows a correlation (albeit imperfect) between the external UV and one internal measurement of blocking. Your response is that a probability distribution from a model can be used as a likelihood estimator. That is a huge difference in how we are deriving attribution and a big difference in understanding of statistical attribution (from measurements versus assumptions). The Stott powerpoint says "Human influence has very likely at least doubled the risk of European summer temperatures as hot as 2003". The "very likely" seems to come from the statement that "most of the observed increase in GAT is very likely due to the observed increase in AGG". Next, we need to find a connection from the observed increase in GAT to the blocking pattern in 2003. There is obviously no such connection as GAT is not an input to any process in any model (it is derived from model results only). The model output probability distributions are entirely dependent on input variable distributions and model dynamics and I have seen no indication that model results of blocking events are validated. In fact they tend to underestimate blocking which indicates missing factors such as solar UV that I pointed out. http://www.springerlink.com/index/RDQ5DJ9LQAGPE7LB.pdf (an old study). I agree with Trenberth, the extra water vapor is going to have a big effect, but it doesn't relate to the blocking patterns we are talking about.
    0 0
  4. Eric, Anything but GHGs eh? The UV hypothesis may well be a valid one, but correlations is not causation, especially in the absence of a credible and physical mechanism. Anyhow, what you say does not change the fact that record highs, at least in the USA, are being broken twice as often as record lows. The planet is warming, and heat waves are on the increase. The actual point of me including Trenberth's quote is that every weather event now has both a natural and anthropogenic component. You just agreed to that--and there is no way that what he says applies only to WV. These extreme events do not happen in isolation form the rest of the climate system, it is a continuum. So if one does have a major blocking event in the summer, especially over a large land mass, there will be an anthropogenic signal/component superimposed on that because of the underlying long-term warming trend, which is going to exacerbate the situation. Worse still, the higher night time minima (an AGW fingerprint) reduce the time people have a respite from the heat stress, and that too makes matters worse. There is also something called the "Humidex", and as Trenberth noted (and you agree), there is more moisture out there, which can also potentially increase the apparent temperatures. Now as to exactly what causes blocking events to happen where and when they do, well now that is an interesting area of research.
    0 0
  5. #150: The reconstruction of UV you cite (Haberreiter 2005) is for the period 1975-2002. It shows peaks in the wavelengths 115-400nm that follow a roughly 11 year cycle ('80, '90 and '01). But the amplitude of these spectral irradiance peaks is a mere 0.004 W m-2 nm-1. To put that in perspective, the TOA peak around 500 nm is 2 W m-2 nm-1. I'm astounded that anyone -- especially the same folks who deride CO2 forcing 3 orders of magnitude higher -- put any credibility in that. The word 'blocking' does not appear in this paper. Then there is the NAO link in #147: The '80 UV peak is NAO negative, the '90 UV peak is NAO positive and the '00-01 peak is in between. To go two steps further, summer '03 NAO is near zero, summer '10 NAO is big negative. What is the correlation between UV, NAO and blocking? Isn't it a stretch to even consider this relationship 'crude'?
    0 0
  6. #150: "Temperature causes things, not delta T." Sorry, I just noticed that. Delta T (temperature anomaly) is just the difference between a given measurement and the average for a standardized period; ie, a measure of temperature. A +0.8C deltaT means a higher temperature - which leads to unusual weather events. However, we are looking for the cause of the continuing trend of increasingly positive deltaT; for that, we cannot use cyclical variations. We must have causes that include a largely increasing component. Until the 'natural causes' you want to rely upon can be shown to have that characteristic, they are not part of the story.
    0 0
  7. Albatross, my goal is to explain causes of blocking. Ice free Arctic is at best only a partial cause, or perhaps a factor in lengthening or deepening the blocking. I agree with the rest of your summary regarding the role of CO2 warming in making heat waves worse. As I pointed out in 51, 56 and earlier, record highs are not corrected for UHIE like average temperatures are, so the numbers of record highs is higher and record lows is lower because of UHIE. Muoncounter, a theory of blocking requires more than just a powerful forcing from CO2. The theory proposed in your link in 149 is a reinforcing, not a cause. On another thread you mentioned something about how skeptics are treating winter differently. It is different although some underlying mechanisms might be the same. In winter it might be that the lack of sea ice determines the placement of highs and lows and performs a reinforcement like warmer sea surfaces in summer (from 149). Still that begs for a causal explanation that was present before AGW played any role. NAO is one measurement of blocking, the lower the NAO, the more the blocking. There are other measurements. UV heats the stratosphere, see http://www.springerlink.com/content/h0q4h17u4632671v/fulltext.pdf Low UV cools the stratosphere along with GHG increases, that gives the potential of reinforcing by AGW. Seasonally the solar role would be greater in NH summer. Cooling of the stratosphere and blocking are both cause and effect (see http://ams.confex.com/ams/16Fluid/techprogram/paper_124458.htm) so it seems that the spatial variation in stratospheric temperature plays the greatest role in producing and sustaining blocking events.
    0 0
  8. #157: Eric, I'm just not getting the connection between blocking, UV and the NAO. As I observed in #155, there doesn't seem to be any consistency between NAO and UV. Can you document prior episodes of blocking? Compare those to prior heat waves; see if some kind of chronologic relationship exists? Only then could you unravel what is cause and effect -- and whether the NAO has anything to do with it at all. Recall, too that there are heat waves and droughts in other parts of the world. If it's NAO, then how does it work in Asia or the southern hemisphere? Or does the supposed non-AGW mechanism for all this need to get even more complicated? None of that takes anything away from the observation that extreme weather events, especially heat waves, are consistent with warming. Here is a review of the 2003 European heat wave; both it and 2010 were regional in scope; UHI isn't a factor. Here is a snippet, documenting that it wasn't an urban effect. The 0°C limit rose above 4500 meters elevation for 10 days. This unusual duration increased impacts, especially on shady rock walls at high altitudes, where thaw penetrated considerably deeper than in previous (warm) years and some areas may have been exposed to thawing for the first time.
    0 0
  9. Here is what I expect Giss(nasa) 1st warmest year Noaa 2nd the possible 7-9th ranking dec that is possible made it 2nd in my opinion. Uah-2nd...Not going to quite top 1998, but very near it. Rss-2nd or 3rd? I don't even take the UK one serious because it don't include the arctic.
    0 0
  10. Muoncounter, those are good questions. I need a better blocking metric than NAO and see if that relates to heat waves and other potential causes like UV. I do know that Antarctica is doing its own thing, as AO has been negative the past two NH winters, AAO has been positive http://www.cpc.noaa.gov/products/precip/CWlink/daily_ao_index/aao/month.aao.gif.
    0 0
  11. NOAA NEWS Quote: “Knowledge of prior regional climate trends and current levels of greenhouse gas concentrations would not have helped us anticipate the 2010 summer heat wave in Russia,” said lead author Randall Dole, deputy director of research at NOAA’s Earth System Research Laboratory, Physical Science Division and a fellow of the Cooperative Institute for Research in Environmental Sciences (CIRES). “Nor did ocean temperatures or sea ice status in early summer of 2010 suggest what was to come in Russia.” Quote: "The heat wave was due primarily to a natural phenomenon called an atmospheric “blocking pattern”, in which a strong high pressure system developed and remained stationary over western Russian, keeping summer storms and cool air from sweeping through the region and leading to the extreme hot and dry conditions. While the blocking pattern associated with the 2010 event was unusually intense and persistent, its major features were similar to atmospheric patterns associated with prior extreme heat wave events in the region since 1880, the researchers found." Now the authors do pay obeisance to GW by stating that this event gives us a glimpse at what the effects of GW might be in the future. It is just that this wasn't it. The GW hypothesis did not help in predicting this event. It is not that they are denying GW, just pointing out that it is meaningless in the context of the Great Russian Heat Wave of 2010.
    0 0
    Moderator Response: [DB] Fixed broken link. And if you're going to quote chapter & verse, cease with your cherry-picking & provide relevant context:

    "The researchers cautioned that this extreme event provides a glimpse into the region’s future as greenhouse gases continue to increase, and the signal of a warming climate, even at this regional scale, begins to emerge more clearly from natural variability in coming decades. Climate models evaluated for the new study show a rapidly increasing risk of such heat waves in western Russia, from less than one percent in 2010, to 10 percent or more by the end of this century.

    “It appears that parts of Russia are on the cusp of a period in which the risk of extreme heat events will increase rapidly,” said co-author Martin Hoerling, a research meteorologist, also from ESRL.

    Dole called the intensity of this heat wave a “climate surprise,” expected to occur only very rarely in Russia’s current climate. With the possibility of more such events in the future, studying the Russian event better prepares scientists to understand climate phenomena that will affect the U.S. and other parts of the globe."

Prev  1  2  3  4  

You need to be logged in to post a comment. Login via the left margin or if you're new, register here.


The Consensus Project Website

THE ESCALATOR

(free to republish)


© Copyright 2024 John Cook
Home | Translations | About Us | Privacy | Contact Us