Climate Science Glossary

Term Lookup

Enter a term in the search box to find its definition.

Settings

Use the controls in the far right panel to increase or decrease the number of terms automatically displayed (or to completely turn that feature off).

Term Lookup

Settings


All IPCC definitions taken from Climate Change 2007: The Physical Science Basis. Working Group I Contribution to the Fourth Assessment Report of the Intergovernmental Panel on Climate Change, Annex I, Glossary, pp. 941-954. Cambridge University Press.

Home Arguments Software Resources Comments The Consensus Project Translations About Support

Bluesky Facebook LinkedIn Mastodon MeWe

Twitter YouTube RSS Posts RSS Comments Email Subscribe


Climate's changed before
It's the sun
It's not bad
There is no consensus
It's cooling
Models are unreliable
Temp record is unreliable
Animals and plants can adapt
It hasn't warmed since 1998
Antarctica is gaining ice
View All Arguments...


Username
Password
New? Register here
Forgot your password?

Latest Posts

Archives

The surprising result when you compare bad weather stations to good stations

Posted on 31 August 2010 by Jim Meador

The website surfacestations.org enlisted an army of volunteers to photograph US surface temperature measurement stations and document stations located near parking lots, air conditioners, or anything else that might impose a warming bias. They found that 89% of the stations did not meet the US weather service siting criteria in one way or another. That is not good. Does this prove that a US warming trend is just the artificial influence of parking lots and air conditioners on the temperature record coming from bad stations?

No. Actually, an analysis shows that good and bad stations show very similar trends for temperature over time. The chart below compares data from stations that surfacestations.org identified as good, as well as bad stations. Notice that good stations track very closely to bad stations, and actually the good stations show more of a warming trend!
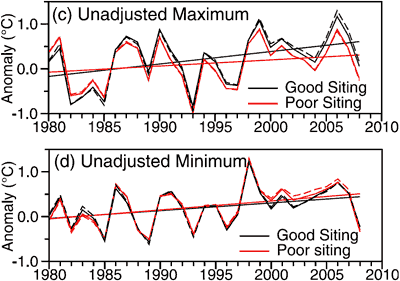
Maximum
Figure 1. Annual average maximum and minimum unadjusted temperature change calculated using (c) maximum and (d) minimum temperatures from good and poor exposure sites (Menne 2010).

The volunteers from surfacestations.org deserve credit for pointing out siting problems of the US Weather Service temperature measurement stations. Unfortunately the fact that good and bad stations show the same upward trend proves that warming in the US is not just a measurement problem. Temperatures are trending upward around the globe, not just in the US. Microsite influences on temperature measurements in the US can't explain the US temperature rise, much less the global rise.

This post is the Basic version (written by Jim Meador) of the skeptic argument It's microsite influences. We're currently writing plain English versions of all the skeptic rebuttals. If you're interested in helping with this effort, please contact me.

0 0

Printable Version  |  Link to this page

Comments

1  2  Next

Comments 1 to 50 out of 70:

  1. That raises the question as to why adjustments are necessary to individual records. By rights a random selection of sufficient stations that represents consistent global coverage, that is constantly changed should provide a consistent global record of temperatures over time irrespective of which individual stations are in each selected mix.
    0 0
  2. The United States Historical Climatology Network (USHCN) is the older of two surface temperature measuring networks in the US, and it is valuable because it is a continuous record stretching back more than 100 years. Over the years changes do occur at each station, and the adjustments are meant to make current readings compare meaningfully to the older measurements. For instance the stations are moved, or the instrument is changed, or the time of day that the measurement is taken changes. All of the adjustments are described here... http://www.ncdc.noaa.gov/oa/climate/research/ushcn/ushcn.html#QUAL Note also that this study pertains to the US HCN surface record only, and does not cover the entire globe.
    0 0
  3. All of the adjustments are described here.
    0 0
  4. I suspect adjustments have something to do with our fascination for units of measurement, JohnD. You could certainly confirm you hypothesis about a constantly morphing collection of instruments with a bit of work; folks like Hausfather et al have beaten a nice, flat path for the rest of us to follow.
    0 0
  5. Would it make sense to add something about the meaning of "anomaly" to this entry? That seems to be a sticking point for a lot of amateurs, and "skeptics" are very good at exploiting the confusion that arises.
    0 0
  6. #1 johnd, your question was pretty nearly answered several months ago, for example by Zeke Hausfather, and several others. I don't recall anyone having taken randomized sets of stations with sufficient global coverage, but unadjusted or adjusted matters very little, nor do several selection criteria for stations that people have proposed. So I suspect you are right, because the adjustments and any station biases are simply smaller than the warming signal.
    0 0
  7. Jeff Freymueller at 13:17 PM, it really goes back to the principles devised to facilitate the acquiring of unbiased representative samples for any form of laboratory analysis. The degree of accuracy of the final result is determined by the refinement of the process of randomly taking samples rather than any concern about what variations might be in any individual sample.
    0 0
  8. No, johnd, random sampling is not alone the only good way to eliminate bias. Randomization always should be used, but only to attempt to reduce leftover biases that cannot or might not be reduced by systematic approaches. The decision of when to attempt to make systematic adjustments is informed by the confidence in identifying systematic sources of bias, and by the difficulty and expense of preventing or systematically compensating for them. Examples of excellent candidates for systematic adjustment are the movement of a temperature station, and its daily measurements being switched from morning to afternoon. This is all basic science and statistics.
    0 0
  9. It is known that sometimes the adjustments for urban heat island introduce biases into the trend. They compare urban stations to nearby rural stations. If the urban station shows more increase they adjust it lower. If the urban station shows less increase they keep it. You would expect some urban station to be higher just by chance. This causes the adjusted values to underestimate the warming. Deniers claims that adjustments raise the trend are false. I think they do the adjustments in an attempt to get the best information possible. As pointed out above, the trend is much larger than the adjustments so it really doesn't matter much.
    0 0
  10. This poses a logical issue. The graphs show there is something effecting an upwards trend in both "well sited" and "poorly sited" stations. But if "poor siting" doesn't matter, _either_ the USHCN guidelines are useless/unimportant for a correct measurement of temperatures and there is no such a thing as "poor siting" (i.e. "warming" can be detected whatever the quality of the siting) _or_ the USHCN guidelines are useful/important for a correct measurement of temperatures, and therefore the upwards trend can't be ascribed to an actual "warming". ??
    0 0
  11. omnologos Correct measurement of temperature isn't the prime requirement for climate trends. Consistent measurement is the important issue. For climate trends we're only interested in the change in temperatures rather than the temp itself. That's why it's important when a new and better thermometer is installed at a site, the first thing that is done is to note the records accordingly. The new temperature recordings mustn't be allowed to falsely show a change in actual temperatures.
    0 0
  12. Omnologos @ 10 - "The graphs show there is something effecting an upwards trend in both "well sited" and "poorly sited" stations." Yes, global warming. The warming signal is so significant it shows up in both good and bad sites. A more interesting question is why the bad sites show less warming, which is why you should read the intermediate version here
    0 0
  13. @adelady and @Dappledwater: I understand my description of the logical issue is too short and cryptic. I will try to reformulate it. Basically if a measurement site needs to follow certain guidelines, then if it doesn't follow those guidelines it should not be included with those sites that do follow those guidelines. Or alternatively, if those guidelines are shown not to matter, then what is the point of the guidelines in the first place? "The warming signal is so significant it shows up in both good and bad sites" is not an answer: if a site is "bad", then by definition it does _not_ correctly measure anything. Same regarding "consistent measurement": a consistently-bad measurement is consistently wrong, again by definition. If a trend appears and it is "right", it's just pure luck with no scientific value or basis (unless, once again, somebody is able to show that the guidelines really don't matter). The above is valid for any measurement setting, not just temperatures. Hopefully nobody wants to destroy the foundations of "measurement science" this side of Galileo.
    0 0
  14. No, omnologos, the definition of a "bad" site does not mean the site fails to correctly measure anything. The siting guidelines do not even include the label "bad." The label "bad" was invented by Watts to exaggerate the shortcomings of some stations, in Watts's desperate attempt to discredit AGW.
    0 0
  15. @Tom Dayton: I was quoting @Dappledwater. In fact, I used quotes 8-) and prefer "poor" to "bad" anyway. Let's go back to the root of the problem here: what are those guidelines about if we are to take on "poorly sited" measurement systems in a cavalier manner?
    0 0
  16. omnologos #15, they have this little handbook which says, 'for best results place your thermometer in an area like this'. Watts decided those were 'guidelines' or 'criteria' and any site which did not meet all of them was 'bad'. All of which is completely irrelevant as those instructions were meant to limit any sort of error in ABSOLUTE temperature measurements... whereas the global anomaly values are based on RELATIVE change in measurements over time... which aren't impacted by most of the siting issues Watts (and now apparently you) obsessed about... as subsequent studies have proved repeatedly.
    0 0
  17. Absolutely pointless to say it, but a thermometer does not have to produce an absolute, accurate or precise reading in degrees anything to identify a trend. We have a vast network of thermometers we can view for this purpose without referring to units at all. This network indicates an upward trend in temperature. This is not very complicated, really. The same network used to produce absolute temperature indications can be exploited for a different purpose, to identify a trend. The trend application benefits in some ways from being expressed in units but actually only needs to be assessed from the perspective of proportionality to derive a useful conclusion. Perhaps the solution is to avoid referring to these instruments as thermometers in this context so as to avoid igniting neurotic obsessions. How about "bulk caloric trend indicator?" But, as I say, pointless to mention it down here. Fortunately normal people who are simply looking for a simple explanation of what's going on the world will not make their way down here into the deep dark, where omnologos is prattling away about guidelines.
    0 0
  18. Another issue relating to Omnilogos questions is what should we do with data that is not perfect? Obtaining 100 years of temperature data is an immense amount of time and effort. Deniers would have us discard all this data because it might have some small flaws. Scientists generally try to correct the record and/or make the best use that they can of the existing data. It makes no sense to throw data away when it can be corrected. As this example shows, the "bad" data replicates the "good" data.
    0 0
  19. @doug_bostrom: if you were right, then there would have been no point in Jim Meador posting this blog at all. Personally, I find it ironic to discover how people worried about temperatures trending upwards show no interest whatsoever in getting those trends right (in a scientific sense). Imaging going to see the doctor if your concern is blood pressure, only to accept the diagnosis even if the sphygmomanometer has been obviously used incorrectly. Worse: imagine going to see 100 doctors, all making mistakes in measuring your blood pressure, only to conclude there must be something wrong because they all said so. Sanity means discarding the opinion of poorly-trained doctors. All of them. Actually, the entire "body" of modern science is based on maths, therefore on numbers, therefore on measurements. Hence, incorrect measurements can only lead to incorrect science. A "poorly sited" station is a serious issue, and the untold number of hours spent by Galileo in getting his measurements right were not a waste of time. Once again: maybe the USHCN guidelines don't matter, regarding warming trends. I am not excluding that possibility. All I am stating is that somebody should show that _that_ is the case. If it is instead considered as an assumption _because of_ the trends, we are in the realm of circular reasoning.
    0 0
  20. omnilogos #19, you just really can't understand can you? "I find it ironic to discover how people worried about temperatures trending upwards show no interest whatsoever in getting those trends right" No. False statement. Everyone here is absolutely interested in getting the temperature trends right. You just can't seem to understand that your objection about thermometer citing is irrelevant to that issue. Here, try a simple thought experiment. Let's say in your yard you put a thermometer out on the black asphalt driveway under direct sunlight and another one in the most heavily shaded area you can find. Two thermometers less than a hundred feet apart, but they are going to show significantly different ABSOLUTE temperatures. Which is 'right'? Both of them are correct for the location they are in. Neither would meet the 'station siting guidelines'. Yet both are perfectly valid for measuring TRENDS. As the day gets hotter BOTH thermometers will register higher temperatures. The absolute temperature readings will differ, the trends over time will not.
    0 0
  21. @michael sweet: "what should we do with data that is not perfect". I am sure it is not news to you that no data is perfect. Some data, however, are (much) better than others. If "good" data show a trend, then "good data show a trend", and "poor" stations should be transformed into "good ones" at once, to contribute to the analysis of the trend. If somebody wants to use "poor data", they should therefore show how the "poor data" can be transformed into "good data". Unless that is done, there is as little meaning in using "poor data" to understand warming trends as in issuing speeding tickets with the use of an incorrectly-placed traffic enforcement camera. No court of law would allow those tickets, no scientist should concern about the "poorly sited" data.
    0 0
  22. Nice attempt at circularity there, omnologos. Let's express it a different way: You're wrong, so why does Jim have to post this blog at all? The answer is that folks like you will continue bashing away with your failed argument about how absolute accuracy in temperature measurements is necessary to identify a trend in temperature and its proportional relevance. This is basically the same pointless distraction as asking "if we can't predict weather, how can we predict climate?" For reasons we cannot know, maintaining confusion here is terribly important to you, enough so that you'll ignore everything you're told regarding the matter. Using your example, if you visit 100 doctors with sphygmomanometers and all of those show similarly high readings, what's the main concern? Will you worry over the absolute accuracy of all of those instruments, or should you instead be motivated to explore whether you may have a pathology causing your blood pressure to rise? You'll choose risking a stroke, for some reason. Personally, I find it ironic to discover how people worried about temperatures trending upwards show no interest whatsoever in getting those trends right (in a scientific sense). Really? How extraordinarily obdurate. Here's a summary of things of which you're probably already aware, but you can still say people are not interested in getting it right?
    0 0
  23. Omnologos: Check out the graph at the top of this post. You will see that the "good" data give the same result as the "bad" data. Deniers like Watts would have us throw out the entire data collection, "bad" and "good", because of the issues you are raising. Scientists have corrected the "bad" data as much as possible. The graph here shows that it is not necessary to correct the "bad" data-- they are the same uncorrected! Looking at the graph in the post I have to ask "what is Omnologos concerned about?" What in this graph makes you doubt the reliability of the temperature record? No data is perfect. We do the best we can with the data we have.
    0 0
  24. Forecasters: "The barometer on station X seems to be off by about 100mb, but it is still trending downward, in line with the other three stations. Observers also report increasing wind and wave activity. Our models indicate a 90% chance that a major hurricane will make landfall here tonight." Omnologos: "Right, whatever! One out of four stations is totally off! That's significant error! 90%? Not good enough! I believe I'll be partying on the beach tonight. Bloody alarmists."
    0 0
  25. Omnologos - Given your doctor example here, if you've visited 100 doctors and received varying results for blood pressure, that means that the accuracy of the various instruments vary a lot. Perhaps some of the are better at calibrating their instruments than others? If you then visit the same 100 doctors a year later, using the same instruments, and see that on all of them your blood pressure is 20 points higher than it was the year before, a trend change - are you going to throw out that trend change because of the accuracy issue? Or are you going to get a prescription for a blood pressure lowering medicine? This actually gets at the difference between accuracy and precision. The adjustments guidelines are intended to maintain both accuracy (calibrate correct offsets for site conditions) and precision (when changing thermometers, adjust for instrument differences). Trend analysis only requires precision and sufficient data, not accuracy for each instrument.
    0 0
  26. @michael sweet: "You will see that the 'good' data give the same result as the 'bad' data". And that _is_ the problem. The answer could either be (a) "it's because 'good' and 'bad' don't have a meaning in matters of trends" (the most popular take, around here). Or (b) "it's because there is something else affecting the measurements, and maybe there is no trend". It's up to science to figure out which is which. If instead we assume it's (a), then it's an assumption, not a finding. And it's not science. If well-constructed clocks drift just as much as poorly-constructed clocks, we can all assume time is dilating, or try to understand what is actually happening.
    0 0
  27. @KR: "This actually gets at the difference between accuracy and precision". No. My example is not about accuracy and precision. My example is about going to see 100 doctors, _all_ making mistakes in measuring your blood pressure. If a doctor doesn't use the diagnostic instruments properly, I go to a doctor that does, don't you?
    0 0
  28. Omnologos, Scientists HAVE analized the data very carefully over decades and they say that there is a trend in temperature. If you want to claim that "it's because there is something else affecting the measurements, and maybe there is no trend" then you need to suggest what that something might be. Otherwise you are just saying "I doubt it" and you have no argument. What do you suggest is causing this trend, in the good and the bad stations, that is not AGW? It needs to explain glacier retreat, seasons changing, sea level rise also. I look forward to your explaination.
    0 0
  29. Omnologos - I stand by my statements regarding accuracy and precision. If your doctors instruments are poorly calibrated they will be inaccurate (offsets from ground truth). If, however, they are precise, they will give the same readings over time. The various issues raised about temperature collection seem to all be about accuracy - arguing that there are offsets for individual instruments due to siting. But these issues have nothing to do with precision, which is driven by consistent use of an instrument, maintaining correct offsets when changing thermometers, changing the time of day for recording values, or moving an instrument - those are all procedural issues, and the only complaints I've seen on those is "It's complicated!" from a couple of posters. Trend analysis only requires precision.
    0 0
  30. So... when confronted with three matching data sets; A, B, and A+B which all show virtually identical results your conclusion is that they must all be wrong? Because some guy with a blog found that set B don't meet a list of criteria which were established for measuring something other (absolute temperatures) than the data sets are looking at (relative temperature changes). When we then add in matching anomaly readings from weather balloons does that mean those are ALSO wrong? The matching satellite temperature record? Thrown off by urban heat islands in space? The various matching proxy temperature sets? Has EVERY temperature reading in the history of the world been wrong? Or are you being ridiculous?
    0 0
  31. I don't think you'll be able to find a doctor you're comfortable with, omnologos. How many have you visited? Have you compared readings? How can you tell if the readings are correct?
    0 0
  32. Hi omnologos, You aren't making a distinction between absolute measurements and trends, and this is something many people overlook. Although on any given day a perfect measurement is great to have, it is not required for trend analysis. If every measurement is off by 100 degrees, every day, over the entire record, then this 100 degree offset does not matter for the trend analysis. It was present at the beginning and at the end, so it does not affect the trend. The graph shows the "Anomaly" which is the difference from a reference point. (Notice that the scale is near zero.) Absolute measurement errors that are present throughout the record don't make it into the anomaly. You mention "poor data" but the point of the Menne study was to show that "poorly sited" stations still provide useful data for trend analysis. "Poorly sited" does not mean "poor data" when it comes to trends.
    0 0
  33. omnologos wrote : "If a doctor doesn't use the diagnostic instruments properly, I go to a doctor that does, don't you?" How do you know when you've found a doctor that uses that instrument properly ? What do you judge the result against ? For me, if a doctor didn't use the instrument properly (but I didn't know - I was suspicious because I got a result I didn't like) and gave me bad news, I would go to another. If the next one told me the same bad news, do I suspect that he/she doesn't know what he/she is doing too, or do I face up to reality ?
    0 0
  34. It is ironic that omnologos cites Galileo who I would posit never made 'accurate' measurements. He had no timepiece, his compass was probably only accurate to a degree, his lenses were imperfectly ground etc, but his contribution to science is immeasureable.
    0 0
  35. omnologos, all your doctors' blood pressure readings of you are "wrong" by your criteria! You will never be able to find a doctor meeting your criteria, because there is no such doctor! If you research the definition of "blood pressure," you will discover that the concept is useless without an operationalization. Then you will be dismayed to discover that there are in fact a bunch of operational definitions, involving the patient sitting, lying, standing; the instrument being on the wrist or arm or other body part or even inserted in a blood vessel; the instrument being a microphone or a health care provider's ears in a stethoscope or a direct pressure sensor; and even the strength of the sound that marks the trigger for the measurement has multiple values. Have you ever noticed that none of your doctors has ever been consistent in demanding your posture be precisely "correct" for precisely one of the many requisite durations before measuring your blood pressure, let alone insisting that you be at the doctor's office at precisely the same time of day?
    0 0
  36. Hi again omnilogos "My example is about going to see 100 doctors, _all_ making mistakes in measuring your blood pressure." Right, your example is about absolute accuracy. In this case, the right example would be going to see these 100 doctors every day for 30 years, and the doctors all make consistent errors in measuring your blood pressure. At the end maybe you would not know your absolute blood pressure, but you would certainly be able to tell how it had gone up or down over the years. You would know a lot about the trend. You CAN get useful trend information from imperfect data, and that is the point of the Menne paper.
    0 0
  37. Just to clarify: we are talking about USHCN criteria, not mines. Seemingly I have started off something 'round here. Since I find it less than kind to hijack somebody else's blog with a salvo of comments, apologies to all but I'll suspend things here, and perhaps post a note or two later today, plus something in my own blog. I strongly suspect we have all made our points, sometimes more than once, and could continue for weeks. That's part of the good/bad nature of the 'net. Thank you all, and to John Cook and the other authors, for the intellectual challenge.
    0 0
  38. I must remember to wait for 24 hours after reading omnologos' posts before getting my blood pressure measured. Anti-science rantings such as his put my blood pressure up by way too many points.
    0 0
  39. #37 I strongly suspect we have all made our points, sometimes more than once, and could continue for weeks. I strongly suspect that of the people who made their points here, exactly one of them was consistently wrong.
    0 0
  40. Yes, Phila, one might say it's more waste heat. Heat, but no more light.
    0 0
  41. Omnologos @13 - "The warming signal is so significant it shows up in both good and bad sites" is not an answer" And yet the warming shows up in both good and bad/poor sites, how do you explain that?. You might consider that some deep dark mystery, however......... Oh, and you do realize that if the data from the bad/poor sites is discarded (which seems to be the skeptic solution to everything they find inconvenient) then the US record will be adjusted upwards?. Given that science seems to take a back seat to your world view, is that really what you want?.
    0 0
  42. It's not bad/good data. It's good/better data. Problem solved ...
    0 0
  43. And yet it should have been simpler to get. Even Jim Meador gave a hint of this, by putting "surprising" in the title of the blog. Why? Because... 1. "Good stations" show a warming trend --> good evidence for a warming trend 2. "Bad stations" show a warming trend too --> "surprising result" The "surprising result" shows (a) that "good" or "bad" is not a relevant way of categorizing stations regarding warming trends, in other words the work done by surfacestations.org is irrelevant in that respect OR (b) that the warming trend is spurious. Tertium non datur. I really can't see what there is of anti-scientific in stating such an obvious truism. Au contraire...if people want to go for (a), they should justify it in a scientific way. Please do. And before anybody asks...of course (a) is more likely than (b) ("actually the good stations show more of a warming trend!"). But I am not interested in opinions about it, rather the science. This is about "skeptical science" after all, non kindergarten's.
    0 0
  44. omnologos #43: "This is about "skeptical science" after all, non kindergarten's." Troll or fool. I no longer care.
    0 0
  45. omnologos, my initial post was removed so I'll just say that you have been GIVEN the information you say you are looking for... repeatedly. You have failed to address it. That makes me think... 'bad things' about you. If you really think you are having a reasoned conversation here you might want to try looking at the points people have raised and the further information in the links supplied and then either acknowledging that they dismantle your position or explaining why you think they do not.
    0 0
  46. Omnologos, more like: 1. "Good stations" show warming trend. Yup, tallies with observations of the natural world - 2. "Bad/poor stations" show even more warming trend. WTF?. That's surprising!. What a waste of all those junior woodchucks time (for them that is - helpful though in a blog science way) 3. Oh that's why 4. Insert latin phrase of one's choice here (learnt that from the Wizard of Oz). Reductio ad absurdum?,...........argumentum threadbearum?...........
    0 0
  47. I always thought that the word 'surprising' in the title was being used ironically, even sarcastically.
    0 0
  48. thank you @Dappledwater. So we are back to "Menne 2010". Good to know. And by the way (surprise, surprise!) this is from that paper's conclusions: "The reason why station exposure does not play an obvious role in temperature trends probably warrants further investigation" QED (yes, that's for your Latin craving)
    0 0
  49. Actually Omnologos, the moment a skeptic starts using latin quotes, my spidey senses start going off. Well honed now. As for the conclusion of Menne et al, I too would have expected the opposite result i.e. poorly sited stations to be biased too warm. Perhaps the guidelines are unnecessarily too stringent?, maybe the people who laid down the guidelines over estimated the effects of possible biases?. In engineering for example, structures and buildings don't necessarily collapse because they don't meet a certain specification - normally because there's a large safety margin factored in to calculations. (Not that I'm suggesting shoddy work is good practice mind you) But that's for the scientists to examine.There's one conclusion I definitely would not draw - spurious warming. See graphic posted earlier.
    0 0
  50. Omnologos - The so-called "good" and "bad" station identifications from Watts reflect adherence to placement guidelines intended to ensure accuracy, adherence to ground-truth, minimal offsets between the station temperatures and local conditions. As stated before (repeatedly, by several people) trend analysis of anomalies (changes) is not dependent on accuracy, but rather on precision, repeating the measurement the same way every time for each station. Fixed offsets, as addressed in the placement guidelines, are completely irrelevant for anomaly trends - they're removed as soon as you look at the differences over time. So what does this mean? It means that Watts "good/bad" labeling is not terribly relevant for trend analysis. There does seem to be a small difference in the range of temperatures between the so-called good and bad sites; the "bad" sites show smaller temperature swings and slightly less warming. Perhaps the 'air-conditioners' or other issues with some sites are insulating the stations from full temperature swings. But when you get down to the actual numbers, the charts above, it just doesn't make a difference in the trend data - the warming trend is not spurious. If you (as you have been doing) assert that it does make a difference, then you should calculate a significant trend difference statistic between subsets of the stations and show it.
    0 0

1  2  Next

You need to be logged in to post a comment. Login via the left margin or if you're new, register here.


The Consensus Project Website

THE ESCALATOR

(free to republish)


© Copyright 2024 John Cook
Home | Translations | About Us | Privacy | Contact Us